. 2023 Nov 10;8(89):eadi9066.
doi: 10.1126/sciimmunol.adi9066. Epub 2023 Nov 10.

Zfp281 and Zfp148 control CD4+ T cell thymic development and TH2 functions

Affiliations

Zfp281 and Zfp148 control CD4+ T cell thymic development and TH2 functions

Laura B Chopp et al. Sci Immunol. .

Abstract

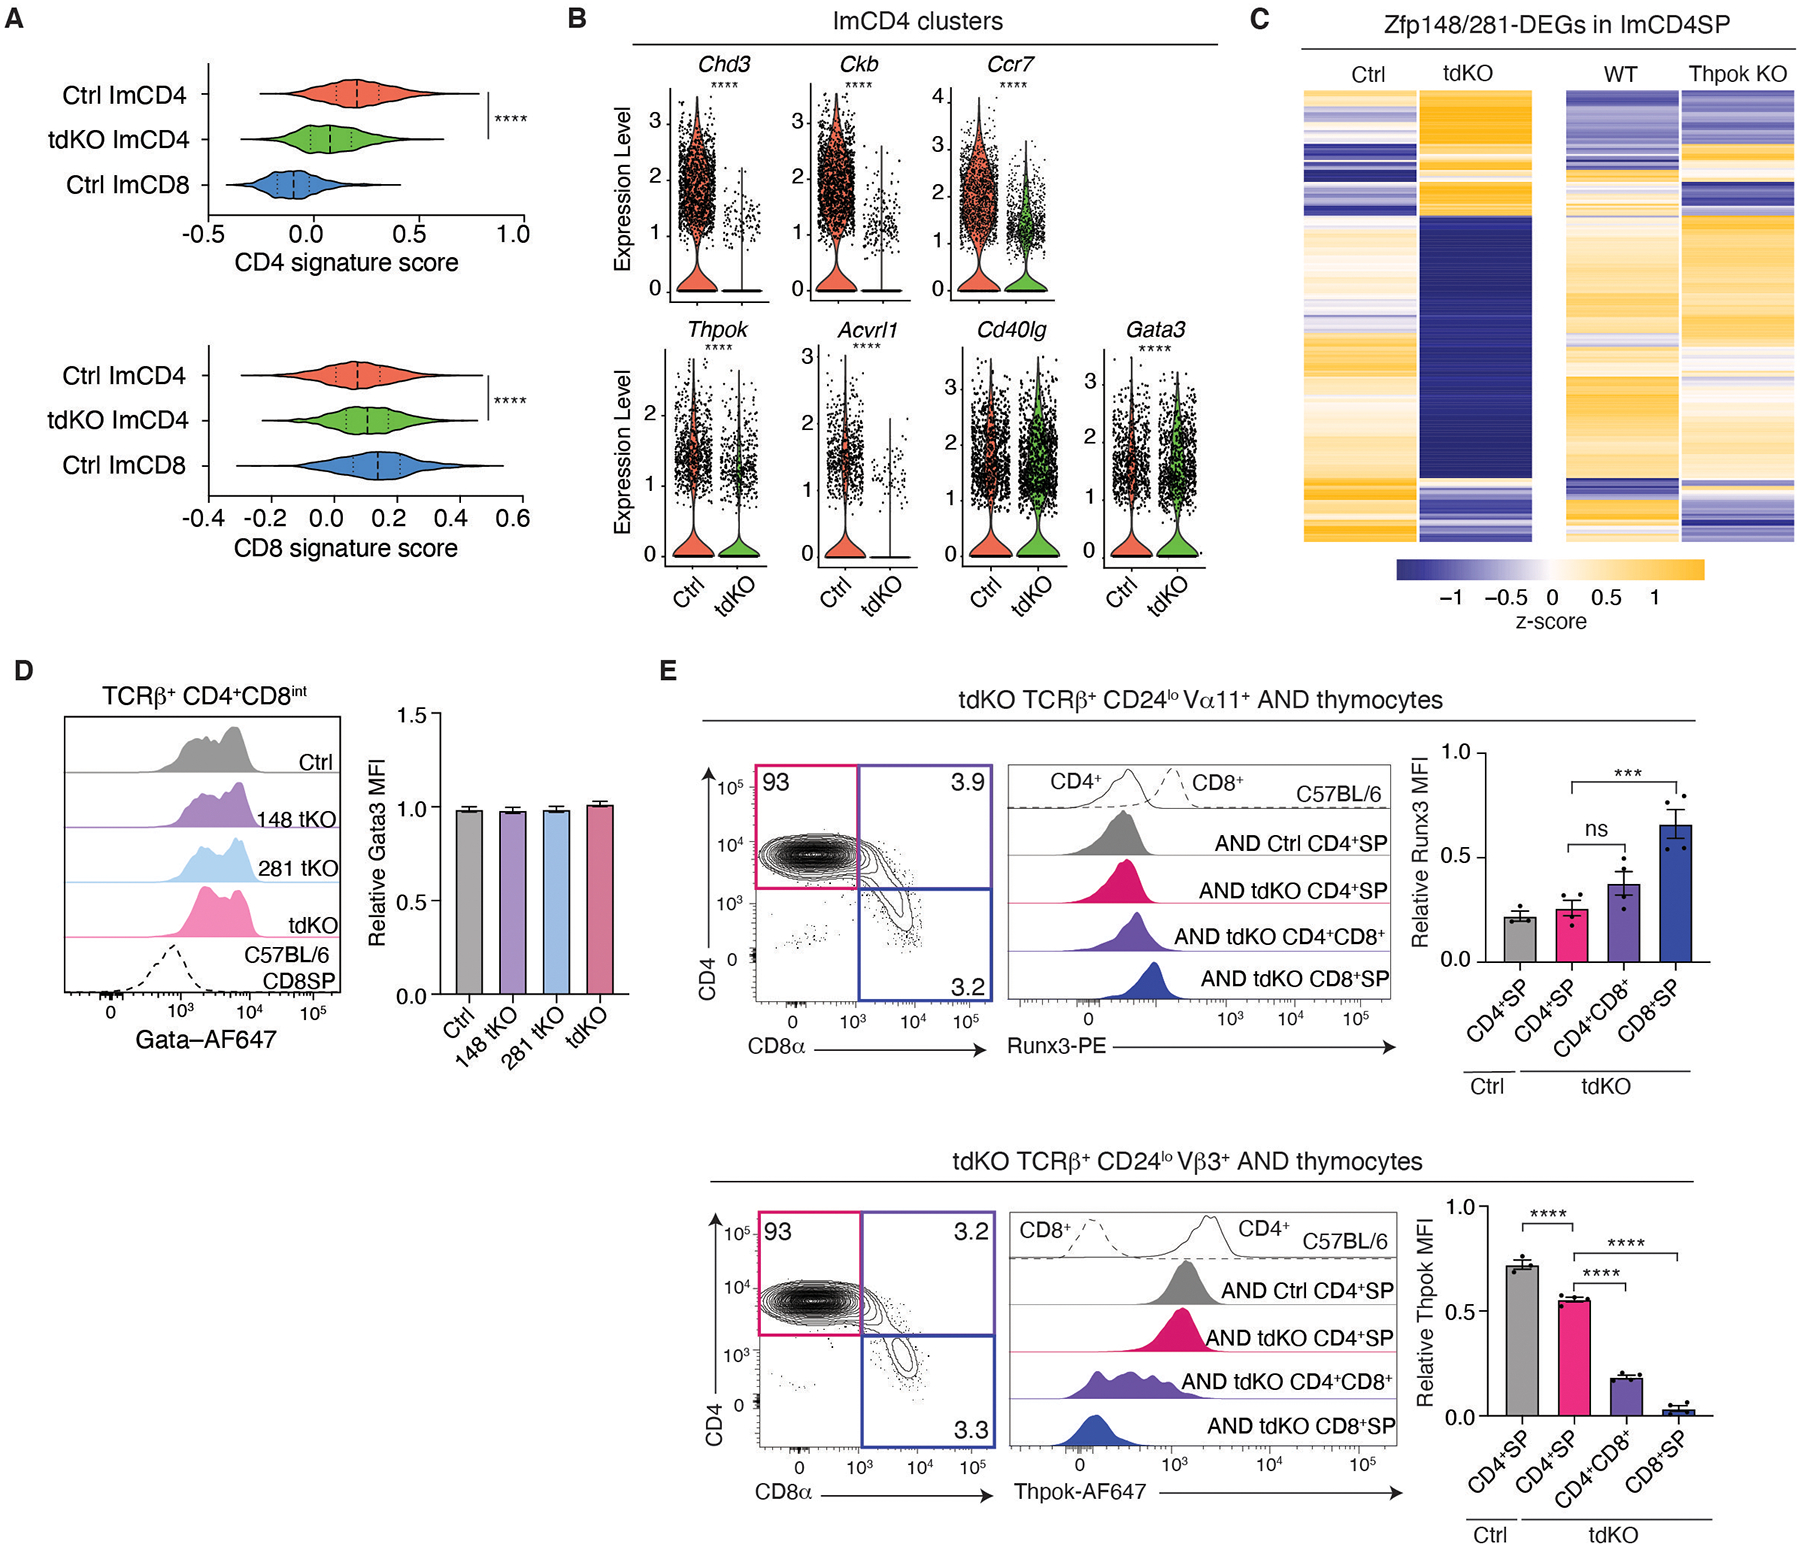
How CD4+ lineage gene expression is initiated in differentiating thymocytes remains poorly understood. Here, we show that the paralog transcription factors Zfp281 and Zfp148 control both this process and cytokine expression by T helper cell type 2 (TH2) effector cells. Genetic, single-cell, and spatial transcriptomic analyses showed that these factors promote the intrathymic CD4+ T cell differentiation of class II major histocompatibility complex (MHC II)-restricted thymocytes, including expression of the CD4+ lineage-committing factor Thpok. In peripheral T cells, Zfp281 and Zfp148 promoted chromatin opening at and expression of TH2 cytokine genes but not of the TH2 lineage-determining transcription factor Gata3. We found that Zfp281 interacts with Gata3 and is recruited to Gata3 genomic binding sites at loci encoding Thpok and TH2 cytokines. Thus, Zfp148 and Zfp281 collaborate with Gata3 to promote CD4+ T cell development and TH2 cell responses.


Conflict of interest statement

Competing Interests Statement: The authors declare no competing interests.

Figures

Figure 1:
Figure 1:. Zfp148 and Zfp281 promote expression of Thpok and CD4+ T cell development.
(A) Heatmap shows row-standardized average gene expression in indicated subsets from population RNAseq [original data from Ref. (11)]. Color scale at the bottom (units: standard deviation). (B) Contour plots show TCRβ vs. CD24 (top) or CD8α vs. CD4 (bottom) expression on CD44lo thymocytes from indicated mice. (C) Bar graphs show subset cell frequencies and numbers across genotypes. (D) Stacked histograms (left) show Thpok expression, as assessed by intra-cellular staining and flow cytometry, in TCRβ+CD4+ SP thymocytes from indicated genotypes. Dashed line (bottom histogram) shows Thpok staining in wild-type (C57BL/6, B6) CD8+ SP thymocytes. Bar graphs (right) show Thpok mean fluorescence intensity (MFI), expressed relative to wild-type CD4+ SP thymocytes stained in the same experiment and set to 1. (E) Contour plot (left) shows CD8α vs. CD4 expression on TCRβ+ CD44lo splenocytes from Ctrl or tdKO AND TCR transgenic mice (cells gated as Vα11+, Vα8.3, Vα2). Bar graphs (right) show the percentage of CD8α-expressing cells from either genotype. (F, G) Thpok and Runx3 expression in AND T cells. Stacked histograms (left) assess indicated populations of AND TCR mice for intra-cellular Runx3 (F) or Thpok (G) expression; in each panel, overlaid histograms (top) show expression in B6 CD4+ and CD8+ T cells. Bar graphs (right) show Runx3 or Thpok MFI, expressed relative to that in B6 CD8+ (Runx3) or CD4+ (Thpok) T cells stained in the same experiment, and set to 1. (H) Contour plot (left) shows CD8α vs. CD4 expression on Vα11+ TCRβ+ CD24lo thymocytes from Ctrl or tdKO AND TCR transgenic mice. (C-D) significance calculated with a one-way ANOVA and Dunnett’s multiple comparisons test; n = 20 (Ctrl), 8 (Zfp148 tKO), 9 (Zfp281 tKO), and 12 (tdKO) mice. (E, H) significance calculated with a two-tailed student’s t-test, data from three independent experiments with a total of 4 Ctrl and 5 tdKO mice. (F, G) significance calculated with a one-way ANOVA and Dunnett’s multiple comparisons test; data from two independent experiments, with a total of 3 Ctrl and 4 tdKO mice. * p < 0.05, ** p < 0.01, *** p < 0.001, **** p < 0.0001. Error bars indicate SEM.
Figure 2:
Figure 2:. Zfp148 and Zfp281 control expression of the CD4+-lineage transcriptome
(A) Schematic of developmental trajectories and cell clusters previously identified in Ctrl thymus (11). (B-E) Thymocytes (a mix of DN, CD69 DP and CD69+ cells) from Ctrl and tdKO mice were sorted as in Fig. S2A and analyzed by scRNAseq. Data integrates two biological replicates from each genotype. (B) UMAP analysis of the combined data set, displayed separately for each genotype, shows thymocytes color-coded according to their distribution into clusters (names on the right). Sig = signaled, Im = immature, Mat = mature, NC = non-conventional, ISC = interferon stimulated cluster. Each dot represents a single cell. Ctrl and tdKO ImCD4, and Ctrl MatCD4 and MatCD8 clusters are outlined. (C) Scaled expression of indicated genes is shown on UMAP plots of Ctrl thymocytes. (D) Volcano plot shows differential gene expression (Log2 fold-change [x-axis] vs. adjusted P-value, -Log10 scale [y-axis]) between Ctrl-ImCD4 and tdKO-ImCD4 cells. (E) Location of Cd8a+ MatCD4 cells on UMAP plots of Ctrl and tdKO thymocytes. Outlines indicate the location of Ctrl MatCD4 and MatCD8 clusters, as in (B).
Figure 3:
Figure 3:. Zfp148 and Zfp281 control CD4+-lineage specification independently of Thpok
(A) Violin plot shows cluster-based expression scores of CD4+ (top) or CD8+ (bottom) gene signatures (Data file S1) on clusters defined as in Fig. 2B. Dashed line indicates median, dotted lines indicate quartiles. (B) Violin plot shows expression of indicated genes in Ctrl or tdKO ImCD4 clusters. Each dot is a cell. Note that Gata3 mRNA expression scores minimally, albeit significantly, higher in tdKO than Ctrl cells (see also Fig. S3B). (C) Heatmap shows row-standardized average expression of genes differentially expressed between Ctrl and tdKO ImCD4 clusters (as defined in Fig. 2D and Data file S1). For each gene (row), the left two columns show expression in Ctrl and tdKO ImCD4 clusters (data from this study), and the right two columns show expression in WT and Thpok-deficient ImCD4 clusters [original data from Chopp et al., 2020, Ref. (11); GEO GSE157286]. Color scale at the bottom (units: standard deviation). (D) Stacked histograms (left) show intra-cellular Gata3 expression in TCRβ+ CD4+CD8int thymocytes from indicated genotypes. Dashed line (bottom) shows Gata3 staining in B6 CD8+ SP. Bar graphs (right) show Gata3 MFI expressed relative to B6 TCRβ+ CD4+CD8int thymocytes, set to 1 in each experiment. (E) Stacked histograms show intra-cellular expression of Runx3 (top) or Thpok (bottom) in indicated gated populations from AND TCR transgenic mice. Top histograms in each panel show expression of either protein in CD4+ SP (plain line) or CD8+ SP (dashed line) B6 thymocytes cells. Bar graphs (right) show MFI in indicated tdKO cells, expressed relative to B6 CD4+ SP (Thpok, bottom) or CD8+SP (Runx3, top) thymocytes analyzed in the same experiment and set to 1. (A-C) data is from two independent experiments each with one biological replicate of each genotype. (A-B) Significance calculated with a Wilcoxon Rank Sum test. (D) Data is from 15 (Ctrl), 6 (Zfp148 tKO), 7 (Zfp281 tKO) and 6 (tdKO) mice analyzed in 8 experiments. Significance calculated with a one-way ANOVA and Dunnett’s multiple comparisons test. (E) Data from two independent experiments, with a total of 3 Ctrl and 4 tdKO mice; significance calculated with a one-way ANOVA and Dunnett’s multiple comparisons test Error bars show SEM. *** p < 0.001, **** p < 0.0001.
Figure 4:
Figure 4:. in situ transcriptomics assessment of impaired CD4+-lineage differentiation.
(A-D) Thymi from Ctrl and tdKO mice were processed with the 10x Genomics FFPE Visium Spatial in situ transcriptomics technology. Data is from two independent biological replicates, one of which with two technical replicates (See also Data file S3). (A) Hematoxylin and eosin (H & E) staining of thymic sections show cortical (dark) and medullary (light) regions; scaled expression of indicated genes is shown on Ctrl (left) and tdKO (right) thymi. (B) Scaled expression of the CD8+- (left) and CD4+- (right) lineage gene expression signatures (left); violin plots (right) show signature scores in medullary spots. Dashed line indicates median, dotted lines indicate quartiles. (C-D) scaled expression of indicated genes is shown on Ctrl and tdKO thymic sections. (B-D) Significance calculated with a Wilcoxon Rank Sum test: **** p < 0.0001.
Figure 5:
Figure 5:. Zfp281 interacts and shares genomic binding sites with Gata3.
(A) Bar graphs (bottom) show ChIP-qPCR binding of Zfp281 (left) or Zfp148 (right) to genomic sites 1 and 2 (top graph) or an irrelevant intronic site of Spi1; data is expressed as percent of signal from input chromatin extract. Significance calculated with an unpaired two-tailed student’s t-test. Data for Zfp281 is from two independent experiments with three biological replicates. Data for Zfp148 is from one experiment with three biological replicates. (B) Immunoblot analysis of whole cell lysates (input lane) and of Gata3 (left) or Zfp281 (right) immunoprecipitates (IP lanes) prepared from HEK-293T cells transfected to co-express Zfp281 and Gata3. IgG indicates immunoprecipitation with a control IgG antibody. Protein blots were probed with antibodies as indicated; ns indicates a non-specific band in the Zfp281 blot. Position of molecular weight markers (kd) is shown on the side. Data from two independent experiments. (C) Immunoblot analysis of Gata3 immunoprecipitates (right) and lysates (input lanes, left) from HEK-293T cells transiently transfected to express Zfp281 or Gata3 as indicated. Protein blots were probed with indicated antibodies. Ethidium bromide (EtBr) was added where indicated to disrupt DNA-mediated protein interactions. Data is representative of three independent experiments.
Figure 6:
Figure 6:. Zfp148 and Zfp281 promote Th2 cytokine production.
(A, B) Contour plots (top) of Gata3 versus IL-4 expression in effector cells derived from naïve CD4+CD8 Ctrl or pdKO spleen T cells after 5-day culture in non-polarizing (ThN, A) or Th2 polarizing (B) conditions. Line graphs (bottom) show frequency of Gata3+ IL-4+ or of Gata3+ cells, and relative Gata3 MFI, expressed relative to B6 CD4+ T cells cultured in parallel in the same conditions. (C-H) in vivo papain response experiments. (C) Schematic timeline of papain treatment. (D) Contour plots (left) show ST2 expression on gated CD4+ T cells from the lungs of Ctrl and pdKO papain-challenged mice. Bar graph (right) shows the frequency of ST2+ cells among total CD4+ lung lymphocytes. (E-H) Contour plots show intra-cellular expression of indicated proteins on CD44hi CD4+ lymphocytes from lung (E-F, H) or draining lymph nodes (G) after 4 hours of restimulation with PMA and ionomycin. Bar graphs show cell frequencies. (A,B) Data is from five independent experiments, each with at least one Ctrl and one pdKO, for a total of 6 mice for each genotype. Significance calculated with a paired t-test. (D-H) pdKO data is gated on Rosa26YFP+ cells, Ctrl are Zfp281fl/fl Zfp148fl/fl Cre-negative mice; data is from two independent experiments, with a total of 6 (Ctrl) and 7 (pdKO) mice; significance calculated with a two-tailed student’s t-test. * p < 0.05, ** p < 0.01, *** p < 0.001, **** p < 0.0001.
Figure 7:
Figure 7:. Zfp148 and Zfp281 control accessibility at and expression of Il4.
(A-G) Joint RNAseq and ATACseq (“multiomics”) was performed on dLN CD44hi CD4+ T cells from Ctrl and pdKO mice treated with papain as in Fig. 6C. Results from two independent experiments were integrated and analyzed as indicated. (A) UMAP plot of the integrated mRNA expression data, displayed separately for each genotype. Each dot is a cell color-coded according to unsupervised clustering (key at bottom). Clusters R1 (Th2) and R3 (Tfh) are outlined. (B) Scaled expression of indicated genes is shown on UMAP plot from Ctrl cells. (C, D) UMAP display of the integrated scATACseq data, shown separately for each genotype and color-coded according to cell distribution into scRNAseq- (C) or scATACseq- (D) defined clusters. Outlines indicate areas containing cells from Ctrl RNA clusters R1 and R3. (E) Violin plots of Il4 expression in Ctrl and pdKO cells from clusters R1 and R3. Significance calculated with a Wilcoxon Sum Rank test; **** p < 0.0001. (F) Volcano plot shows differential gene expression (Log2 fold-change, x-axis, vs. adjusted P-value, -Log10 scale, y-axis) between Ctrl and pdKO cells from both clusters R1 and R3. (G-J) Data is displayed on genome browser tracks at the Th2 cytokine locus (chromosomal coordinates at bottom). (G) Chromatin accessibility (scATACseq data) in dLN cells from papain-treated mice. Data is shown on cells from clusters A2 (Ctrl only), and A3, A5, and A6, separated by genotype for A3. (H) ChIP-seq for Zfp281 from in vitro activated wild-type Th2 cells. (I) ChIP-seq for Gata3 from in vitro activated Th2 cells from Ctrl or tdKO mice. Note that sites identified in these experiments are similar to those previously observed in Refs. (65, 80). (J) H3K27Ac ChIP-seq from in vitro activated Th2 cells [data from (65)] (A-G, data from two independent experiments (biological replicates), each with 3 or 4 pooled mice of each genotype. (H) Data representative of two independent experiments; CGRE binding validated in independent ChIP-qPCR experiment. (I) Data from one experiment.

References

    1. Vacchio MS, Bosselut R, What Happens in the Thymus Does Not Stay in the Thymus: How T Cells Recycle the CD4+-CD8+ Lineage Commitment Transcriptional Circuitry To Control Their Function. Journal of immunology (Baltimore, Md. : 1950) 196, 4848–4856 (2016). - PMC - PubMed
    1. Taniuchi I, CD4 Helper and CD8 Cytotoxic T Cell Differentiation. Annual review of immunology 36, 579–601 (2018). - PubMed
    1. Zhu J, T Helper Cell Differentiation, Heterogeneity, and Plasticity. Cold Spring Harbor perspectives in biology 10, (2018). - PMC - PubMed
    1. Zhu J, Min B, Hu-Li J, Watson CJ, Grinberg A, Wang Q, Killeen N, Urban JF Jr., Guo L, Paul WE, Conditional deletion of Gata3 shows its essential function in T(H)1-T(H)2 responses. Nat Immunol 5, 1157–1165 (2004). - PubMed
    1. Zhu J, T helper 2 (Th2) cell differentiation, type 2 innate lymphoid cell (ILC2) development and regulation of interleukin-4 (IL-4) and IL-13 production. Cytokine 75, 14–24 (2015). - PMC - PubMed

Publication types

MeSH terms