. 2023 Nov 10;8(89):eabn8531.
doi: 10.1126/sciimmunol.abn8531. Epub 2023 Nov 10.

Transcriptomes and metabolism define mouse and human MAIT cell populations

Affiliations

Transcriptomes and metabolism define mouse and human MAIT cell populations

Shilpi Chandra et al. Sci Immunol. .

Erratum in

Abstract

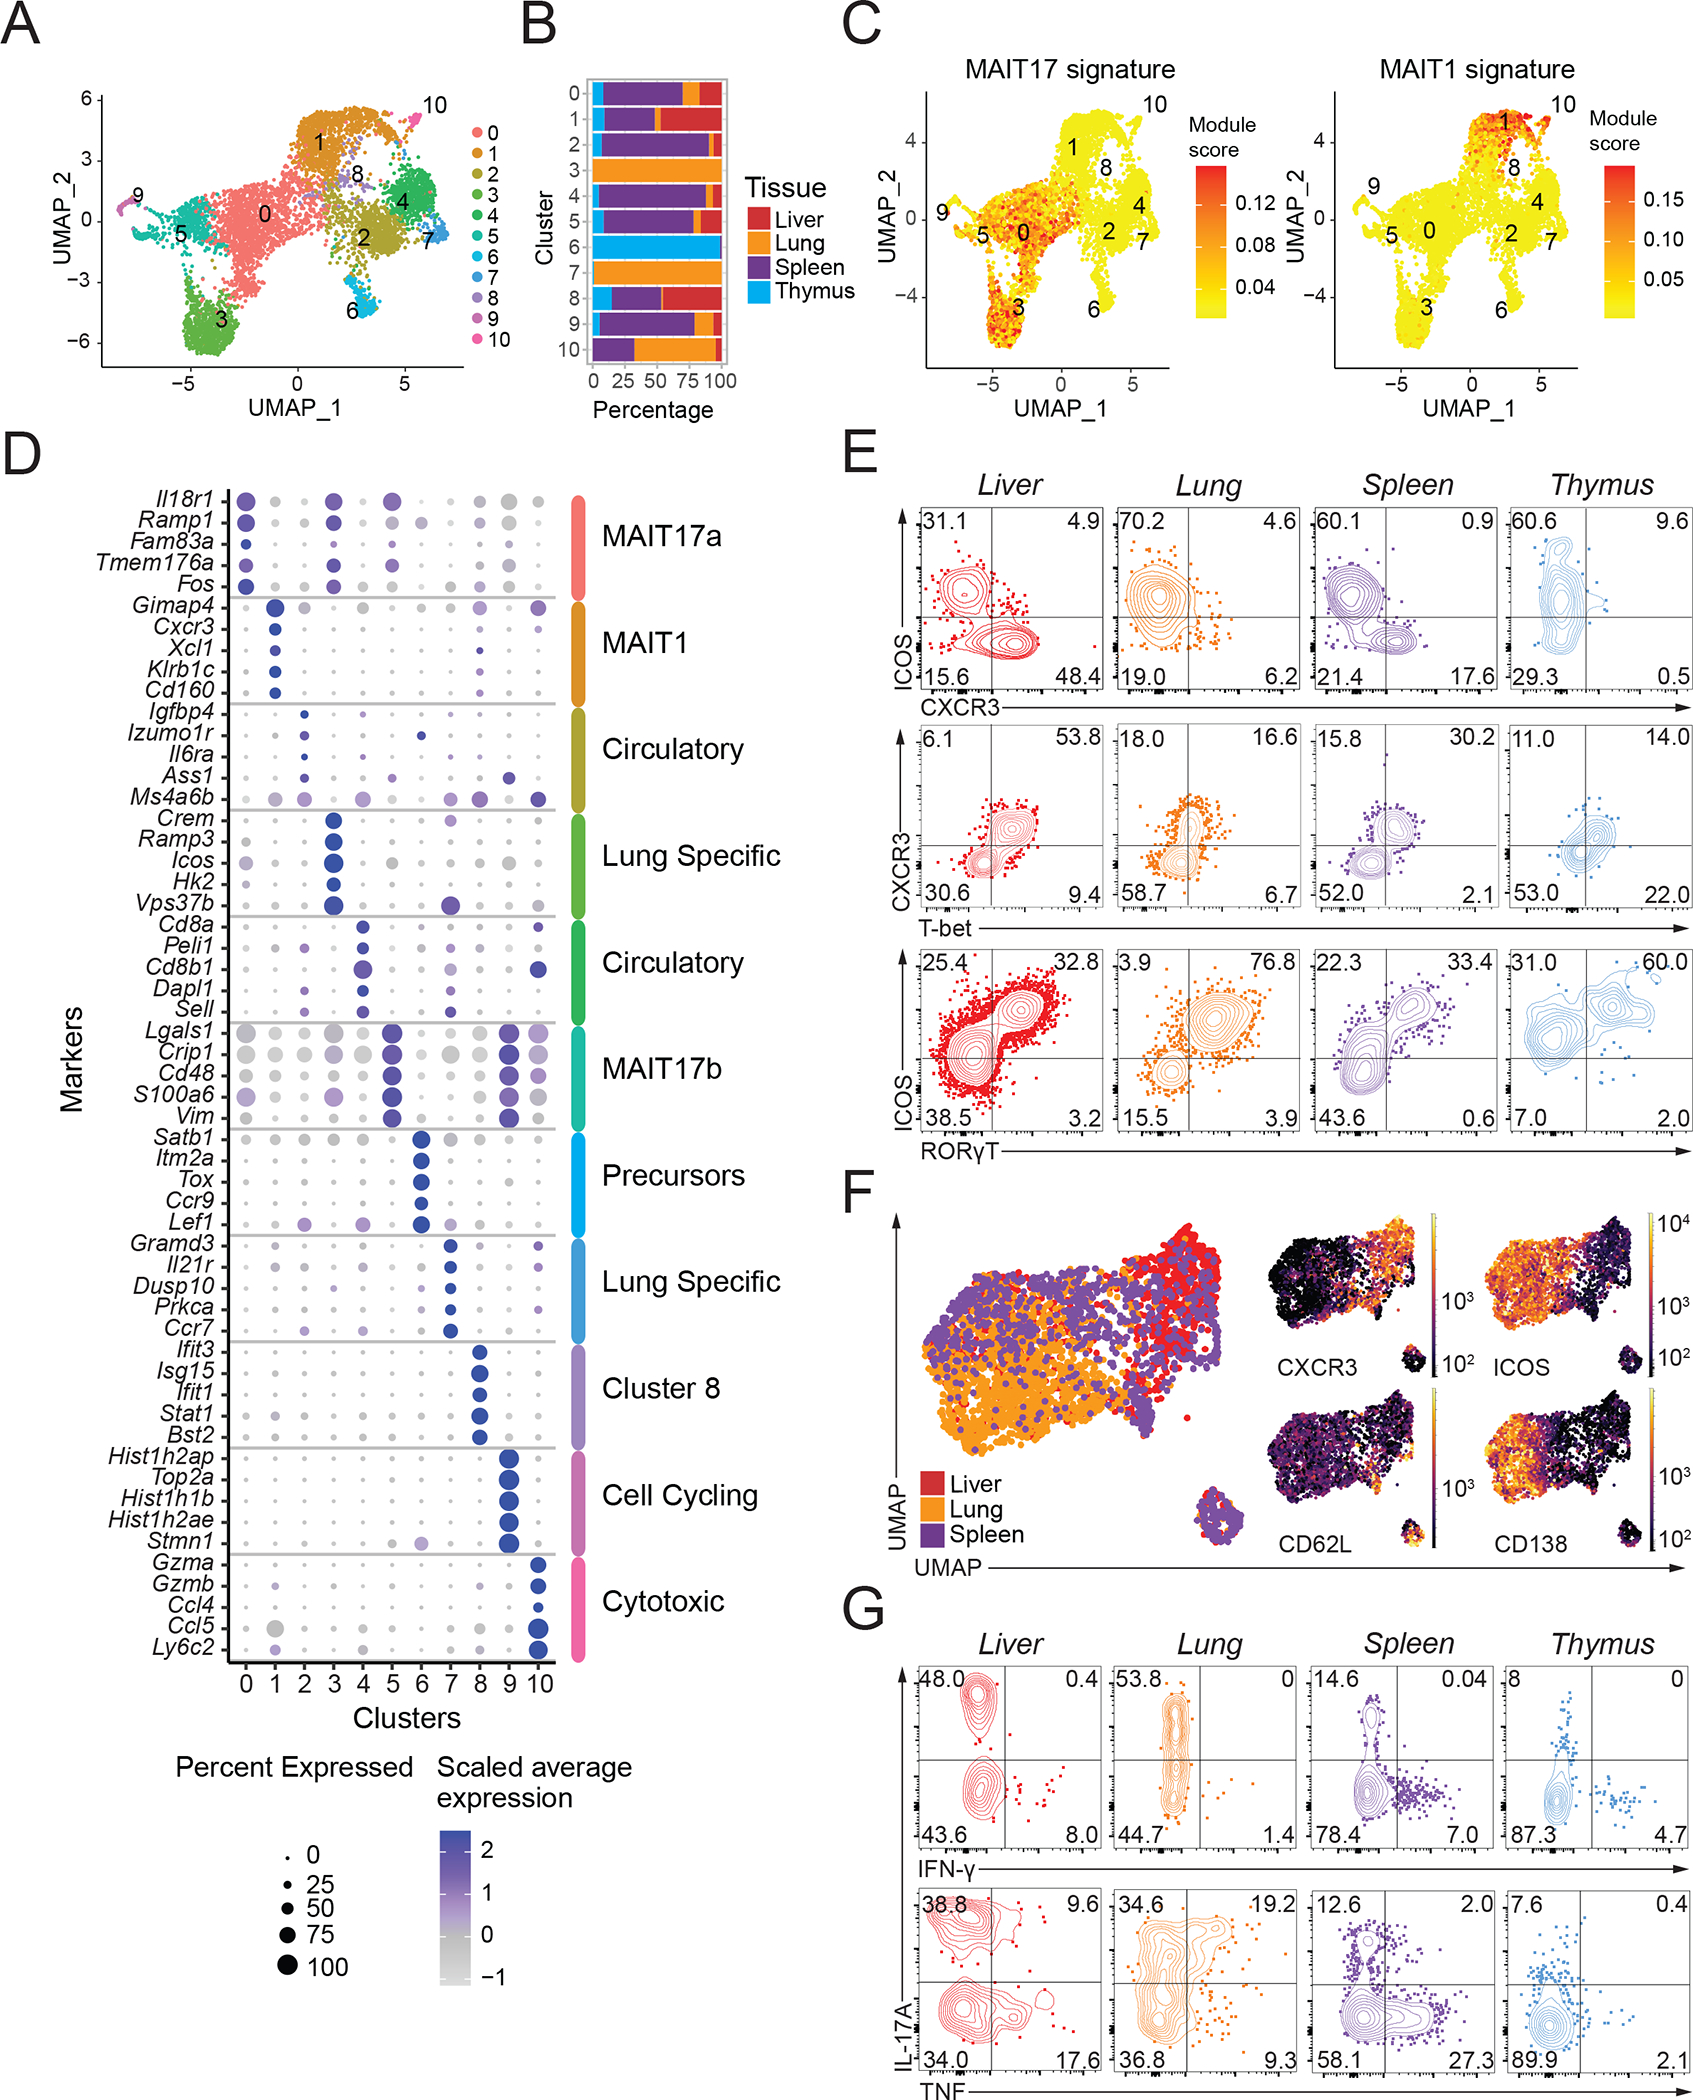
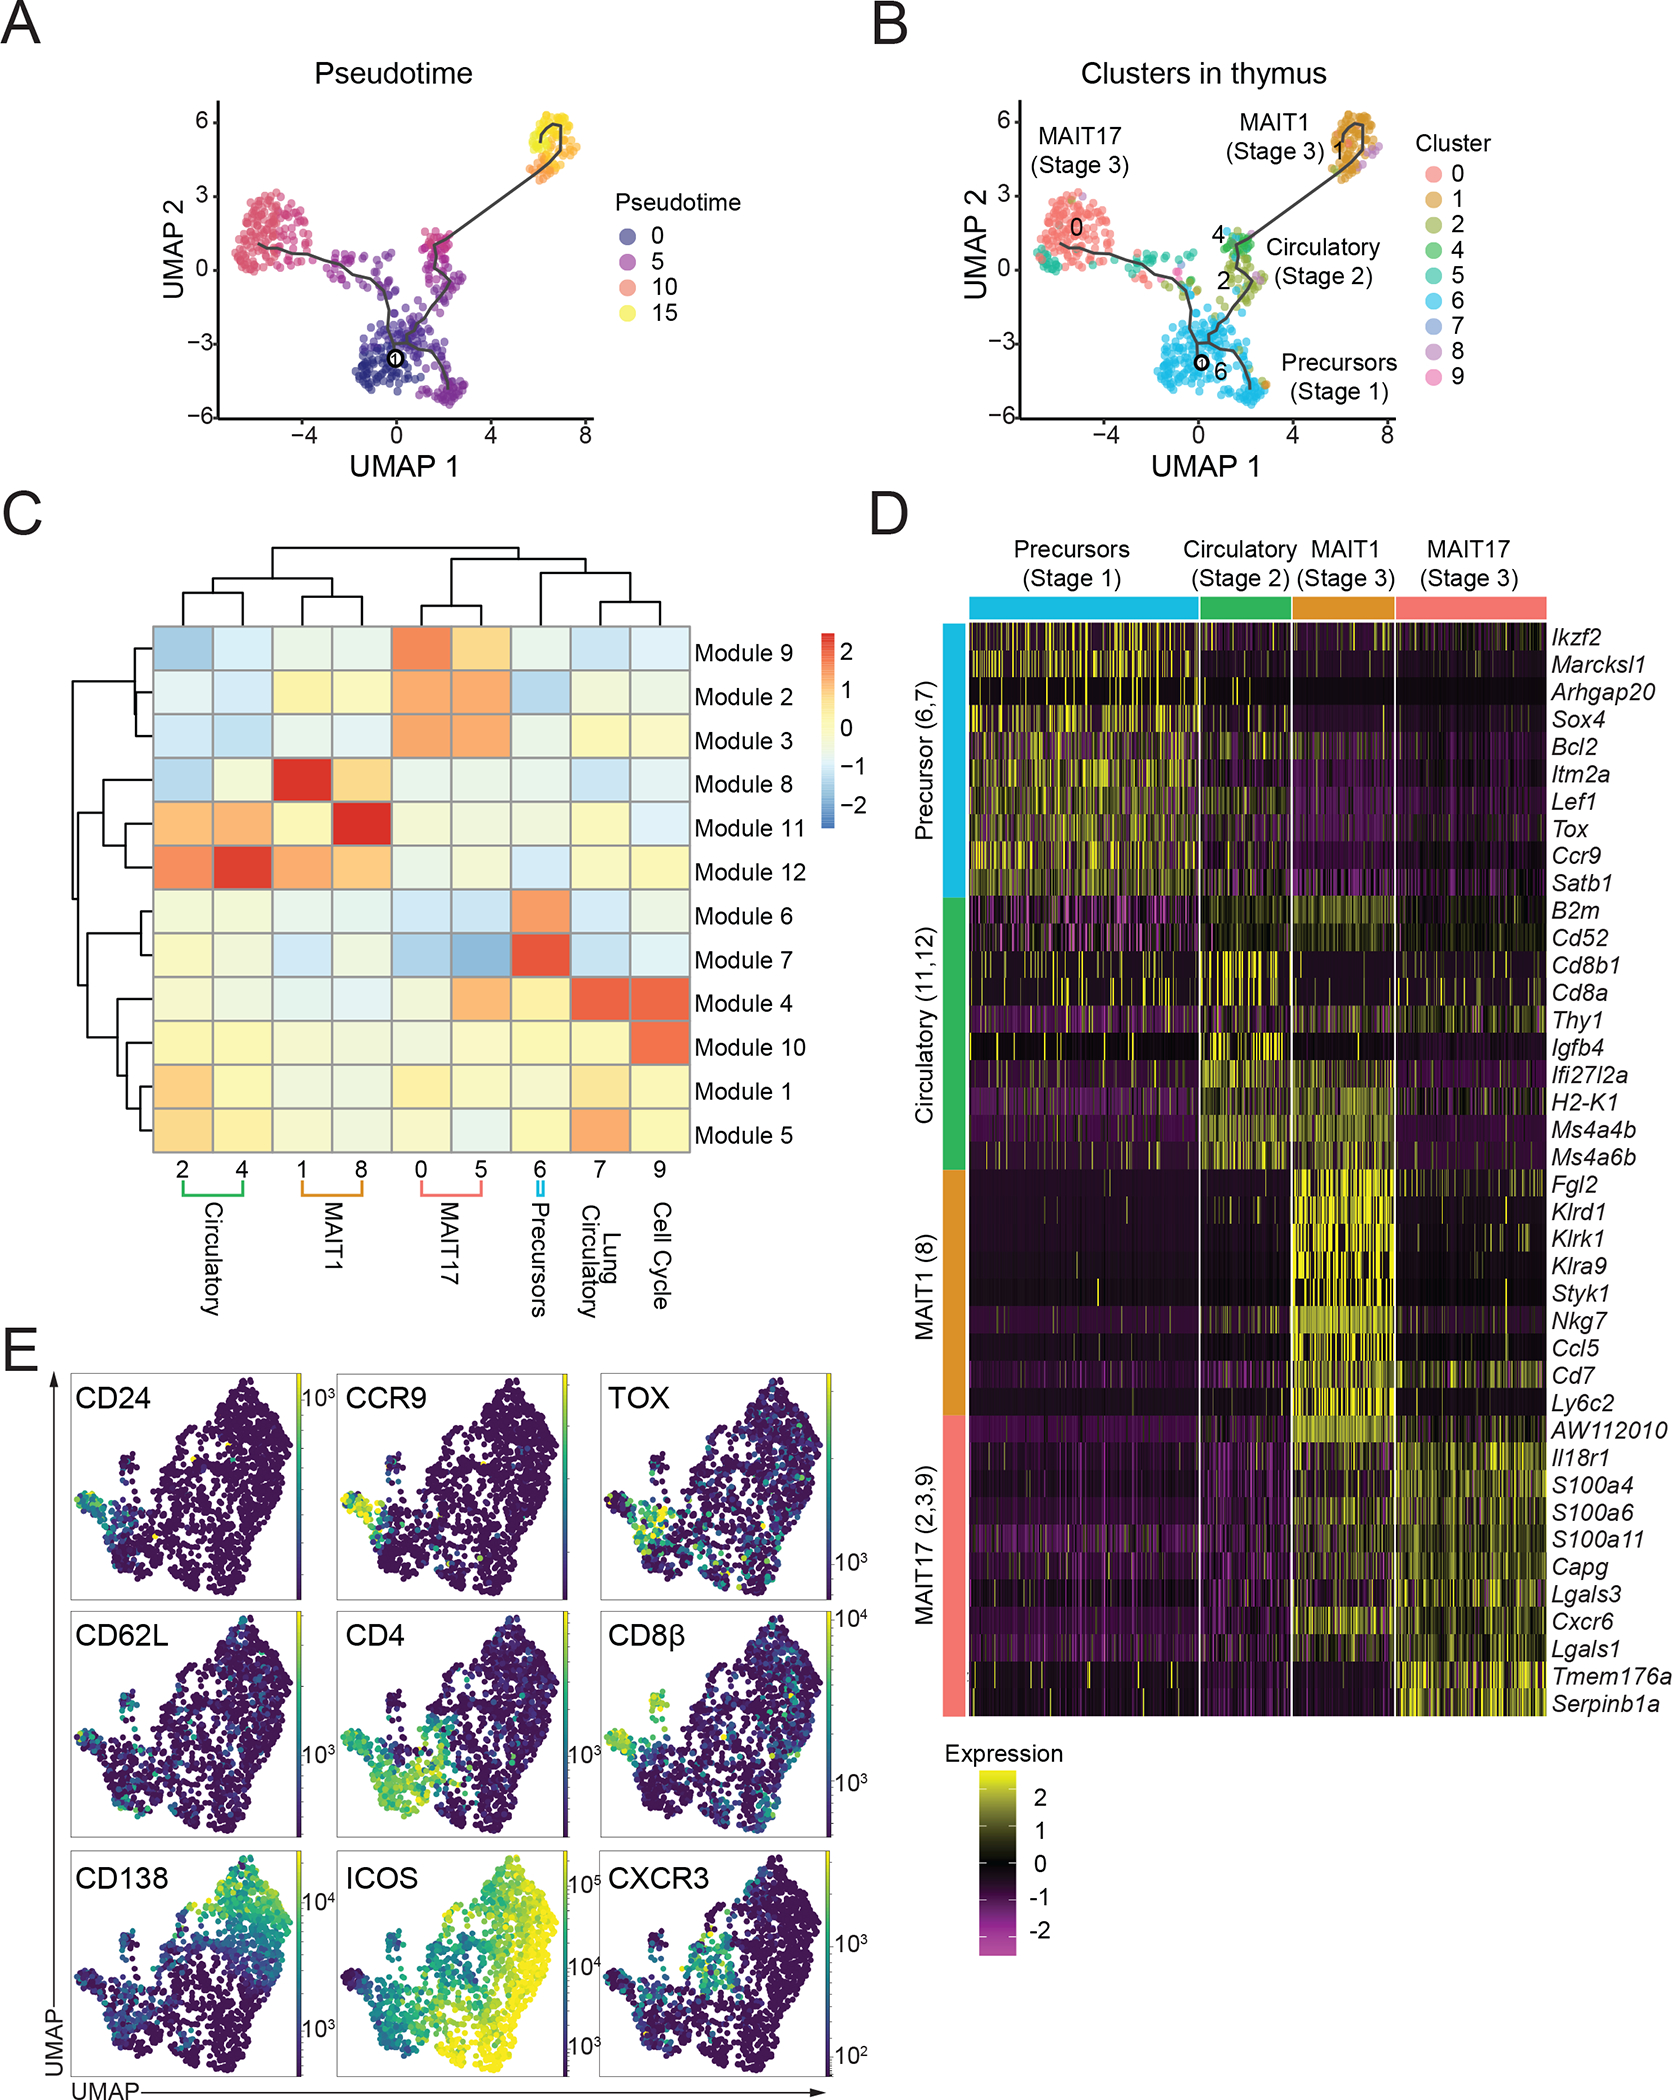
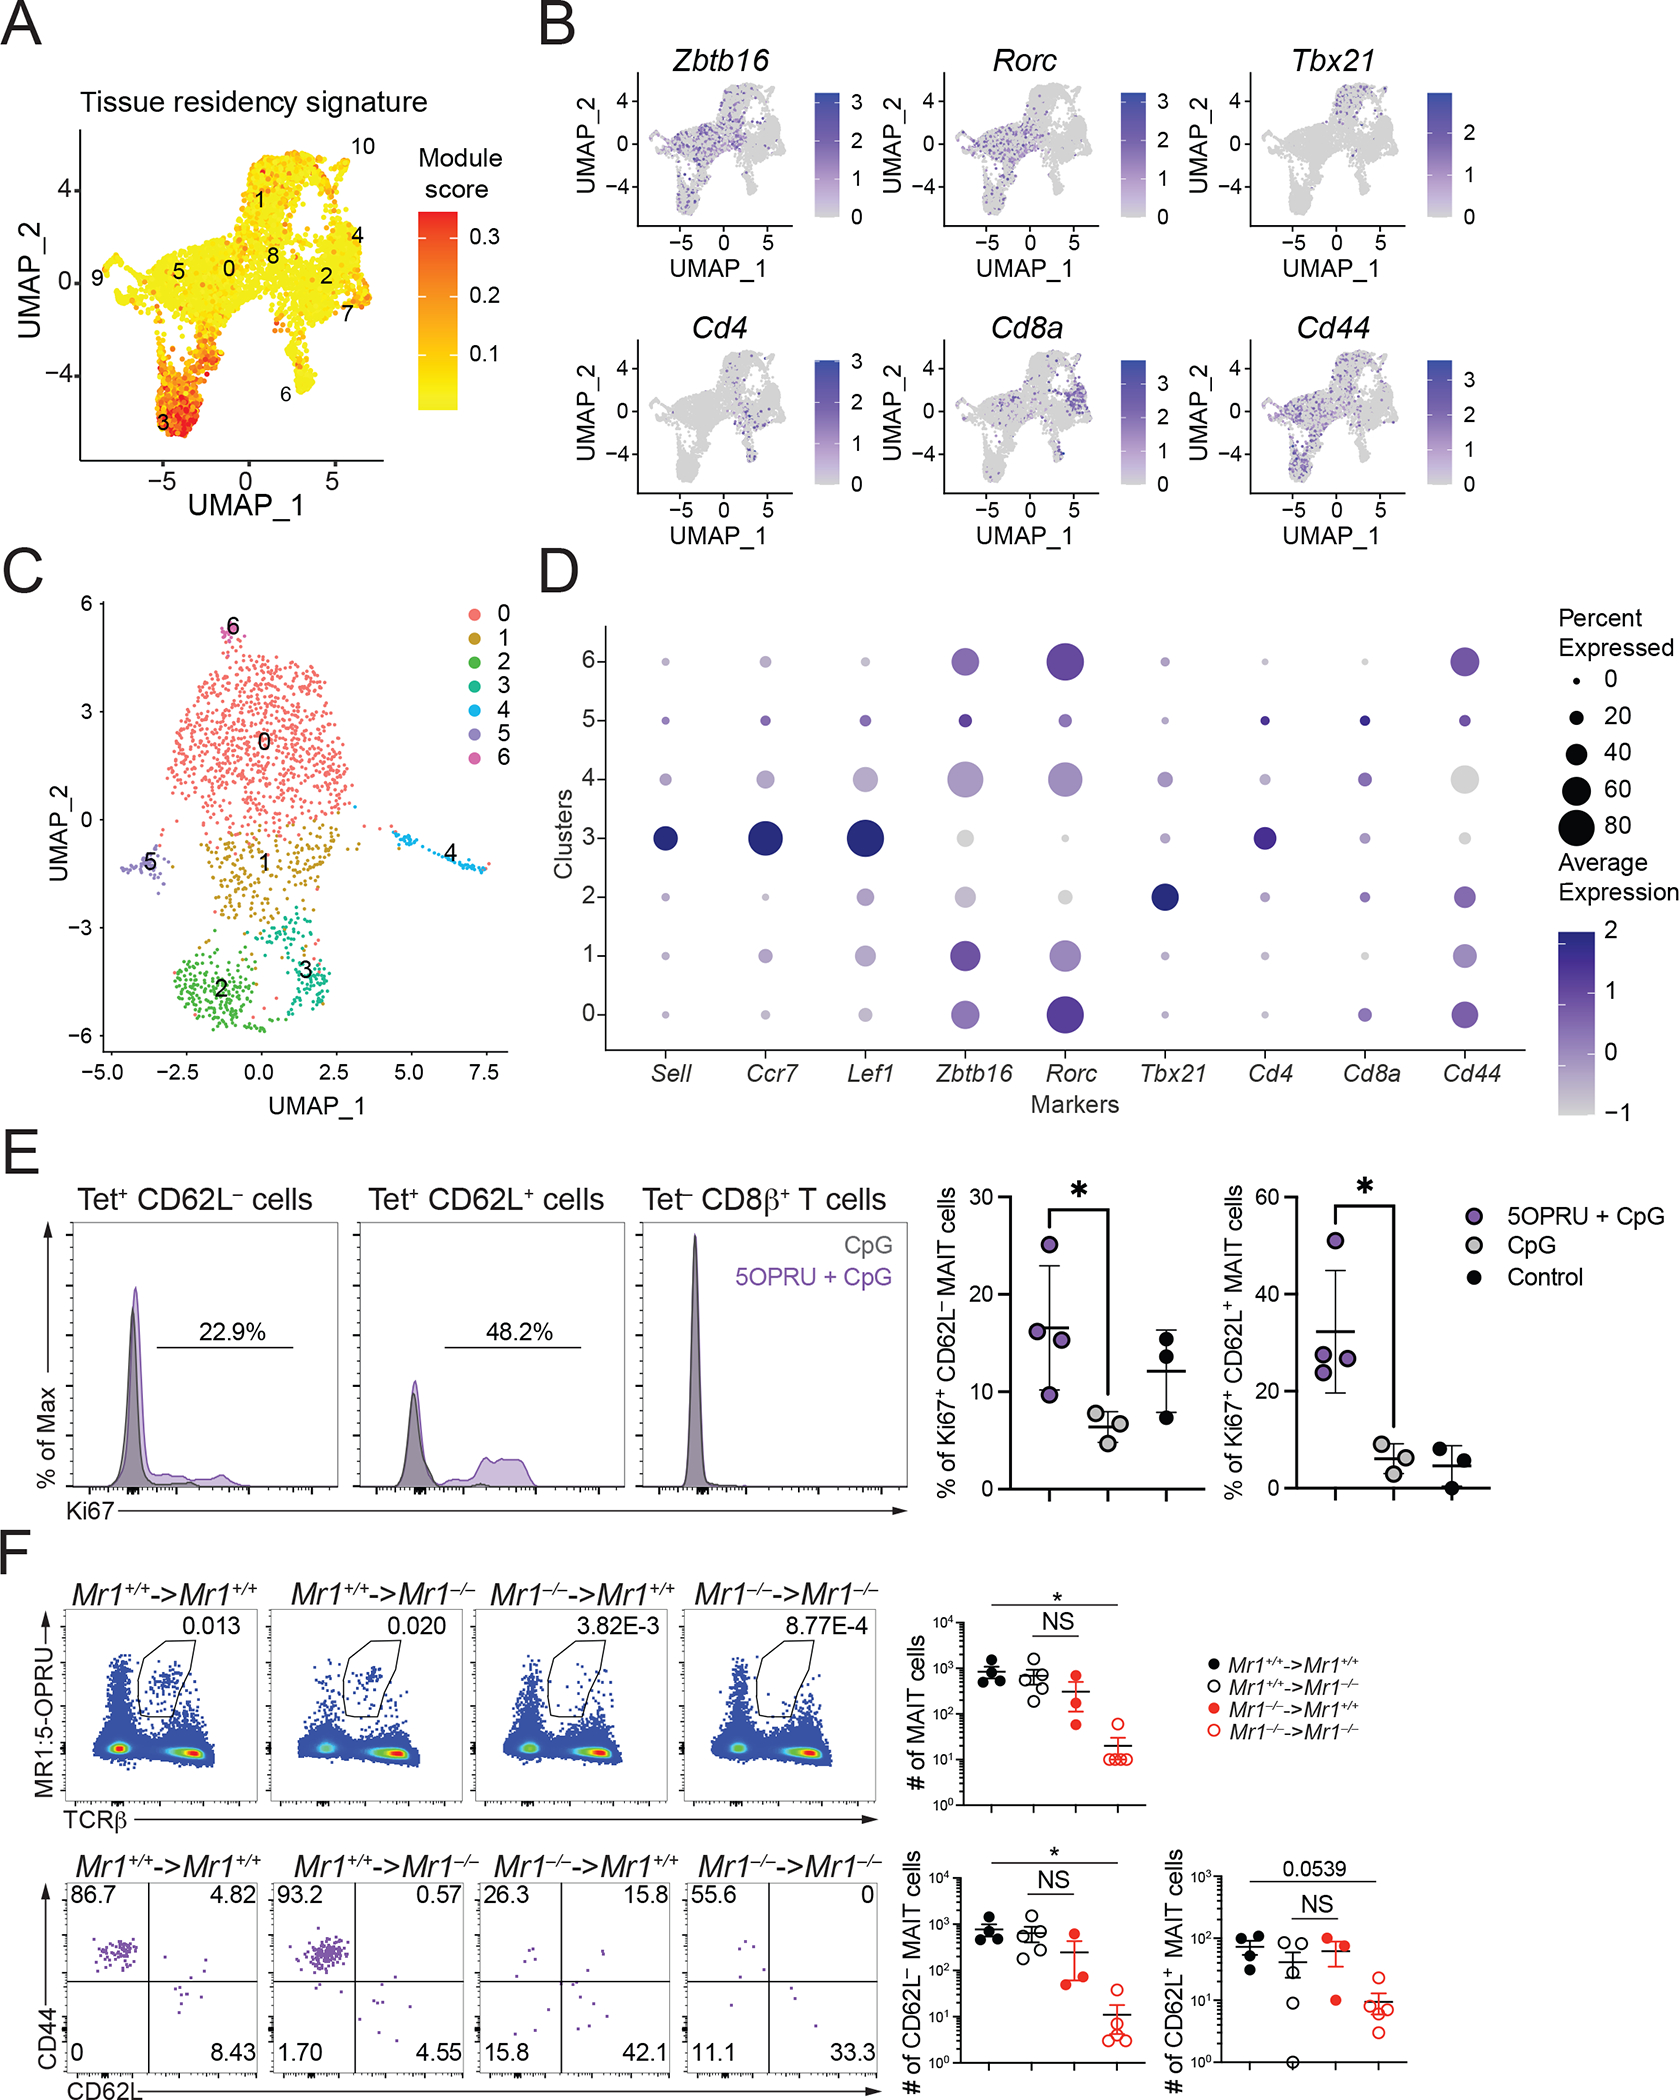
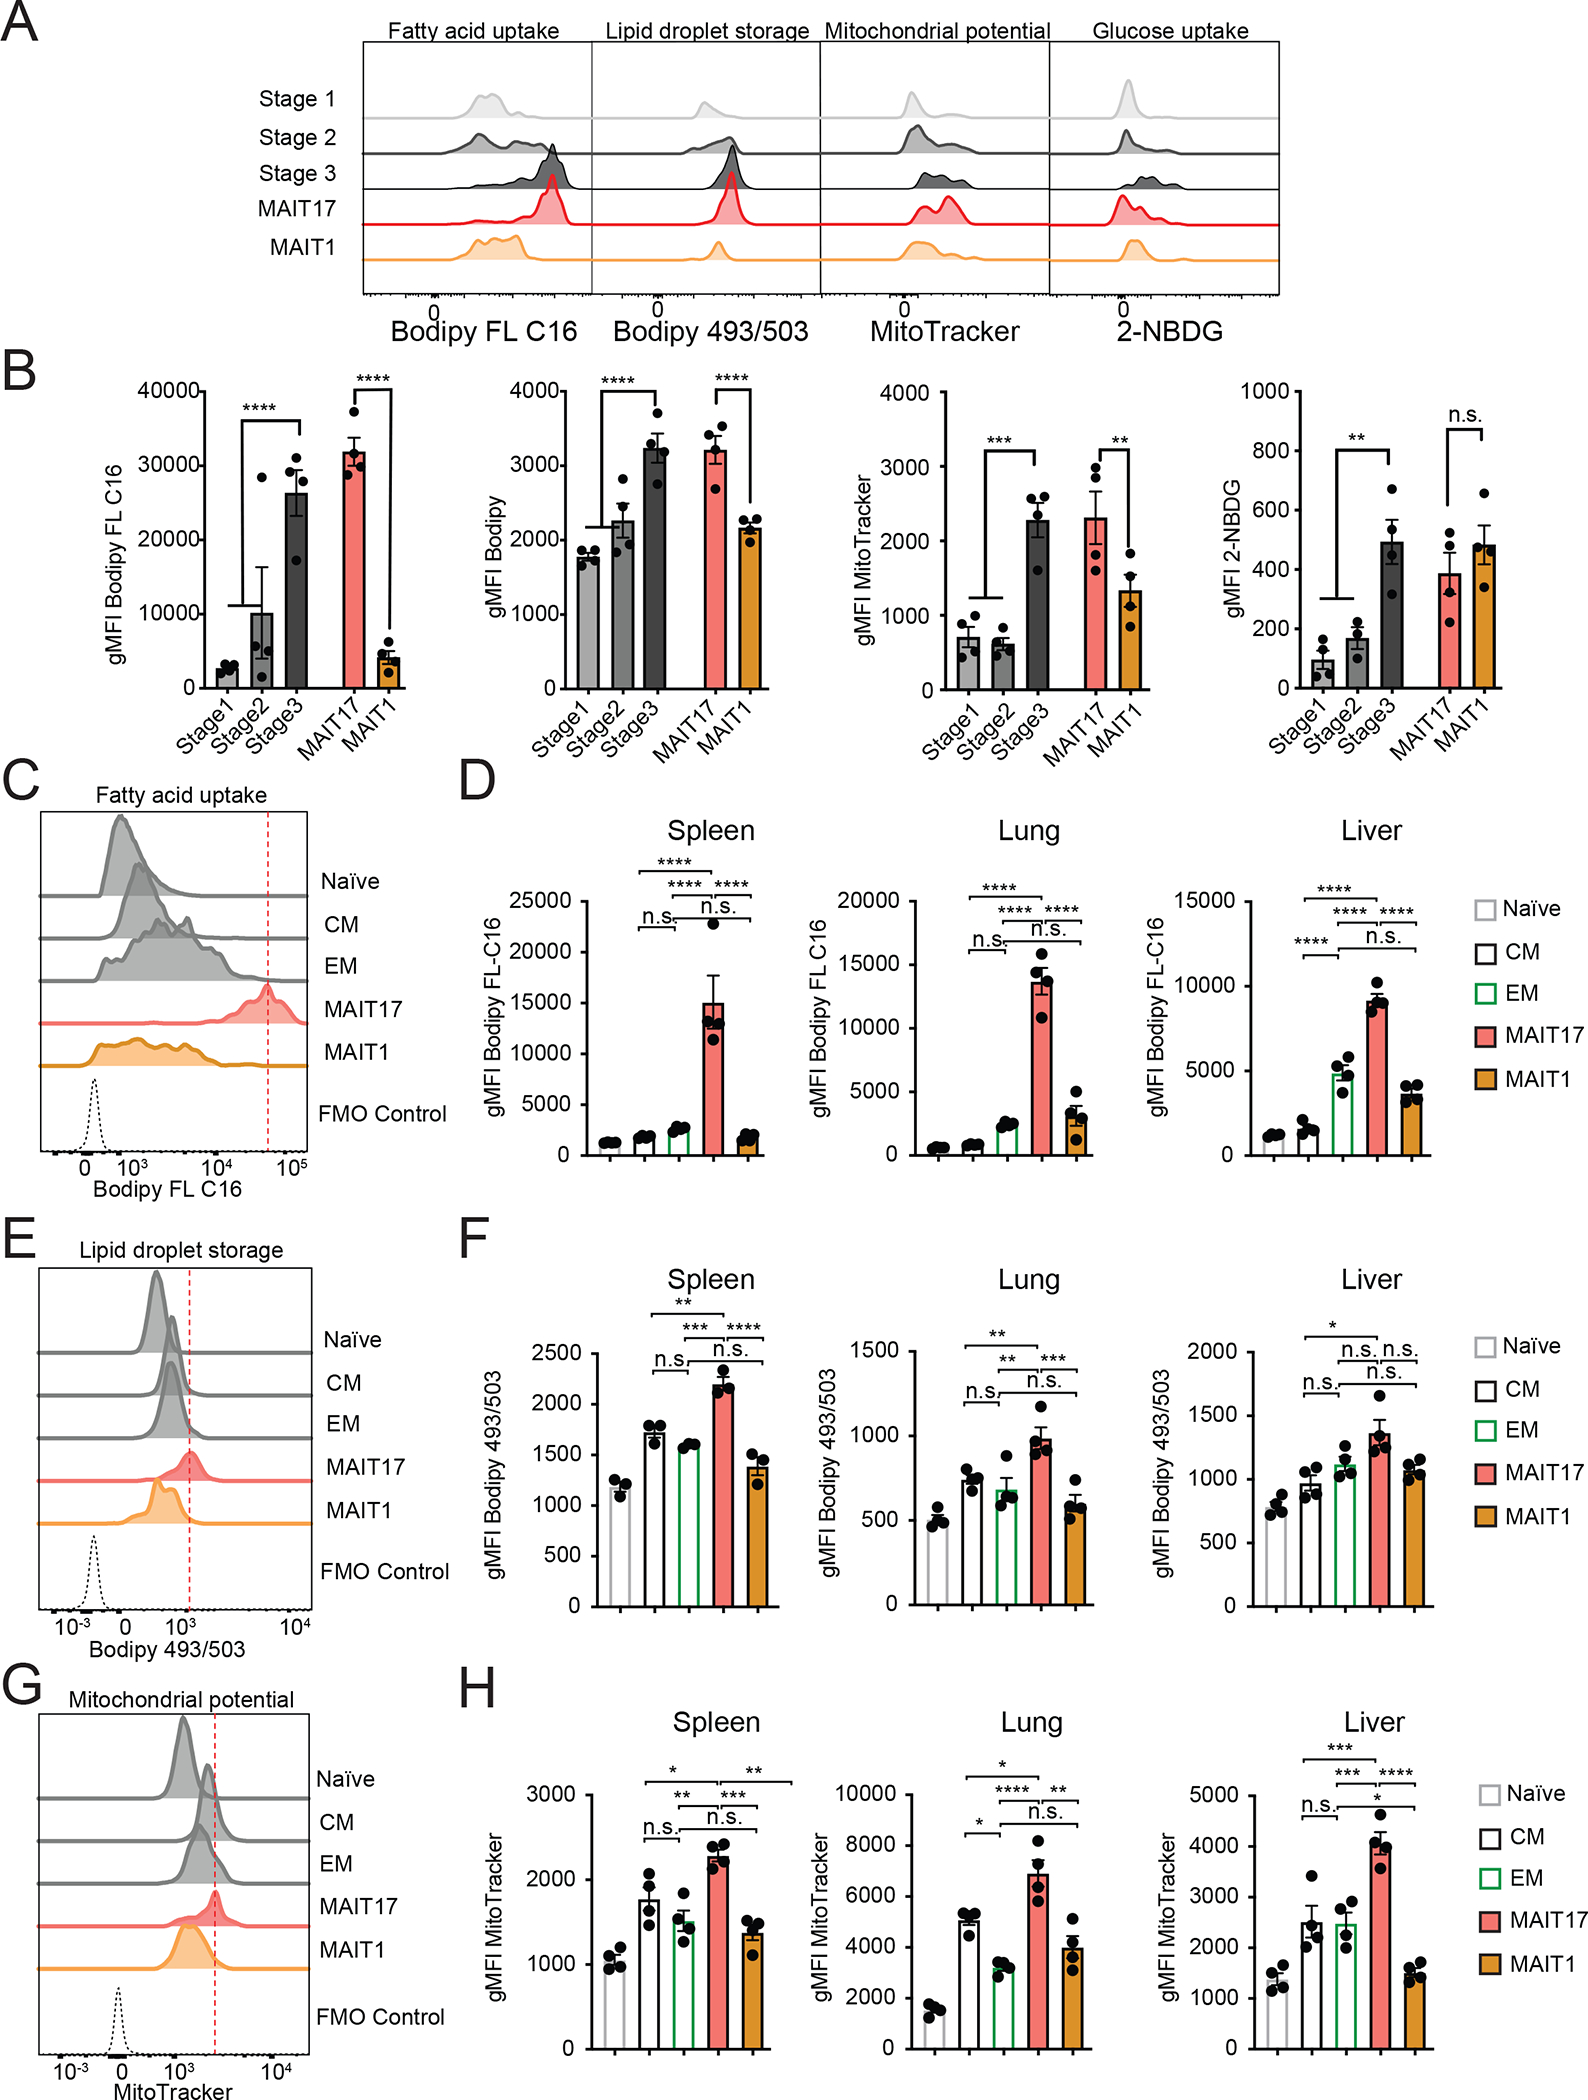
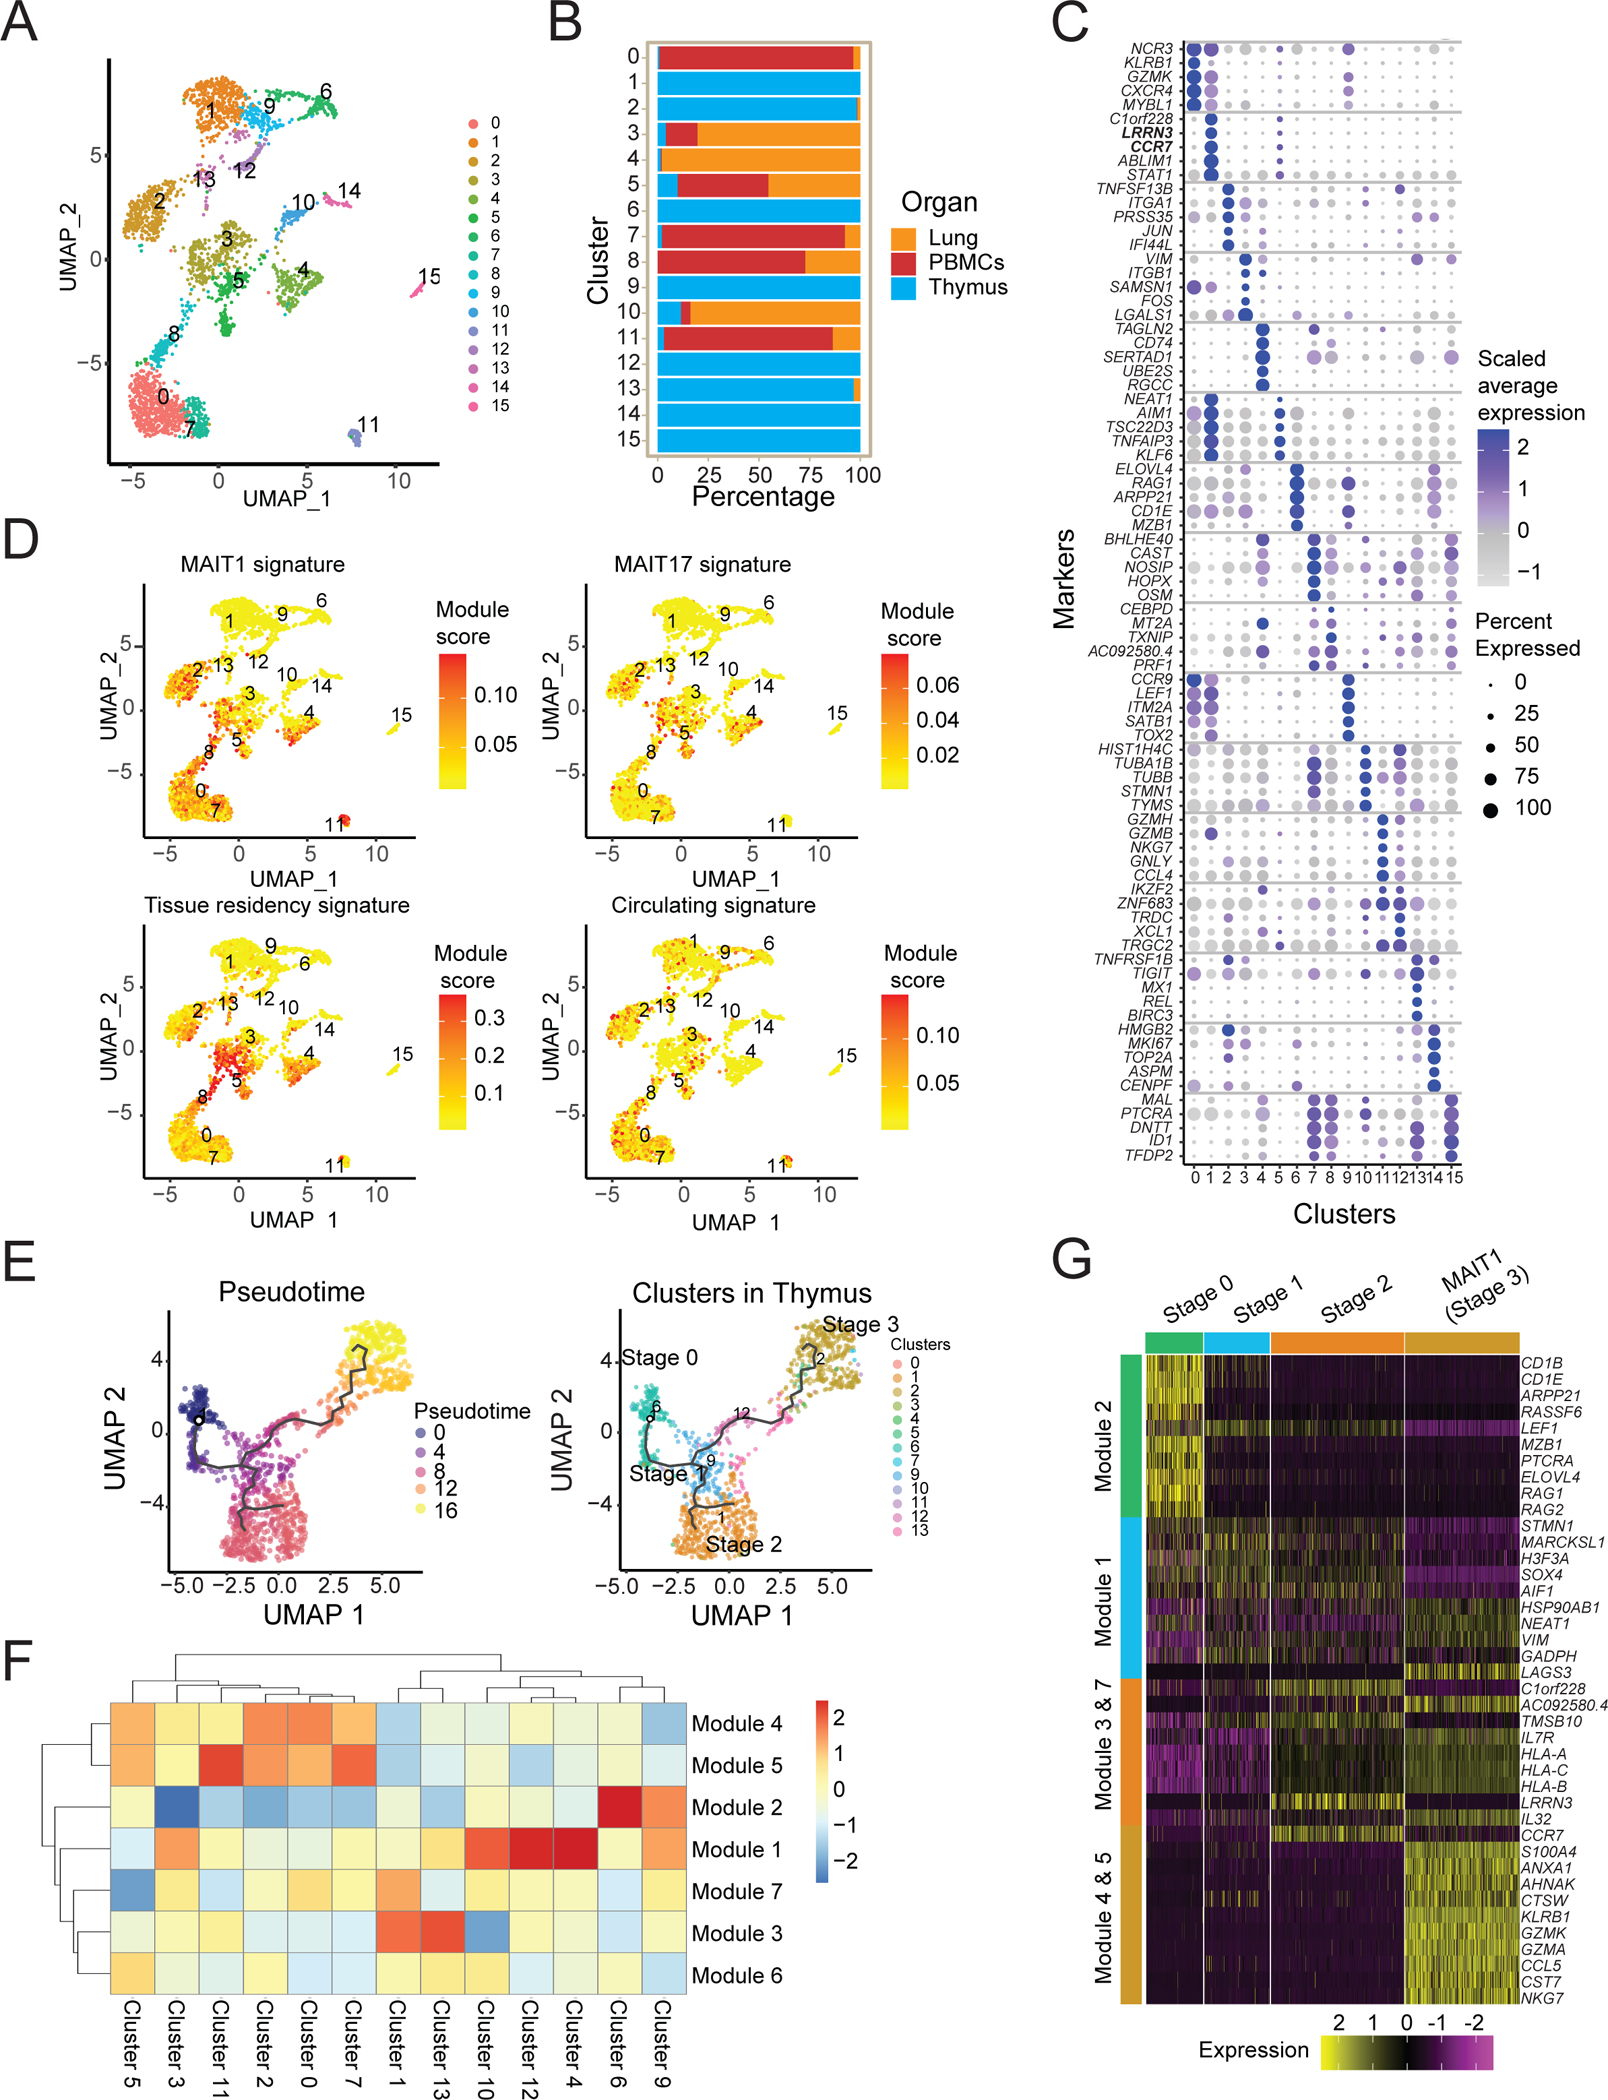
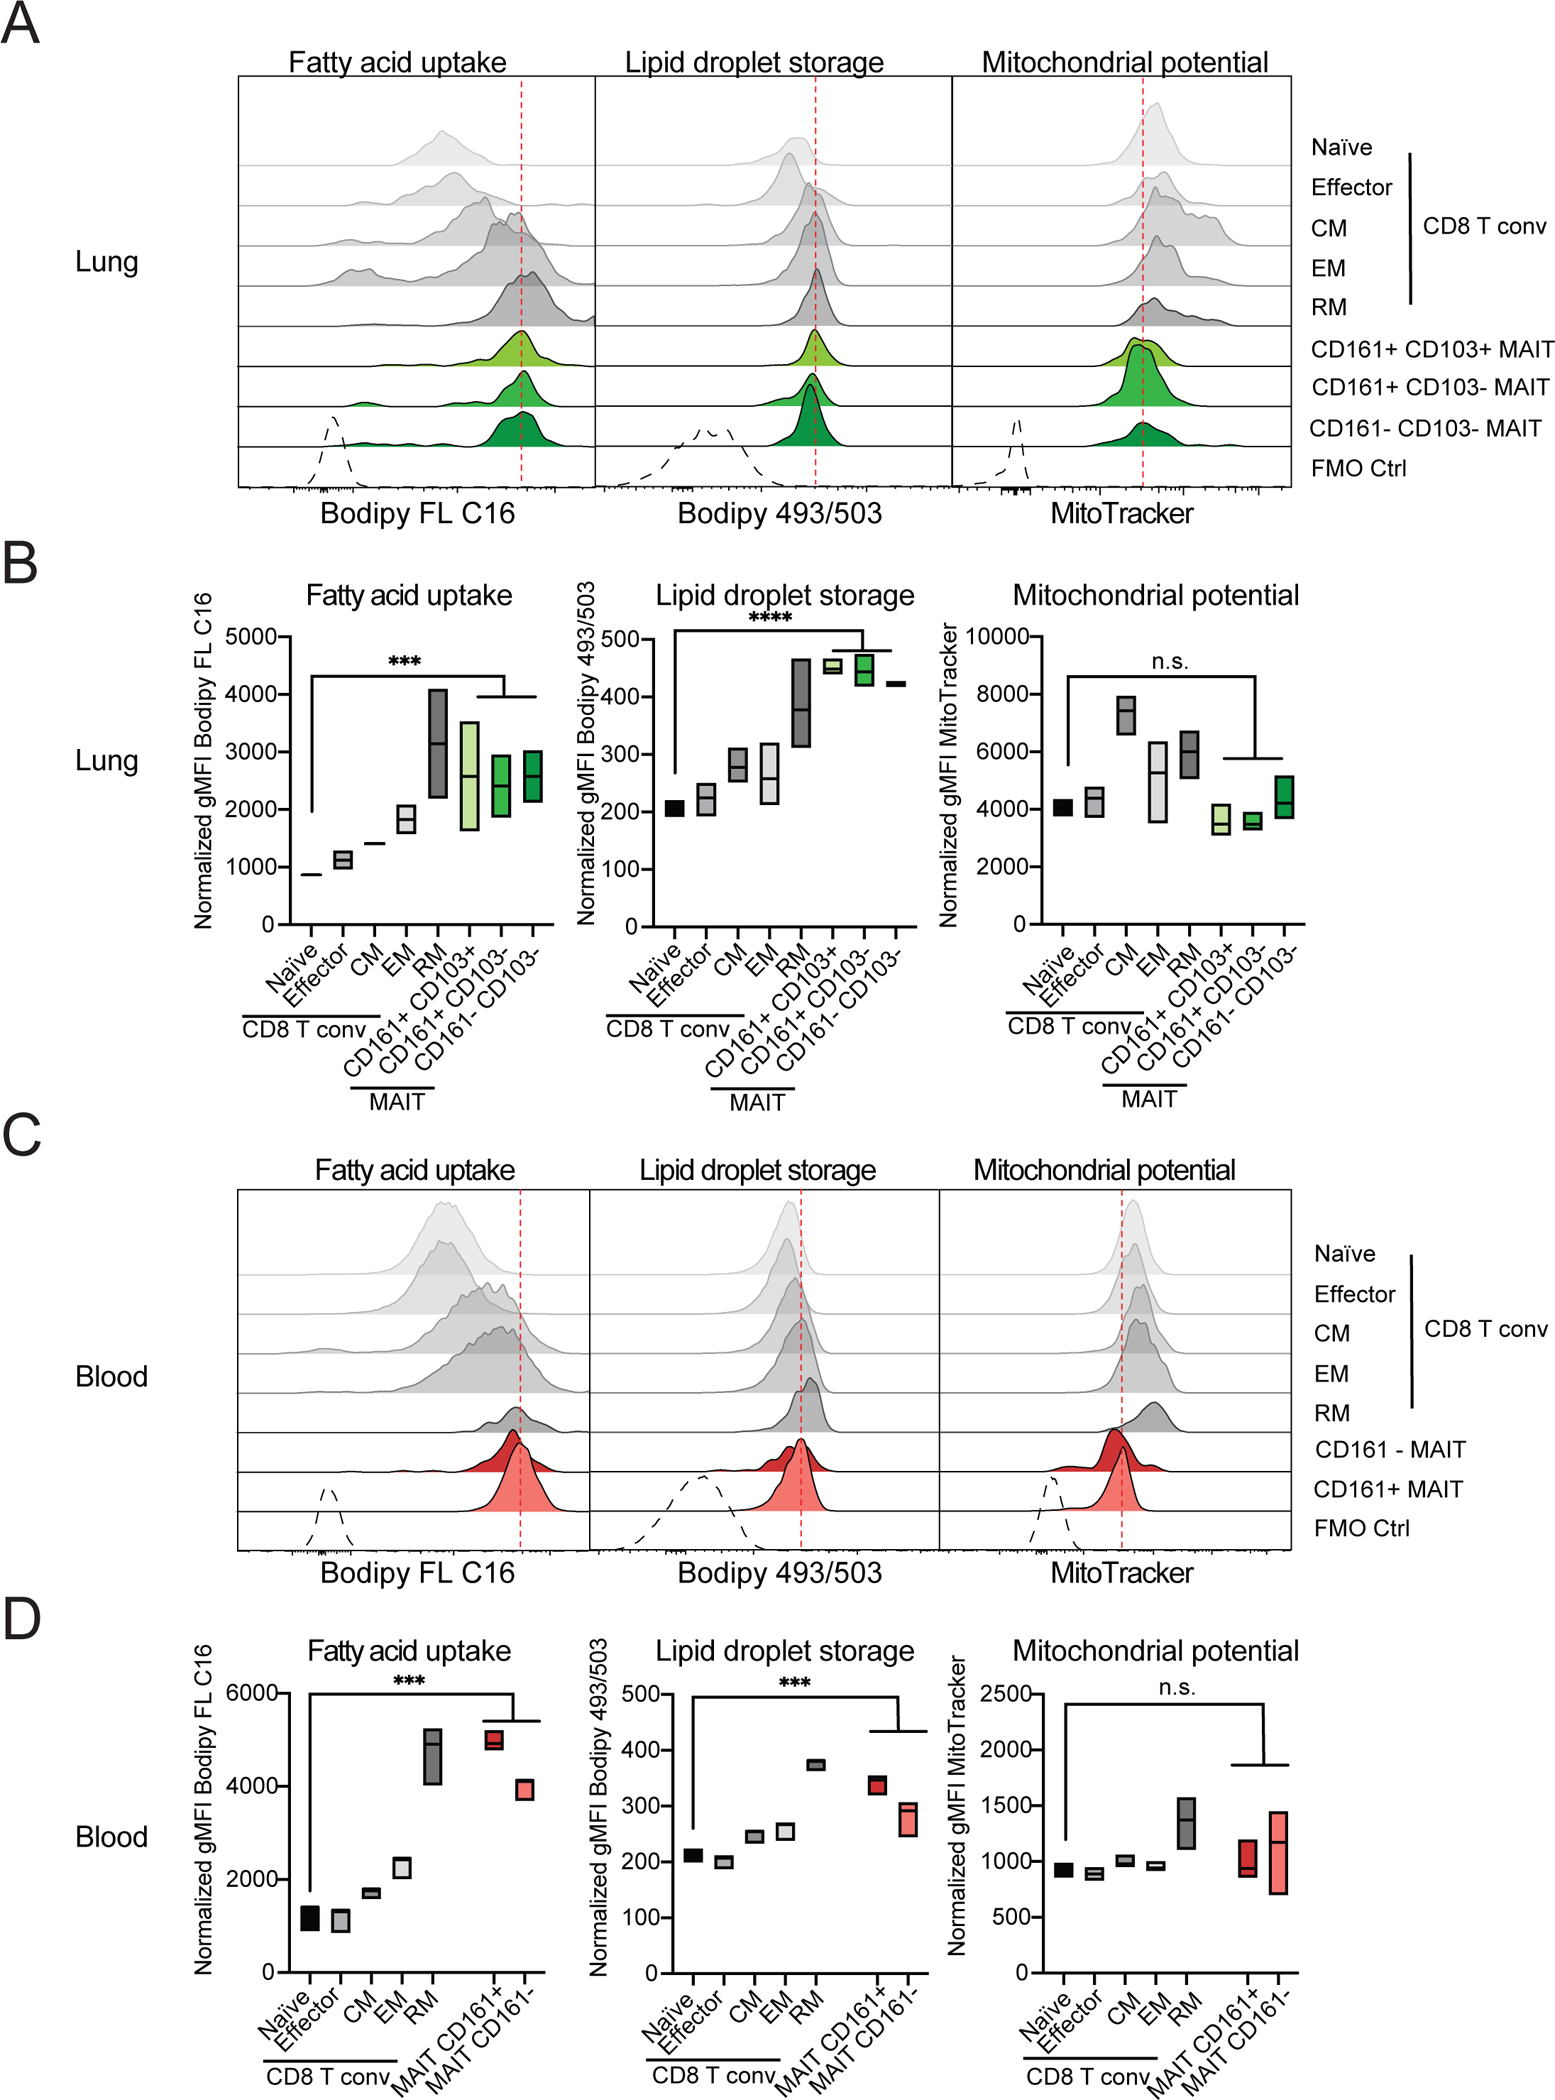
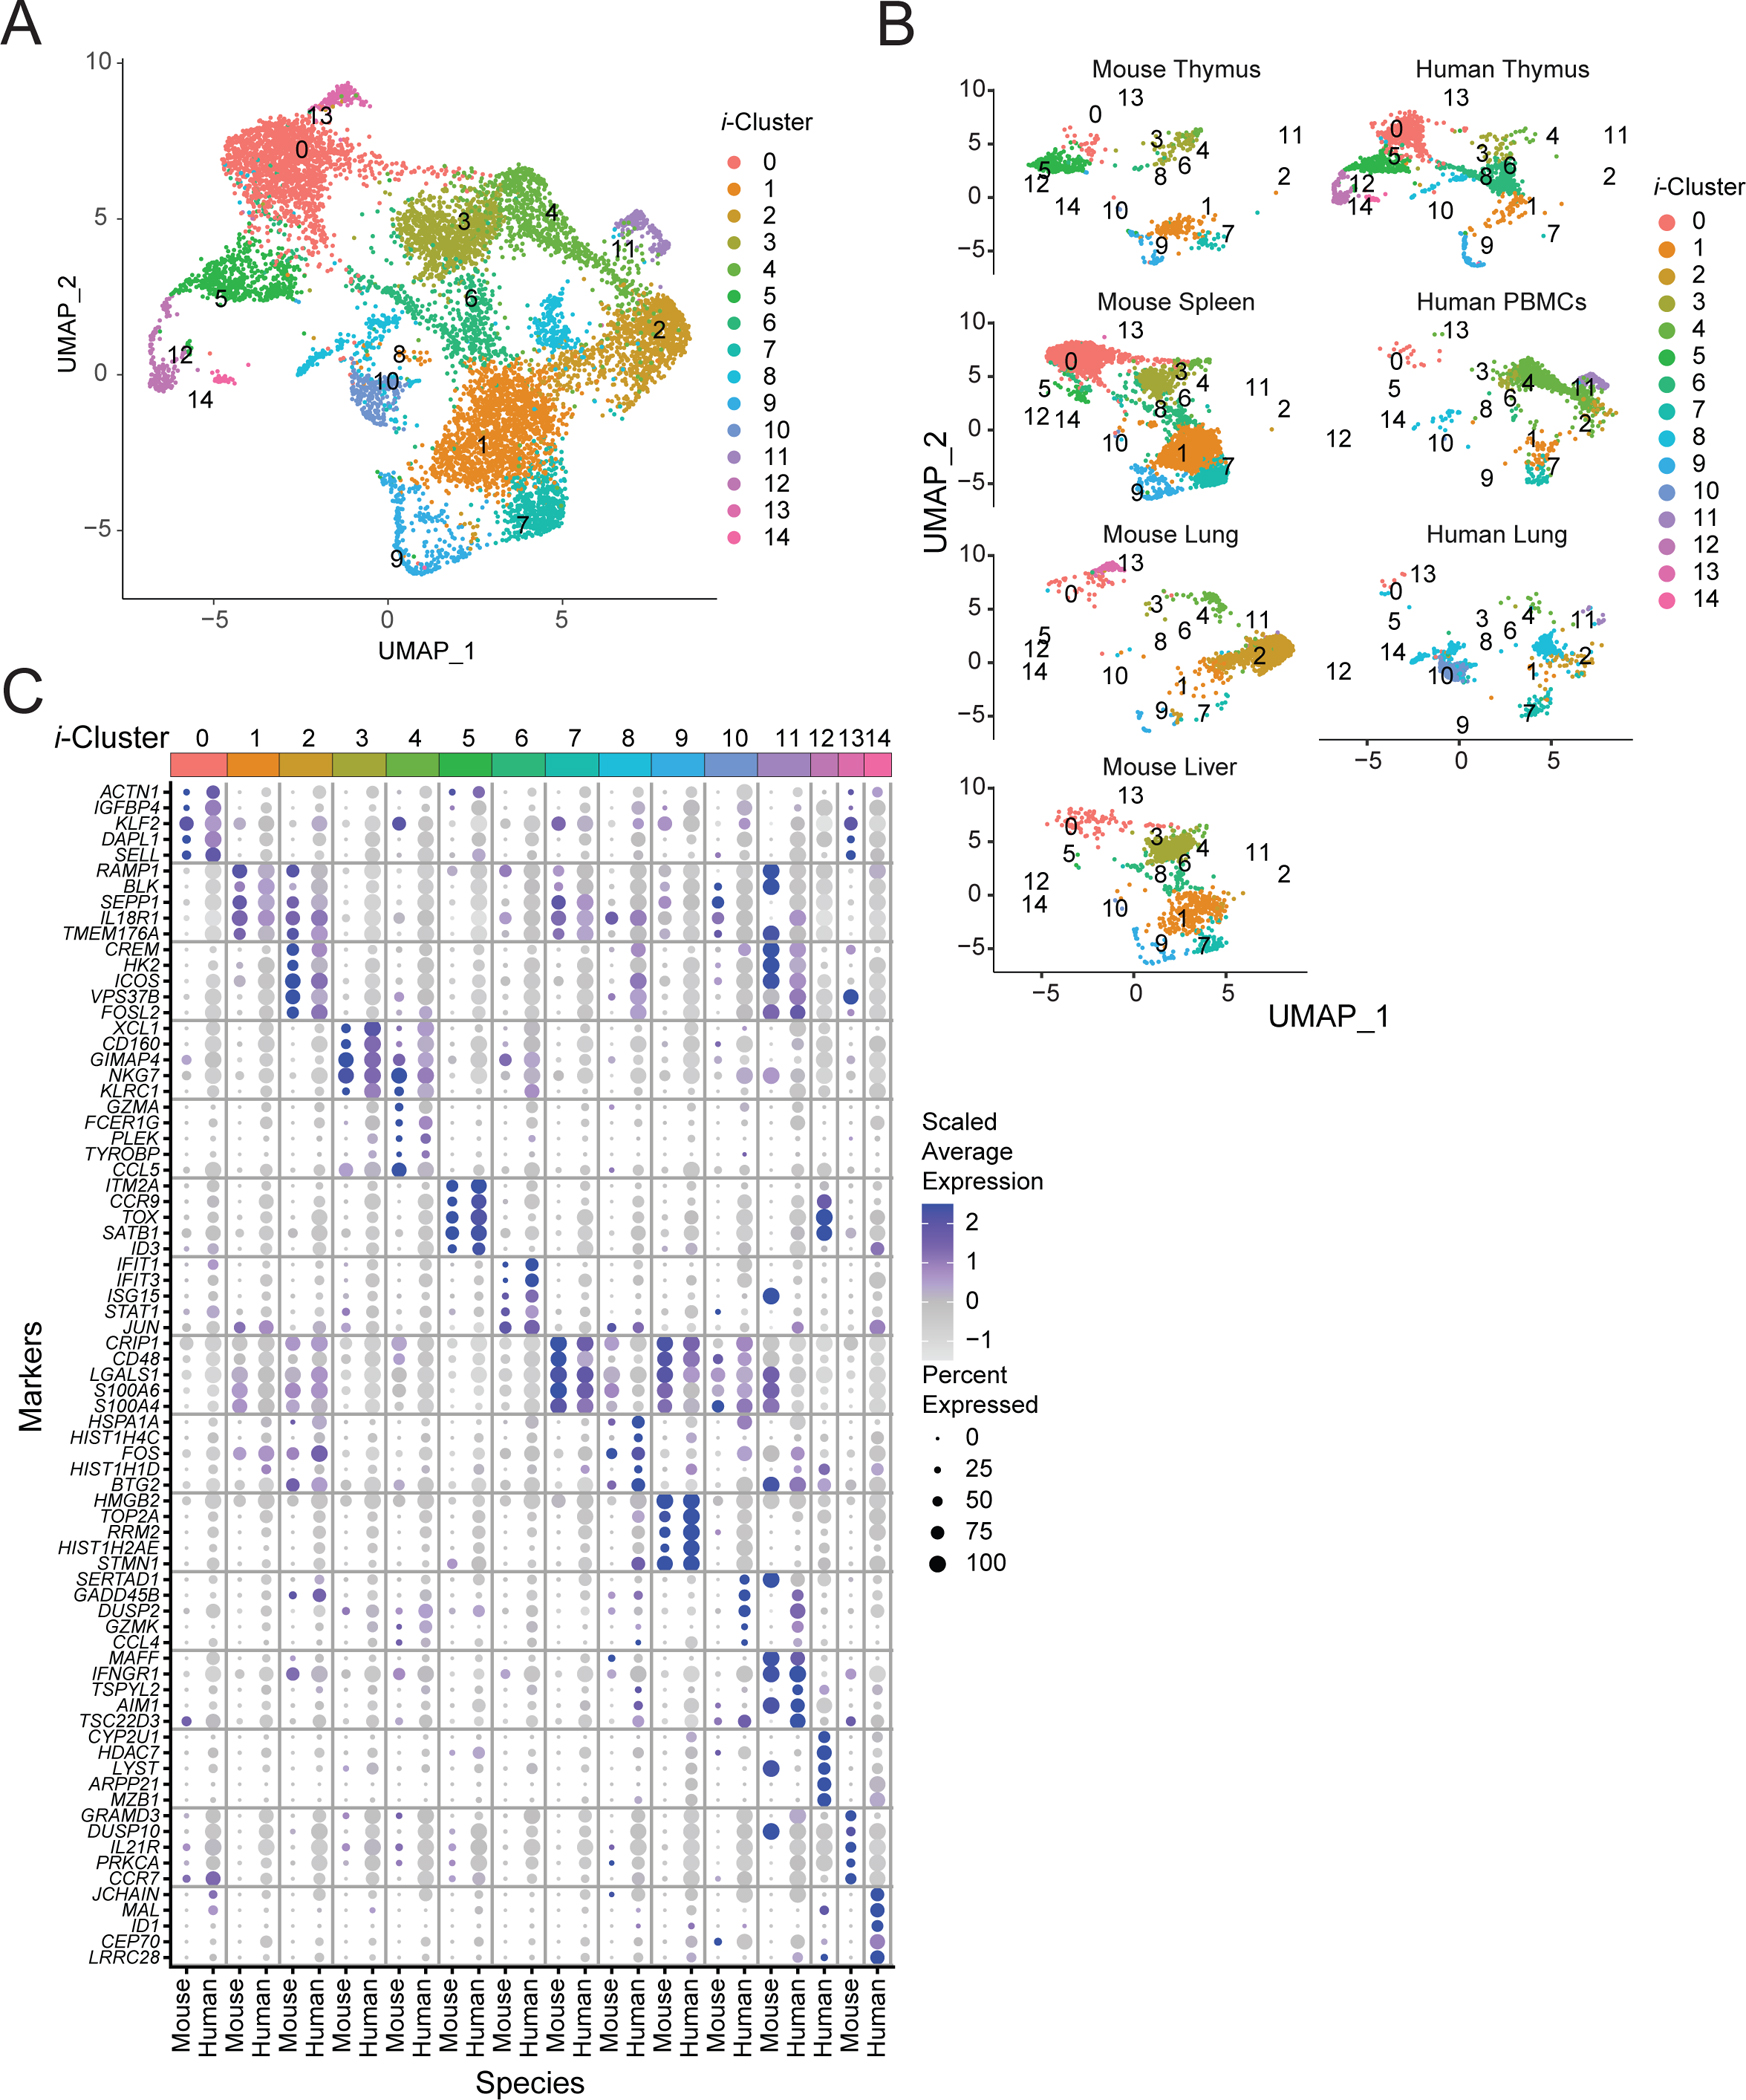
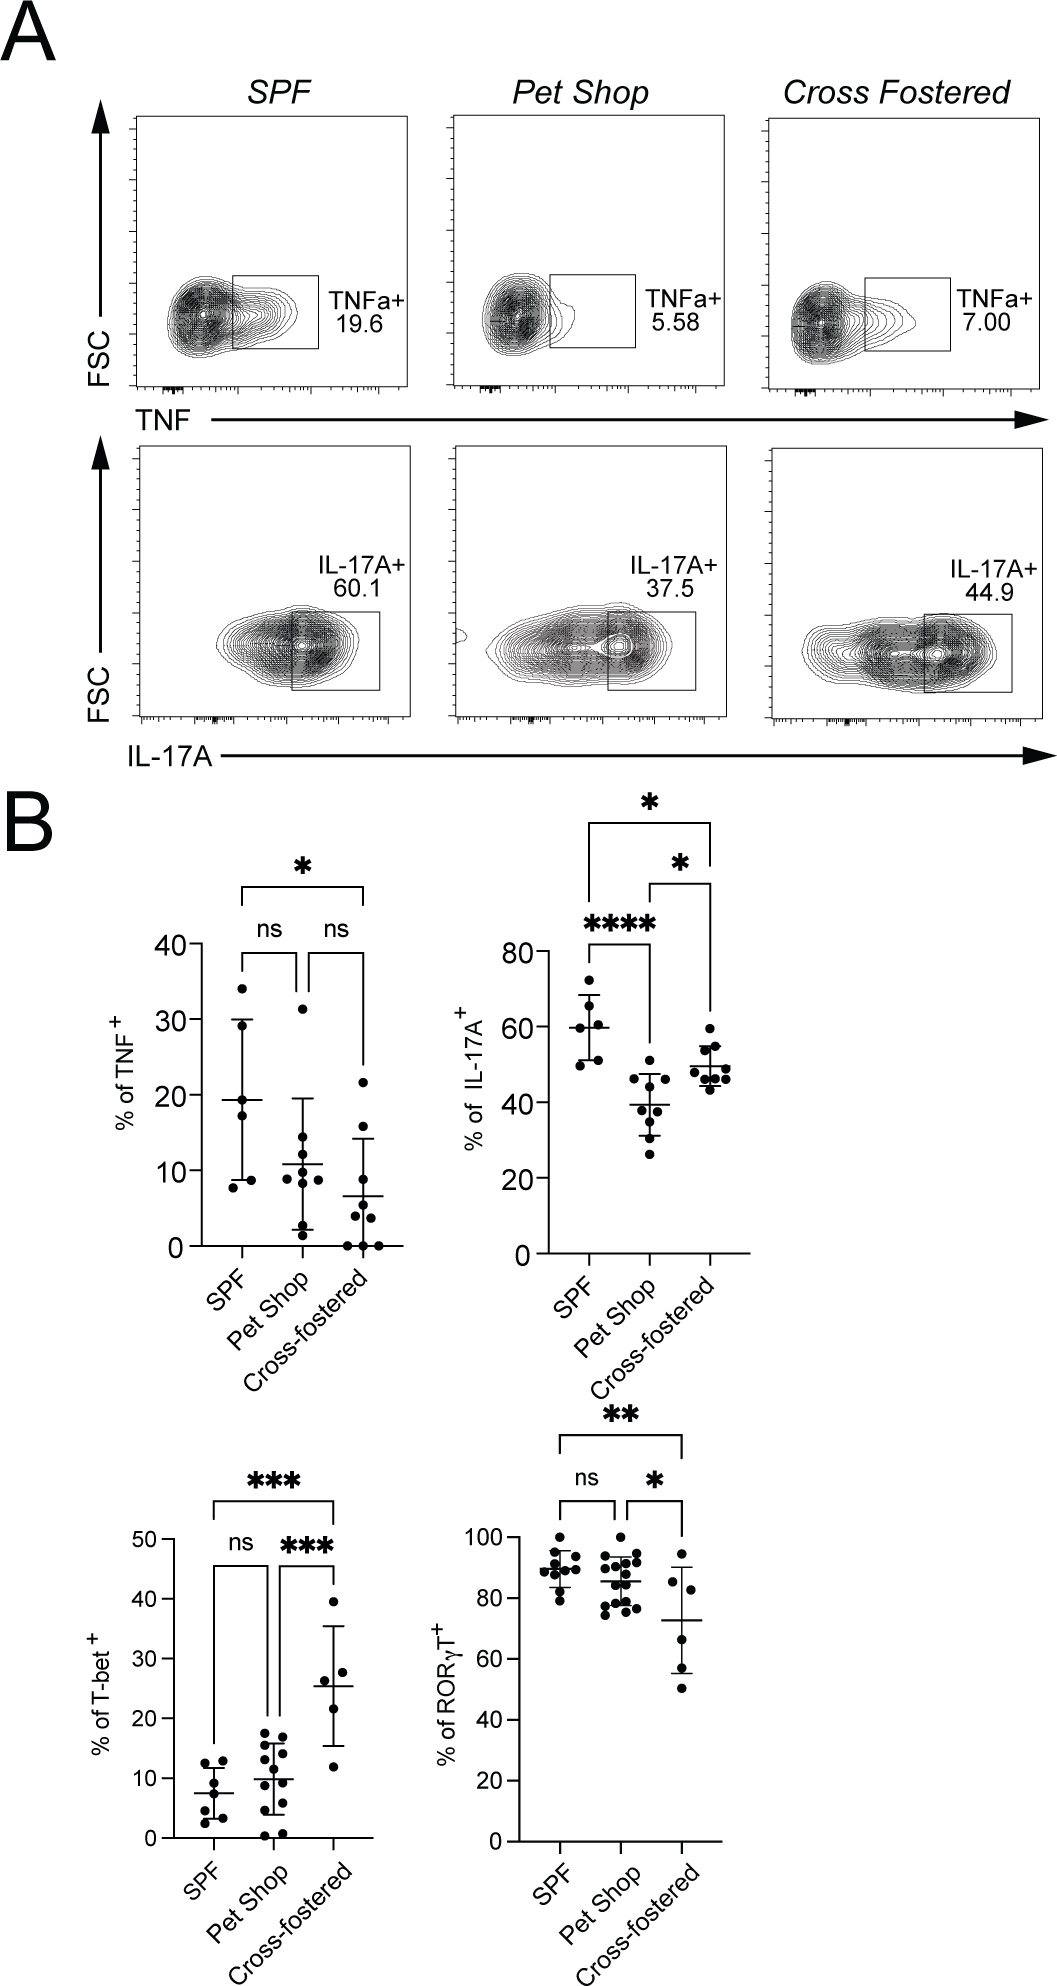
Mucosal-associated invariant T (MAIT) cells are a subset of T lymphocytes that respond to microbial metabolites. We defined MAIT cell populations in different organs and characterized the developmental pathway of mouse and human MAIT cells in the thymus using single-cell RNA sequencing and phenotypic and metabolic analyses. We showed that the predominant mouse subset, which produced IL-17 (MAIT17), and the subset that produced IFN-γ (MAIT1) had not only greatly different transcriptomes but also different metabolic states. MAIT17 cells in different organs exhibited increased lipid uptake, lipid storage, and mitochondrial potential compared with MAIT1 cells. All these properties were similar in the thymus and likely acquired there. Human MAIT cells in lung and blood were more homogeneous but still differed between tissues. Human MAIT cells had increased fatty acid uptake and lipid storage in blood and lung, similar to human CD8 T resident memory cells, but unlike mouse MAIT17 cells, they lacked increased mitochondrial potential. Although mouse and human MAIT cell transcriptomes showed similarities for immature cells in the thymus, they diverged more strikingly in the periphery. Analysis of pet store mice demonstrated decreased lung MAIT17 cells in these so-called "dirty" mice, indicative of an environmental influence on MAIT cell subsets and function.


Figures

Figure 1:
Figure 1:. Mouse MAIT cell populations in different tissues
(A) Transcriptomic analysis of 6,080 mouse MAIT cells at steady state was performed using the 10X Genomics platform. Uniform Manifold Approximation and Projection (UMAP) plots were generated by combining scRNA-seq libraries of MAIT cells from thymus, lung, liver and spleen. Clusters were identified by shared nearest neighbor modularity optimization-based clustering algorithm. (B) Bar graph shows for each cluster the tissue origin of the MAIT cells contributing to that cluster. (C) UMAP plot showing the MAIT17 and MAIT1 signature scores for each cell. Signature scores are the difference between the average expression levels of a gene set and control genes for each cell. (D) Dot plot showing top 5 positive marker genes in each cluster. Color gradient and dot size indicate gene expression intensity and the relative proportion of cells within the cluster expressing each gene, respectively. (E) Representative flow cytometry plots showing expression of the indicated surface proteins and transcription factors by MAIT cells from the indicated tissues. (F) Flow cytometry data were acquired using a panel of 17 fluorescent parameters. MAIT cell data from liver, lung and spleen were used to perform UMAP dimensional reduction and unsupervised clustering using the FlowSOM algorithm on the OMIQ software. A total of 3,791 MAIT cells were included in this analysis. (G) Cytokine expression by MAIT cells upon PMA/Ionomycin stimulation in vitro. Intracellular cytokine staining data were representative of 3–4 mice per group, representative of 3 experiments.
Figure 2:
Figure 2:. MAIT cell changes in gene expression during thymus differentiation.
(A) Single-cell trajectories of mouse MAIT thymocytes constructed using Monocle 3. UMAP shows cells colored by pseudotime values along the trajectory. (B) UMAP showing distribution of thymic MAIT cell clusters across branches of single-cell trajectories. Cluster colors and numbers as in Fig 1A. (C) Heatmap showing different stages of thymus MAIT cell differentiation and respective cell clusters on the x-axis and co-regulated gene modules on the y-axis. Modules consist of genes that are differentially expressed along the thymus trajectory path. The legend shows color-coded aggregate scores for each gene module in all the clusters; positive scores indicate higher gene expression. (D) Scaled average expression heatmap of top 10 genes from each thymocyte gene module based on high Morans I value that were expressed in the indicated clusters of MAIT thymocytes. (E) Flow cytometry data were acquired using a panel of 17 different fluorescent parameters. MAIT cell cytometry data from mouse thymus tissue (n=5) were used to perform UMAP dimensional reduction and unsupervised clustering using the FlowSOM algorithm on the OMIQ software. A total of 1,568 MAIT thymocytes from 9-week-old mice were used for the high parameter flow cytometry analysis. All mice were 9-week-old C57BL/6 females.
Figure 3:
Figure 3:. CD62L+ MAIT cells are predominantly found in the spleen
(A) UMAP showing the tissue resident gene expression signature scores from scRNA-seq data from mouse MAIT cells combined from the four liver, lung, spleen and thymus. (B) UMAP feature plots showing expression of key genes in MAIT cells combined from the four organs. (C) UMAP of scRNA-seq dataset of mouse splenic MAIT cells including only cells in which a Trav1 transcript was detected combined from sorted CD62L+ and CD62L cells. (D) Dot pot of scRNA-seq data from Trav1+ mouse splenic MAIT cells showing expression of key genes in each cluster. (E) C57BL/6 mice were injected at t=0 and t=24h with 5-OP-RU and CpG or CpG alone. Splenic T cells were analyzed for Ki67 expression 48h later. One representative experiment out of two is shown, (F) (top) Number of MAIT cells in the indicated chimeric mice. Donor BM cells were from Mr1+/+ mice (black symbols) or Mr1−/− mice (red symbols); recipients were Mr1+/+ (filled circles) or Mr1−/− mice (open circles). Spleens were harvested after 8 weeks and analyzed by flow cytometry for MR1-tetramer binding cells. (bottom) Expression of CD44 and CD62L on MR1 tetramer-binding spleen cells from chimeric mice. Absolute numbers of CD62L+ and CD62L tetramer-binding spleen cells are shown. Data analyzed by Kruskal-Wallis with Tukey post-test for multiple comparisons, displayed as mean± SEM, NS: P ≥ 0.05.
Figure 4:
Figure 4:. Mouse MAIT cell subsets have distinct metabolic features
(A-B) Metabolic parameters of MAIT thymocytes were quantified for the thymus MAIT cell differentiation stages 1–3 and mature MAIT1 and MAIT17 thymocytes. Representative histograms (A) and quantification (B) are depicted as geometric mean of fluorescence intensity (gMFI). Neutral lipid droplets were quantified by Bodipy 493/503 fluorescence (left), fatty acid uptake was quantified as intensity of Bodipy FL C16 fluorescence (center left), mitochondrial content was quantified as MitoTracker Deep Red FM fluorescence (center right) and glucose consumption by uptake of 2-NBDG (right). (C-H) Cells were isolated from spleen, lung and liver and metabolic parameters were quantified in CD8+ naïve, central memory (CM) and effector memory (EM) TCRβ+ CD8+ T cells and MAIT cell subsets. Representative histograms (C) and quantification (D) of fatty acid uptake in the indicated cell types. Representative histograms (E) and quantification (F) of neutral lipid droplet content. Representative histograms (G) and quantification (H) of mitochondrial content. Data from 3–4 mice per group, representative of ≥3 experiments. Data analyzed by one-way ANOVA with Dunnett’s post-test for multiple comparisons, displayed as mean± SEM, *P <0.05, **P <0.01 ***P <0.001 and ****P <0.0001.
Figure 5:
Figure 5:. Human MAIT cell populations in different organs
(A) UMAP plots of transcriptomic analysis of human MAIT cells generated by combining three individual scRNA-seq libraries from human thymus (n=5), lung (n=4) and PBMCs matched from the lung donors (n=4) (Supplementary Table S7). (B) Bar graph shows the contribution of MAIT cells from different tissues to individual clusters. (C) Dot plot showing top 5 positive marker genes for each cluster. (D) UMAP showing the MAIT1, MAIT17, tissue residency and circulating signature scores for each cell. (E) UMAP (left) of human MAIT cells from thymus with cells ordered in pseudotime and UMAP showing distribution of thymic MAIT cells (right) across branches of single-cell trajectories. Cells are colored and numbered by clusters as in Fig. 5A. (F) Heatmap showing different stages of development and respective cell clusters on the x-axis and co-regulated gene modules on the y-axis. Modules were generated with genes that are differentially expressed along the trajectory path. The legend shows color-coded aggregate module scores for gene modules for cells in each cluster; positive scores indicated higher gene expression. (G) Scaled average expression heatmap of top 10 genes from modules that were expressed in indicated stages of MAIT cell development based on high Morans I value as shown in Fig 5F. These genes were selected based on their expression changes as the cells progressed along the MAIT cell developmental trajectory.
Figure 6:
Figure 6:. Human MAIT cell metabolic parameters differ from naïve CD8+ T cells
Cells were isolated from paired samples of human lung biopsies (A and B) or blood (C and D) and metabolic parameters were quantified in CD8+ T cell and MAIT cell subsets. TCRβ+ CD8+ T cells excluding MAITs were subdivided into naïve, central memory (CM), effector memory (EM) and resident memory (RM) subsets based on expression of CD45RA, CCR7 and CD103. Representative histograms (A, C) and quantification (B, D) of fatty acid uptake (left) was measured as gMFI of Bodipy FL C16. Neutral lipid droplet content (middle) was measured as gMFI of Bodipy 493/503 fluorescence. Mitochondrial potential is indicated as gMFI of MitoTracker Deep Red FM signal (right). Data combined from 2 experiments and 3 donors (A-B) or from 3 experiments and 3 donors (C-D). Data were analyzed by one-way ANOVA with Dunnett’s post-test for multiple comparisons, displayed as mean ± SEM, *P <0.05, **P <0.01 ***P <0.001 and ****P <0.0001.
Figure 7:
Figure 7:. Divergent mouse and human peripheral MAIT cell subsets
(A) Aggregated UMAP representation of scRNA-seq data from mouse and human MAIT cells. (B) Mouse and human cells shown in separate UMAPs by tissue and species with the same coordinates as in Fig 7A. (C) Dot plot showing top 5 genes in each integrated cluster across both mouse and human cells. Color gradient and size of dots indicate gene expression intensity and the relative proportion of cells (within the cluster) that expressed each gene respectively.
Figure 8:
Figure 8:. Pet shop mice MAIT cells have an altered phenotype
(A) Representative flow cytometry showing the percentage of MAIT cells expressing TNF and IL-17A from lungs of the indicated mice. (B) Cumulative data of expression of TNF, IL-17A, T-bet and RORγT analyzed by one-way ANOVA with Tukey test displayed as mean ± S.D. SPF mice n = 10, Pet shop mice n=16 and Cross-fostered mice n=6, *P <0.05, **P <0.01 ***P <0.001 and ****P <0.0001.

References

    1. Treiner E et al., Mucosal-associated invariant T (MAIT) cells: an evolutionarily conserved T cell subset. Microbes Infect 7, 552–559 (2005). - PubMed
    1. Kjer-Nielsen L et al., MR1 presents microbial vitamin B metabolites to MAIT cells. Nature 491, 717–723 (2012). - PubMed
    1. Tilloy F et al., An invariant T cell receptor alpha chain defines a novel TAP-independent major histocompatibility complex class Ib-restricted alpha/beta T cell subpopulation in mammals. J Exp Med 189, 1907–1921 (1999). - PMC - PubMed
    1. Treiner E et al., Selection of evolutionarily conserved mucosal-associated invariant T cells by MR1. Nature 422, 164–169 (2003). - PubMed
    1. Gold MC et al., Human mucosal associated invariant T cells detect bacterially infected cells. PLoS Biol 8, e1000407 (2010). - PMC - PubMed

Publication types