. 2024 Feb 15;209(4):402-416.
doi: 10.1164/rccm.202305-0890OC.

Host Response Changes and Their Association with Mortality in COVID-19 Patients with Lymphopenia

Collaborators, Affiliations

Host Response Changes and Their Association with Mortality in COVID-19 Patients with Lymphopenia

Erik H A Michels et al. Am J Respir Crit Care Med. .

Abstract

Rationale: Lymphopenia in coronavirus disease (COVID-19) is associated with increased mortality. Objectives: To explore the association between lymphopenia, host response aberrations, and mortality in patients with lymphopenic COVID-19. Methods: We determined 43 plasma biomarkers reflective of four pathophysiological domains: endothelial cell and coagulation activation, inflammation and organ damage, cytokine release, and chemokine release. We explored if decreased concentrations of lymphocyte-derived proteins in patients with lymphopenia were associated with an increase in mortality. We sought to identify host response phenotypes in patients with lymphopenia by cluster analysis of plasma biomarkers. Measurements and Main Results: A total of 439 general ward patients with COVID-19 were stratified by baseline lymphocyte counts: normal (>1.0 × 10⁹/L; n = 167), mild lymphopenia (>0.5 to ⩽1.0 × 10⁹/L; n = 194), and severe lymphopenia (⩽0.5 × 10⁹/L; n = 78). Lymphopenia was associated with alterations in each host response domain. Lymphopenia was associated with increased mortality. Moreover, in patients with lymphopenia (n = 272), decreased concentrations of several lymphocyte-derived proteins (e.g., CCL5, IL-4, IL-13, IL-17A) were associated with an increase in mortality (at P < 0.01 or stronger significance levels). A cluster analysis revealed three host response phenotypes in patients with lymphopenia: "hyporesponsive" (23.2%), "hypercytokinemic" (36.4%), and "inflammatory-injurious" (40.4%), with substantially differing mortality rates of 9.5%, 5.1%, and 26.4%, respectively. A 10-biomarker model accurately predicted these host response phenotypes in an external cohort with similar mortality distribution. The inflammatory-injurious phenotype showed a remarkable combination of relatively high inflammation and organ damage markers with high antiinflammatory cytokine levels yet low proinflammatory cytokine levels. Conclusions: Lymphopenia in COVID-19 signifies a heterogenous group of patients with distinct host response features. Specific host responses contribute to lymphopenia-associated mortality in COVID-19, including reduced CCL5 levels.

Keywords: biomarkers; cytokines; lymphocytes; phenotype; pneumonia.


Figures
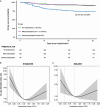
Figure 1.
Figure 1.
Mortality analysis of patients with coronavirus disease admitted to the general ward stratified by the extent of lymphopenia. (A) Kaplan-Meier plot of patients stratified by the extent of lymphopenia. (B) The risk of 30-day mortality with lymphocyte counts modeled as a continuous variable. Given the nonlinear relationship between lymphocyte counts and mortality, we used a restricted cubic spline function with three inner knots at default quantile locations. The cutoff value of lymphopenia (lymphocyte counts ⩽1 × 109/L) was set as the reference category and is indicated by a dotted purple line. The blue dotted line reflects the cutoff value of severe lymphopenia (⩽0.5 × 109/L). The gray shading represents the 95% confidence interval of the 30-day mortality odds ratio. (C) Same as B but adjusted for demographic characteristics (age, inclusion hospital, sex, and inclusion “wave”), lymphopenia-associated comorbidities (malignancies and immunosuppression), and coronavirus disease–related treatments (corticosteroids, anti–IL-6, imatinib, remdesivir, and antibiotics).
Figure 2.
Figure 2.
Principal component (PC) analysis of host response domain differences among patients with coronavirus disease stratified by the extent of lymphopenia: no lymphopenia (>1 × 109/L), mild lymphopenia (>0.5 to ⩽1 × 109/L), or severe lymphopenia (⩽0.5 × 109/L). (A) Endothelial cell and coagulation activation. (B) Systemic inflammation and organ damage. (C) Cytokine release. (D) Chemokine release. The x- and y-axes of each plot display the percentages of the total variance within that domain that are explained by PC1 and PC2, respectively. The ellipses indicate the central 10% of each group and are color-coded as indicated at the bottom of the figure. The arrows indicate the direction (arrow orientation) and strength (arrow length) of the association between each biomarker and the PCs. If a biomarker’s arrow points toward the ellipse of a group, patients in that group have increased concentrations of that biomarker relative to the other groups. A biomarker arrow that points away from the ellipse of a group represents a decrease in the biomarker among the patients in that group. See Table E4 for the complete contribution of each individual biomarker to a PC. Next to each PC analysis plot are box plots with 1.5-IQR whiskers of PC1 and PC2. The upper P values were obtained from an ANOVA comparing all groups. ρ Values with accompanying P values were generated using a Spearman’s correlation of the PCs and lymphocyte counts on a continuous scale. Post hoc testing was done with a Tukey test (***P < 0.001, **P < 0.01, *P < 0.05). ANG = angiopoietin; CCL = chemokine C-C motif ligand; CD40L = CD40 ligand; CXCL = C-X-C motif chemokine ligand; GM-CSF = granulocyte–macrophage colony–stimulating factor; PAI-1 = plasminogen activator inhibitor-1; PD-L1 = programmed death-ligand 1; sCD31 = soluble CD31; sE-selectin = soluble E-selectin; SP-D = surfactant protein D; sRAGE = soluble receptor for advanced glycation end-products; sThrombomodulin = soluble thrombomodulin; sTie-2 = soluble Tie-2; sTNF-R1 = soluble tumor necrosis factor receptor 1; sTREM-1 = soluble triggering receptor expressed on myeloid cells 1; sVCAM-1 = soluble vascular cellular adhesion molecule-1; TNF = tumor necrosis factor.
Figure 3.
Figure 3.
Association of host response biomarkers with mild and severe lymphopenia. (A) Heat map depicting the magnitude of biomarker differences (Hedges’ g) in patients with coronavirus disease (COVID-19) with mild (>0.5 to ⩽1 × 109/L) or severe lymphopenia (⩽0.5 × 109/L) compared with patients with COVID-19 without lymphopenia (>1 × 109/L). P values were obtained from a linear (if linear) or cubic spline regression analysis (if nonlinear) in which the lymphocyte count was modeled as a continuous variable. The adjusted model included demographic characteristics, history of immunosuppression or malignancies, and COVID-19–related immunomodulating treatments before sampling (see Methods for details). Red indicates a higher concentration in patients with mild or severe lymphopenia compared with patients without lymphopenia; blue indicates lower levels in these patients compared with patients without lymphopenia. (B) Volcano plot depicting the direct comparison of patients with severe lymphopenia versus patients with mild lymphopenia using a t test. Red dots represent a significantly higher concentration in patients with severe lymphopenia, blue dots a significantly lower concentration in these patients, and gray dots biomarkers with a nonsignificant difference. All P values are multiple testing–corrected using the Benjamini-Hochberg procedure for the testing of 43 biomarkers (***P < 0.001, **P < 0.01, *P < 0.05). Dagger indicates biomarkers with a nonlinear relationship with lymphocyte counts on a continuous scale. ANG = angiopoietin; CCL = chemokine C-C motif ligand; CD40L = CD40 ligand; CXCL = C-X-C motif chemokine ligand; GM-CSF = granulocyte–macrophage colony–stimulating factor; PAI-1 = plasminogen activator inhibitor-1; PD-L1 = programmed death-ligand 1; sCD31 = soluble CD31; sE-selectin = soluble E-selectin; SP-D = surfactant protein D; sRAGE = soluble receptor for advanced glycation end-products; sThrombomodulin = soluble thrombomodulin; sTie-2 = soluble Tie-2; sTNF-R1 = soluble tumor necrosis factor receptor 1; sTREM-1 = soluble triggering receptor expressed on myeloid cells 1; sVCAM-1 = soluble vascular cellular adhesion molecule-1; TNF = tumor necrosis factor.
Figure 4.
Figure 4.
Association of lymphocyte-derived proteins with lymphocyte counts and mortality in patients with coronavirus disease and lymphopenia. Quadrant plot: the x-axis depicts the increase in the 30-day mortality odds ratio per 25% increase of the biomarker derived from a logistic regression with the log-transformed biomarker as the explanatory variable and 30-day mortality as the response variable. The y-axis shows the percentage change in the biomarker concentration per 0.1 × 109/L increase in lymphocyte count. This percentage change was derived from a linear regression analysis with the log-transformed biomarker as the response variable. Biomarkers in the top left corner are of interest. These biomarkers are secreted by lymphocytes and decreased in lymphopenia, and this decrease in concentration is associated with an increase in 30-day mortality. The significance of the coefficient of all biomarkers was multiple testing–corrected using the Benjamini-Hochberg procedure for the testing of 16 biomarkers. CCL = chemokine C-C motif ligand; CXCL = C-X-C motif chemokine ligand; GM-CSF = granulocyte–macrophage colony–stimulating factor; TNF = tumor necrosis factor.
Figure 5.
Figure 5.
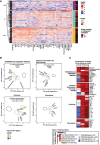
Host response phenotypes in patients with coronavirus disease with lymphopenia. (A) Heat map of host response phenotypes: rows represent patients, and columns represent biomarkers. Red values indicate a higher concentration of a biomarker in that patient compared with the other included patients, whereas blue values indicate lower concentrations. The first column to the right of the heat map depicts the cluster assignment: cluster 1 (aquamarine), cluster 2 (yellow), and cluster 3 (purple). The second column to the right of the heat map shows whether patients were undergoing ventilation or died during their first 30 days of hospital admission. (B) Principal component (PC) analysis of host response domain differences between the three host response phenotypes. Each plot’s x- and y-axes portray the percentages of the total variance within that domain explained by PC1 and PC2, respectively. The ellipses indicate the central 10% of each group and are color-coded as shown at the bottom of the figure. The arrows indicate the direction (arrow orientation) and strength (arrow length) of the association between each biomarker and the PCs. (C) Heat map depicting the magnitude of biomarker differences (Hedges’ g) between two clusters. The first column (1 vs. 2) depicts the biomarker concentrations in all patients assigned to cluster 1 compared with the concentrations in patients assigned to cluster 2. The second and third columns depict the concentration in cluster 1 versus that in cluster 3 and the concentration in cluster 2 versus that in cluster 3, respectively. ANG = angiopoietin; CCL = chemokine C-C motif ligand; CD40L = CD40 ligand; CXCL = C-X-C motif chemokine ligand; GM-CSF = granulocyte–macrophage colony–stimulating factor; PAI-1 = plasminogen activator inhibitor-1; PD-L1 = programmed death-ligand 1; sCD31 = soluble CD31; sE-selectin = soluble E-selectin; SP-D = surfactant protein D; sRAGE = soluble receptor for advanced glycation end-products; sThrombomodulin = soluble thrombomodulin; sTie-2 = soluble Tie-2; sTNF-R1 = soluble tumor necrosis factor receptor 1; sTREM-1 = soluble triggering receptor expressed on myeloid cells 1; sVCAM-1 = soluble vascular cellular adhesion molecule-1; TNF = tumor necrosis factor.
Figure 6.
Figure 6.
Characteristics of the gradient-boosted tree model and validation of the host response phenotypes and their association with outcomes in an independent cohort. (A) The top 20 cluster-discriminating and -classifying biomarkers in the derivation cohort derived from a gradient-boosted tree prediction model. The model was built to predict the cluster assignment using the 35 biomarkers that were available in both cohorts. The feature importance of each biomarker was based on the mean Shapley Additive Explanations (SHAP) value of a biomarker across all clusters (35). A biomarker with a high SHAP value for a specific cluster has a high impact on the model for the prediction of that cluster (e.g., IL-10 concentrations are important for the assignment to cluster 1 but less so for cluster 2). The red box portrays the biomarkers used to build a new prediction gradient–boosting model in the derivation cohort including only these 10 biomarkers. The impact is independent of the direction. A high impact indicates a substantial change (which may be an increase or decrease) in the cluster probability for a patient due to increased or reduced concentrations of that biomarker. Figure E4 shows the directionality of the top 20 biomarkers per cluster in the 35-biomarker model. (B) Feature importance of the biomarkers in the 10-biomarker gradient-boosting model for the prediction of cluster 1 (left), cluster 2 (middle), and cluster 3 (right). Each colored dot represents a patient. Red dots represent patients with a relatively high concentration of that biomarker; blue dots represent patients with a relatively low concentration. A SHAP value greater than 0 indicates that the biomarker is important for the assignment to that cluster. A SHAP value less than 0 indicates that the biomarker is important for not being assigned to that cluster (e.g., in the left panel, a red dot in the row of IL-10 at a SHAP value of 0.5 indicates that, in that patient, the relatively high concentration of IL-10 increases the likelihood of the patient to be assigned to cluster 1 by the model). (C) Comparison of the distribution of clusters, mortality, and the incidence of severe lymphopenia between the derivation and validation cohorts. (D) Incidence of mortality per host response phenotype in the derivation and validation cohorts. CCL = chemokine C-C motif ligand; CD40L = CD40 ligand; CXCL = C-X-C motif chemokine ligand; PAI-1 = plasminogen activator inhibitor-1; sRAGE = soluble receptor for advanced glycation end-products; sThrombomodulin = soluble thrombomodulin; sTNF-R1 = soluble tumor necrosis factor receptor 1; sVCAM-1 = soluble vascular cellular adhesion molecule-1.

Comment in

References

    1. Osuchowski MF, Winkler MS, Skirecki T, Cajander S, Shankar-Hari M, Lachmann G, et al. The COVID-19 puzzle: deciphering pathophysiology and phenotypes of a new disease entity. Lancet Respir Med . 2021;9:622–642. - PMC - PubMed
    1. Du Y, Tu L, Zhu P, Mu M, Wang R, Yang P, et al. Clinical features of 85 fatal cases of COVID-19 from Wuhan. A retrospective observational study. Am J Respir Crit Care Med . 2020;201:1372–1379. - PMC - PubMed
    1. Chotirmall SH, Leither LM, Çoruh B, Chan LLY, Joudi AM, Brown SM, et al. Update in COVID-19 2020. Am J Respir Crit Care Med . 2021;203:1462–1471. - PMC - PubMed
    1. Huang I, Pranata R. Lymphopenia in severe coronavirus disease-2019 (COVID-19): systematic review and meta-analysis. J Intensive Care . 2020;8:36. - PMC - PubMed
    1. Rijkers G, Vervenne T, van der Pol P. More bricks in the wall against SARS-CoV-2 infection: involvement of γ9δ2 T cells. Cell Mol Immunol . 2020;17:771–772. - PMC - PubMed

Publication types