. 2023 Nov 9;186(23):5015-5027.e12.
doi: 10.1016/j.cell.2023.10.013.

Proteostasis governs differential temperature sensitivity across embryonic cell types

Affiliations

Proteostasis governs differential temperature sensitivity across embryonic cell types

Michael W Dorrity et al. Cell. .

Abstract

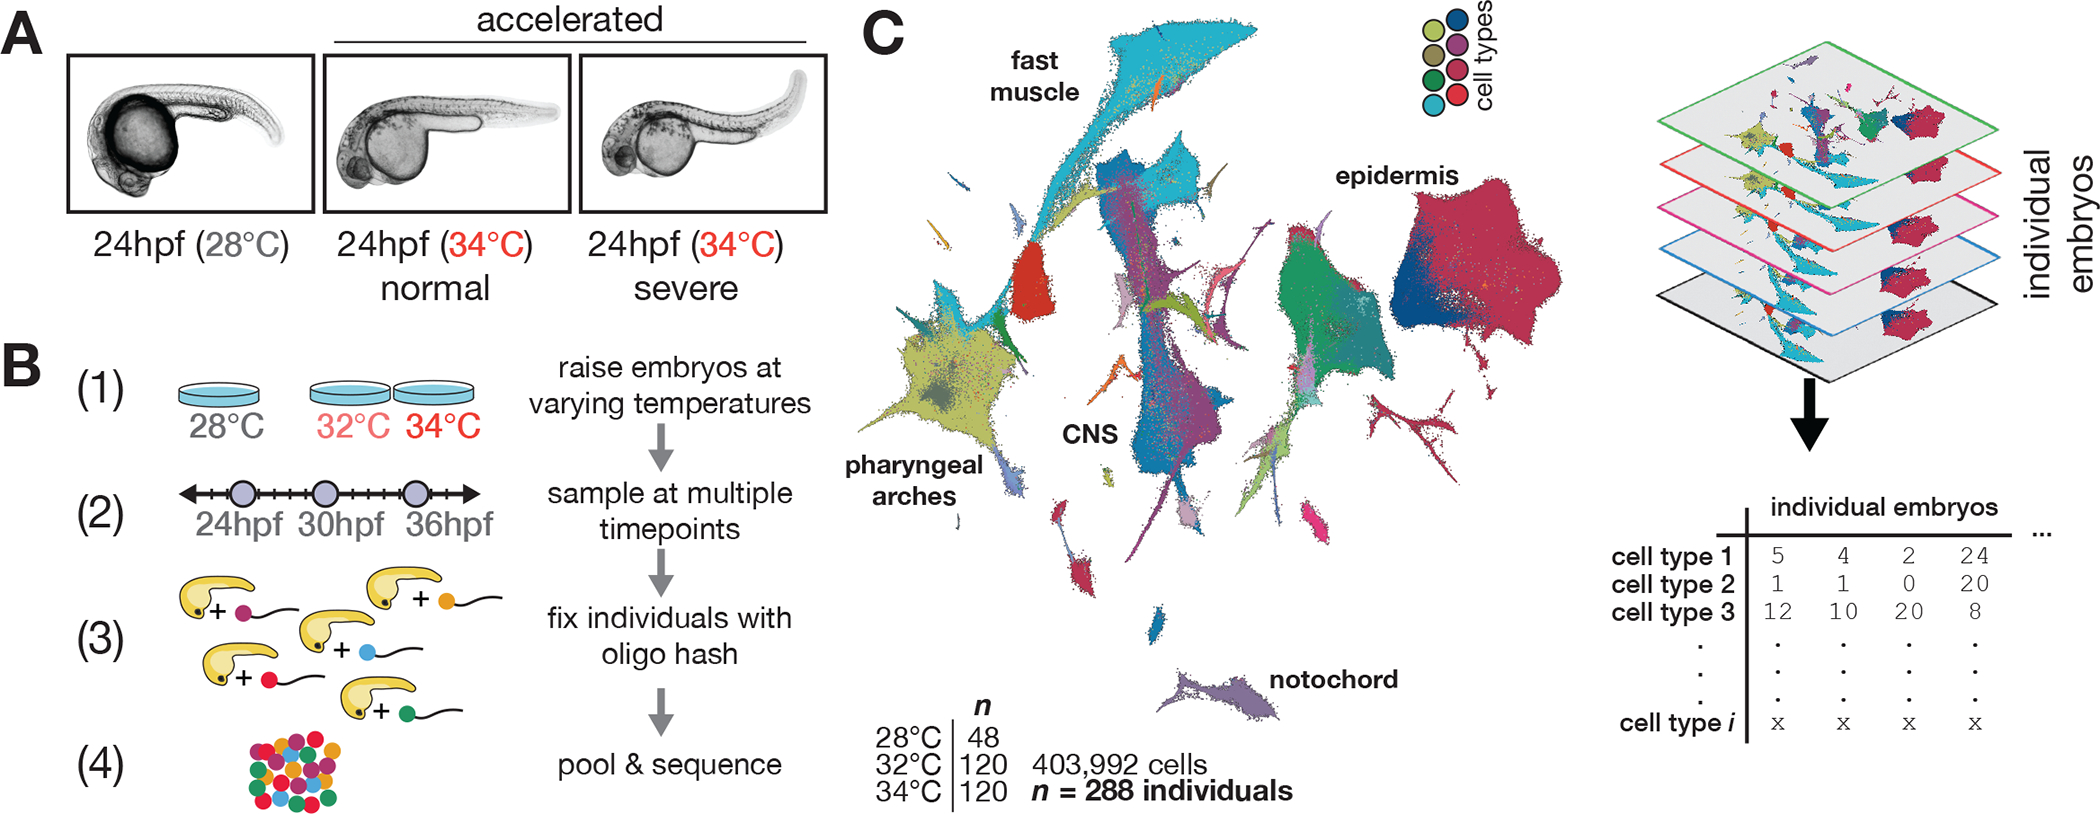
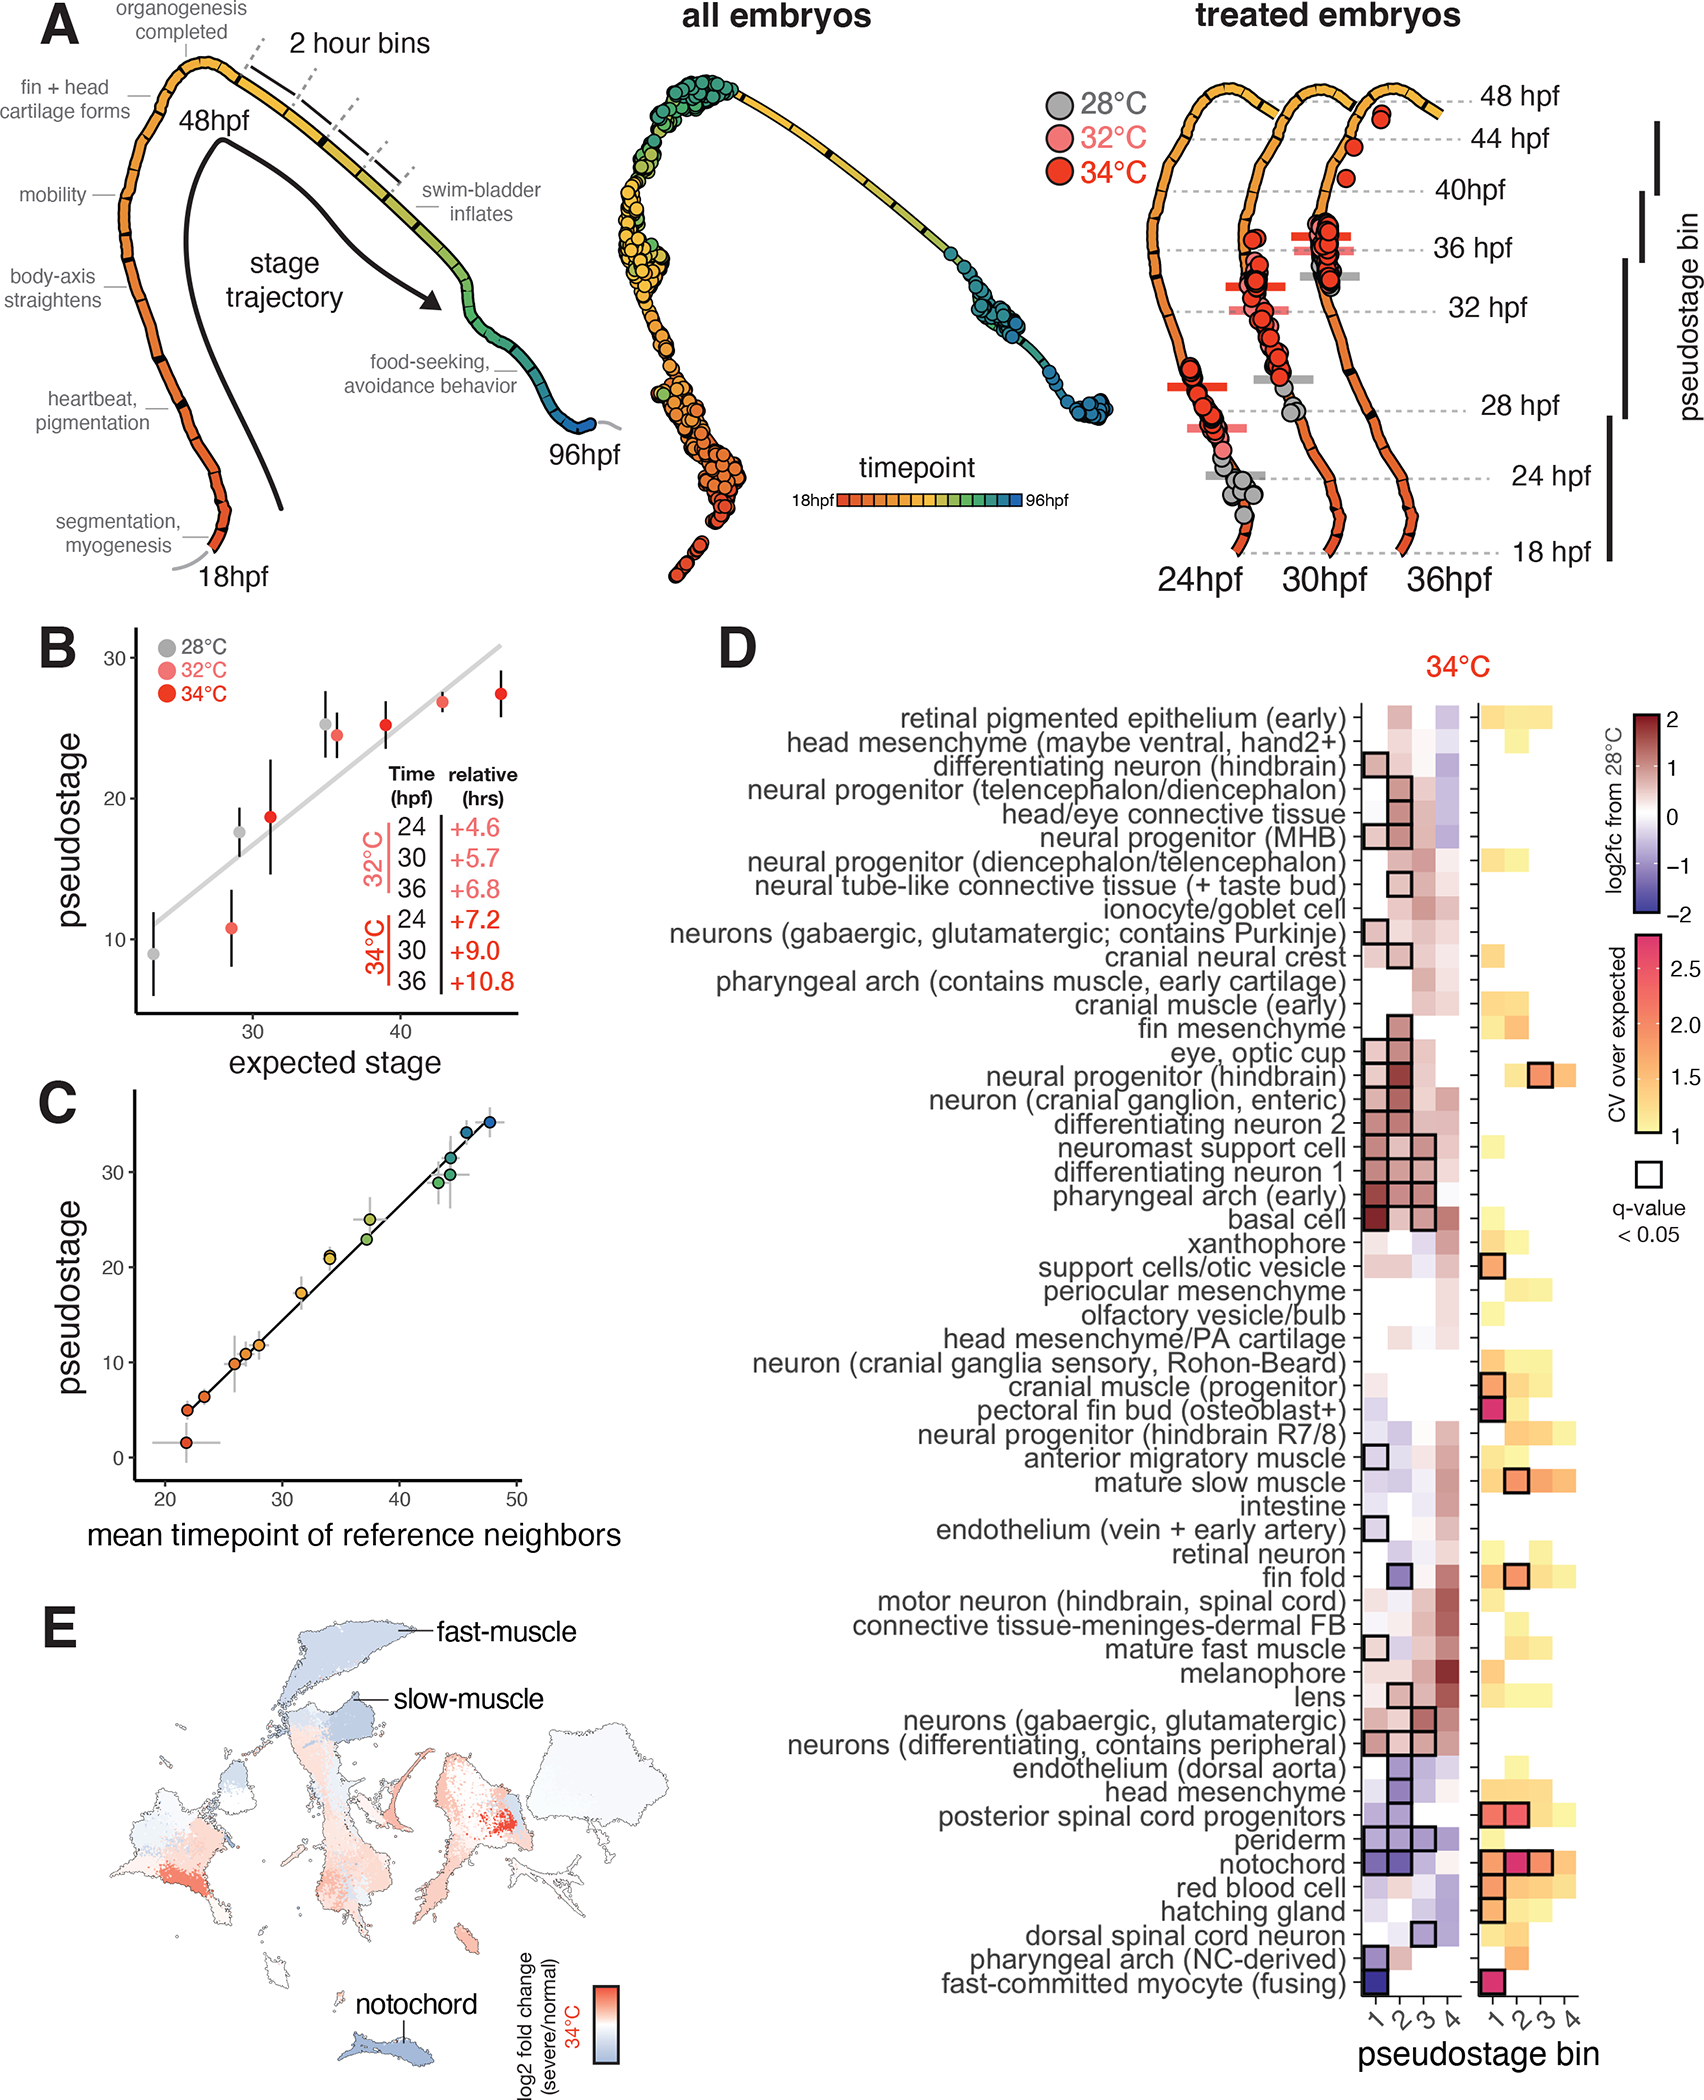
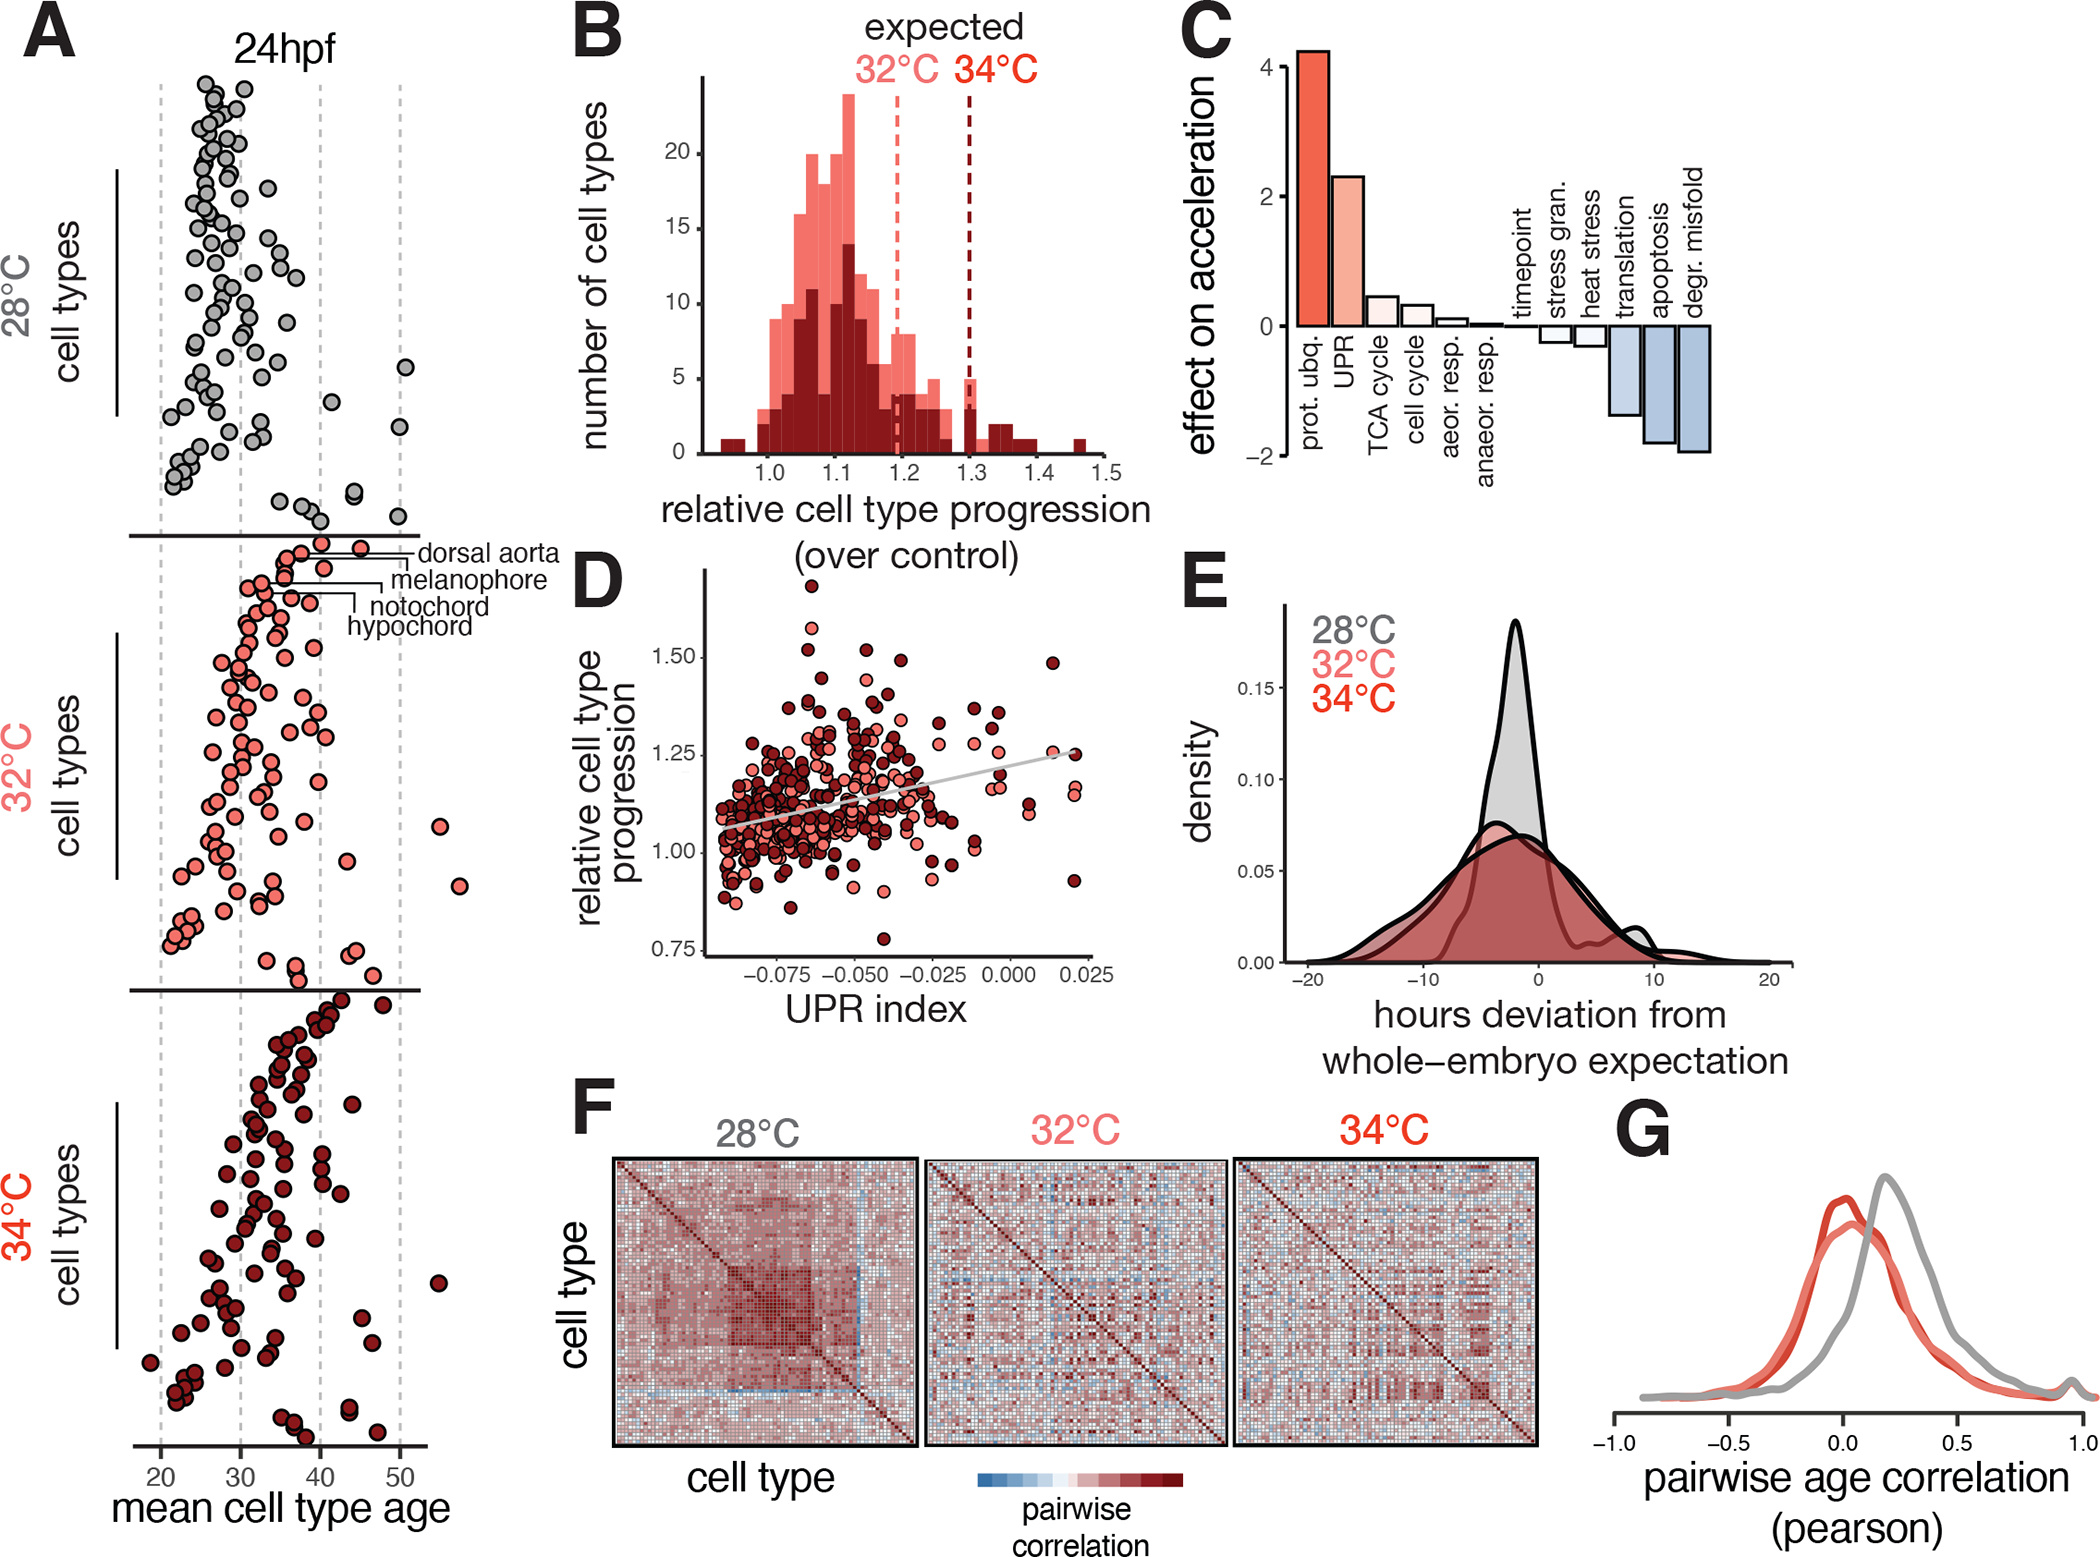
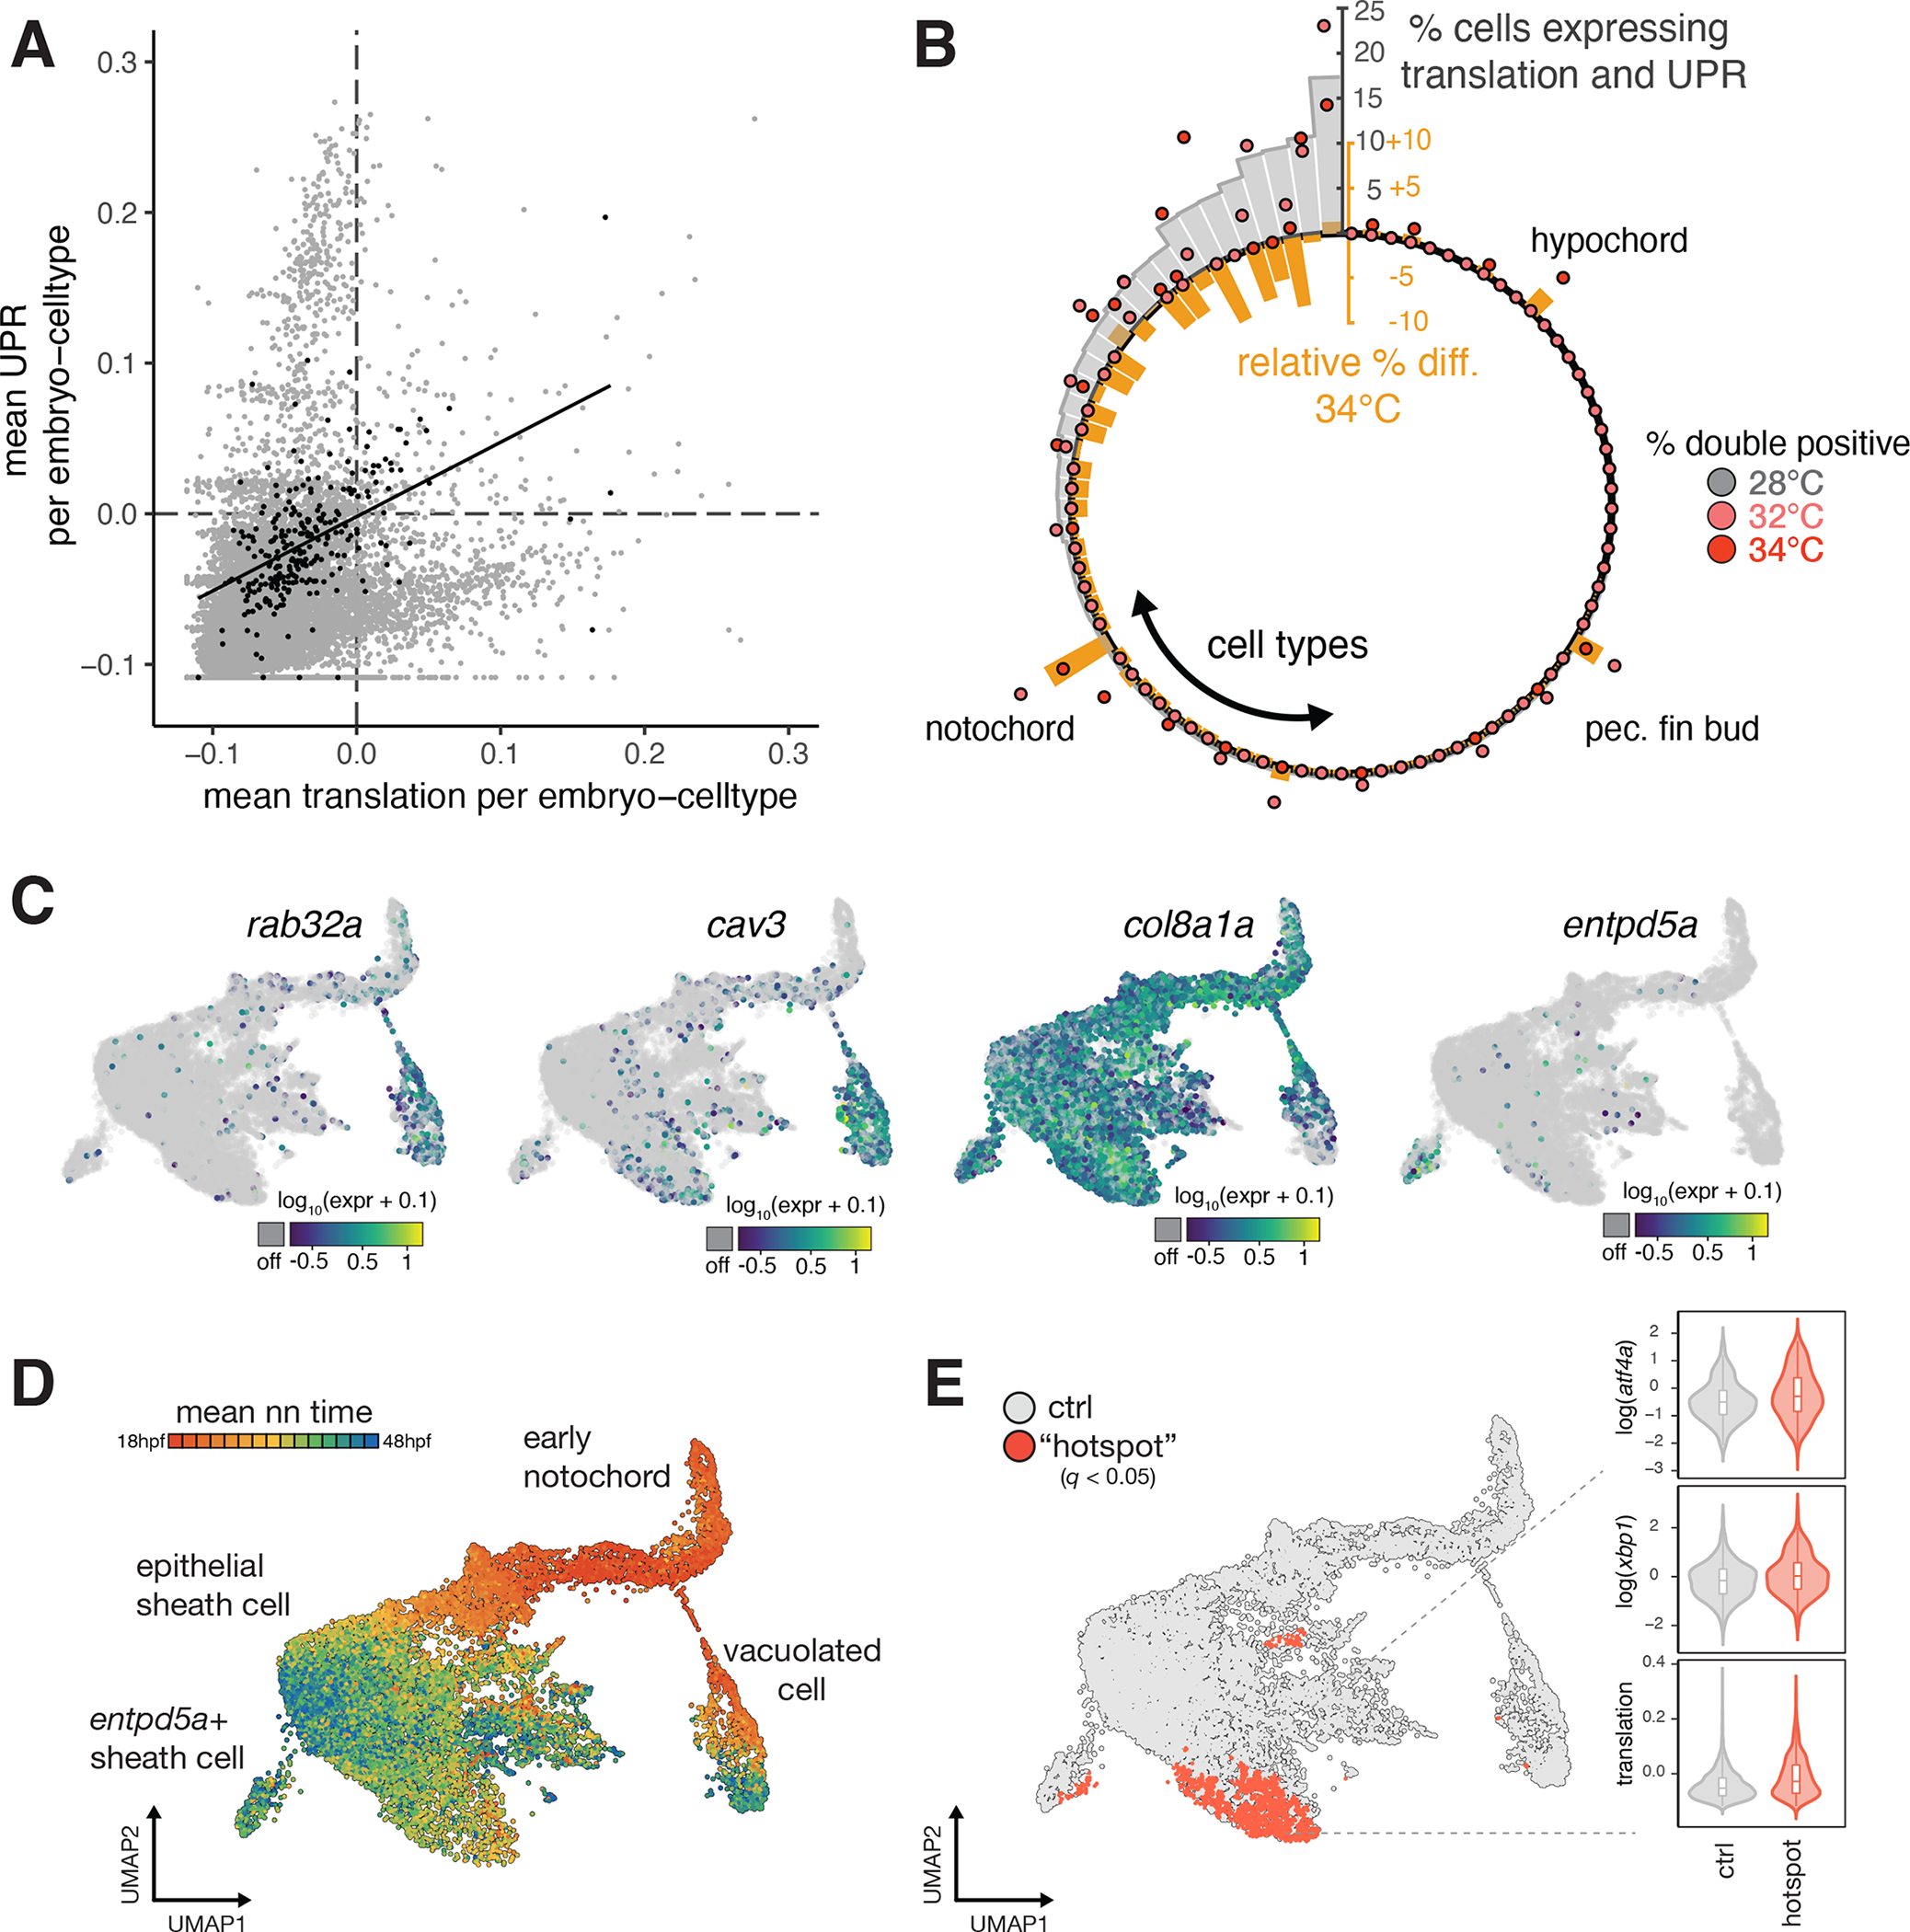
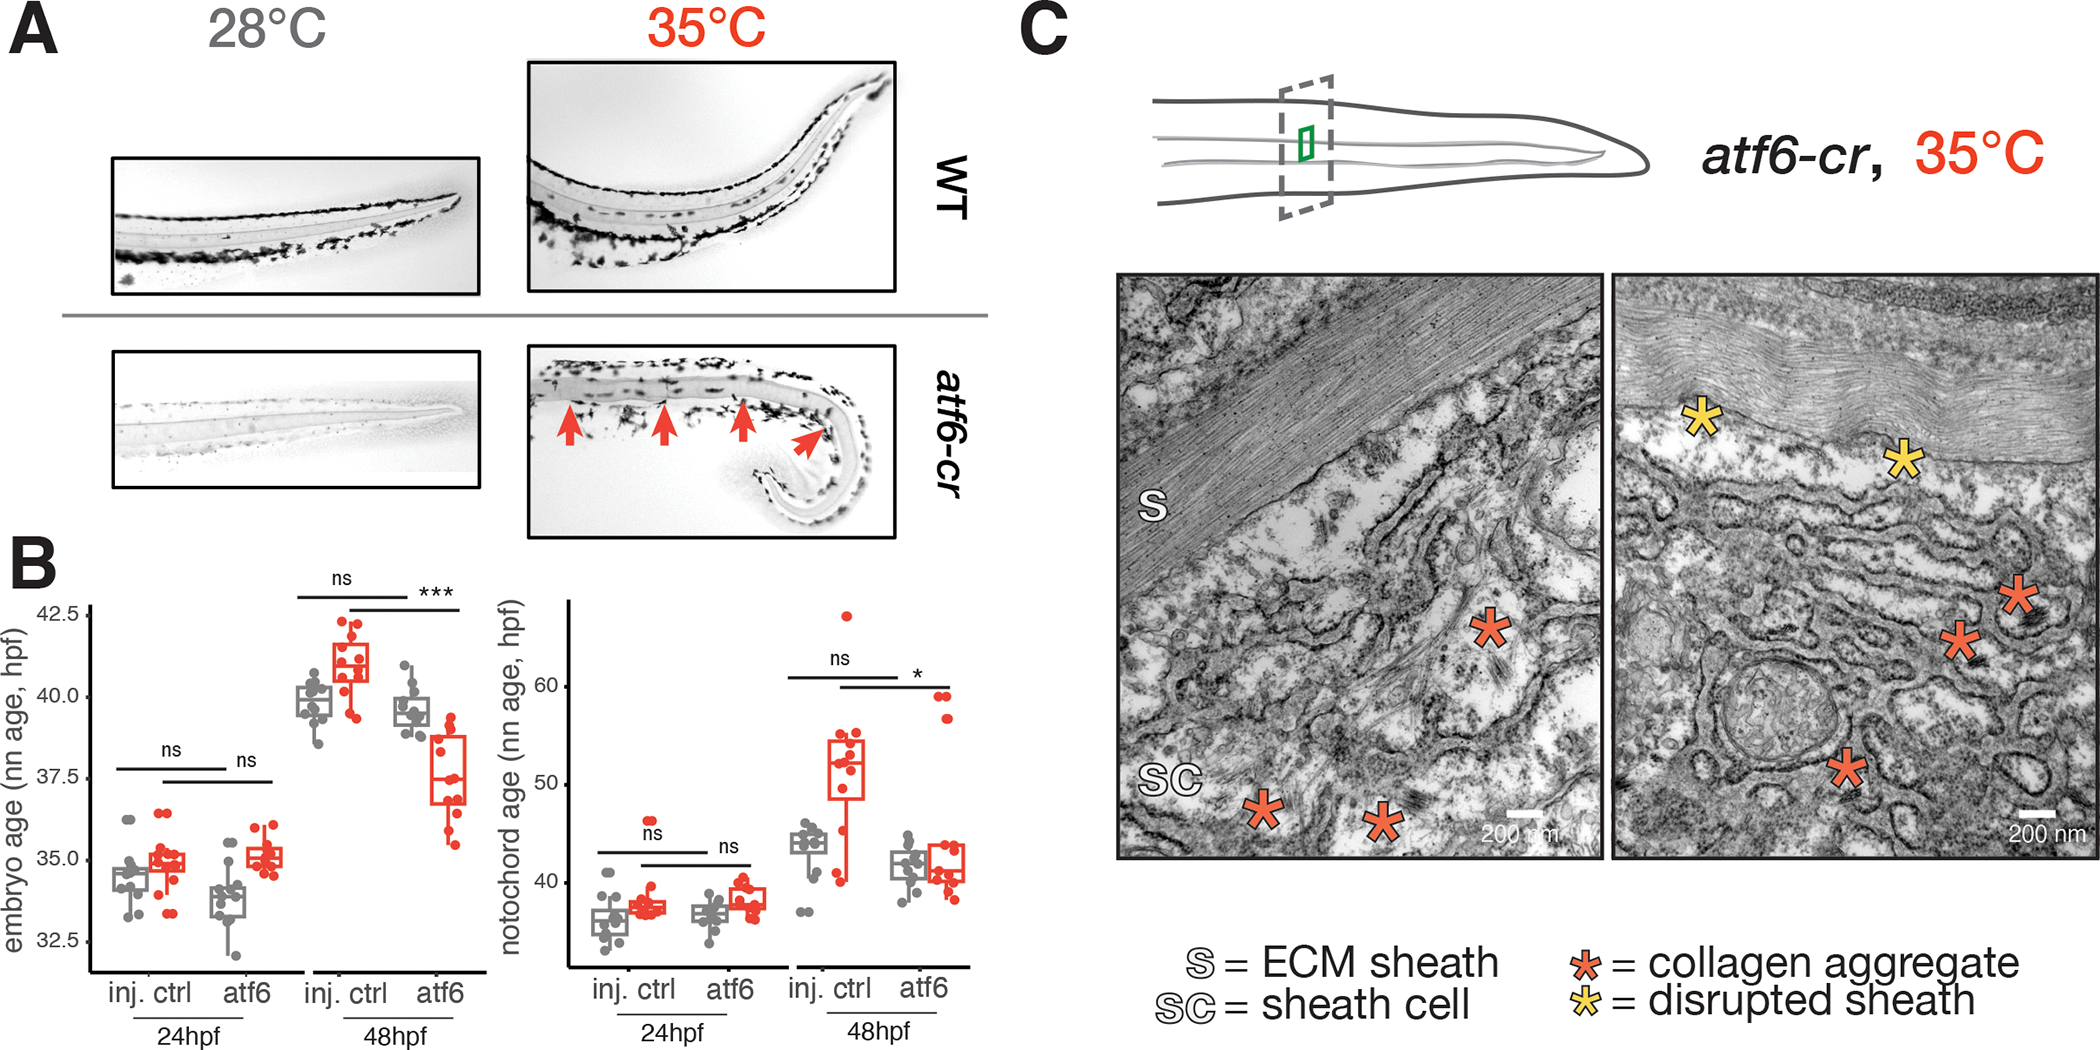
Embryonic development is remarkably robust, but temperature stress can degrade its ability to generate animals with invariant anatomy. Phenotypes associated with environmental stress suggest that some cell types are more sensitive to stress than others, but the basis of this sensitivity is unknown. Here, we characterize hundreds of individual zebrafish embryos under temperature stress using whole-animal single-cell RNA sequencing (RNA-seq) to identify cell types and molecular programs driving phenotypic variability. We find that temperature perturbs the normal proportions and gene expression programs of numerous cell types and also introduces asynchrony in developmental timing. The notochord is particularly sensitive to temperature, which we map to a specialized cell type: sheath cells. These cells accumulate misfolded protein at elevated temperature, leading to a cascading structural failure of the notochord and anatomic defects. Our study demonstrates that whole-animal single-cell RNA-seq can identify mechanisms for developmental robustness and pinpoint cell types that constitute key failure points.

Keywords: developmental robustness; single-cell RNA-seq; variability; zebrafish.


Conflict of interest statement

Declaration of interests C.T. is a scientific advisory board (SAB) member, consultant, and/or co-founder of Algen Biotechnologies, Altius Therapeutics, and Scale Biosciences. J.S. is an SAB member, consultant, and/or co-founder of Cajal Neuroscience, Guardant Health, Maze Therapeutics, Camp4 Therapeutics, Phase Genomics, Adaptive Biotechnologies, and Scale Biosciences.

Figures

Figure 1.
Figure 1.. Effects of stress on phenotypic variability is captured via individual animal hashing of single-cell transcriptomes.
(A), Representative images of 24 hpf embryos raised at standard and elevated temperature; individual embryos with normal-looking and bent-tail phenotypes were included in the dataset. (B), Experimental workflow for temperature perturbation experiment and individual embryo hashing. (C), UMAP of temperature-perturbation dataset, projected into coordinate space of reference atlas (see related manuscript, ). Right side shows how single cell data are transformed to generate cell composition matrices.
Figure 2.
Figure 2.. Staging embryos by cell type composition captures temperature-induced acceleration of development and allows isolation of temperature-dependent effects on cell abundance
(A), UMAP projection of embryo trajectory produced using all individual embryos from the developmental reference; each segment of the principal graph represents a 2-hour window of development, with key events noted. Right panel shows how, at each time point, embryos from elevated temperature are “ahead” of their 28°C counterparts on the embryo stage trajectory (median pseduostage for each temperature indicated with horizontal bars). (B), Scatterplot showing mean pseudostage values are correlated with expectations from a linear model of temperature-induced acceleration of developmental rate; error bars represent standard deviation. Result of linear regression is shown in black. (C), Scatterplot showing mean pseudostage values for all embryos in the reference dataset compared to a nearest-neighbor label transfer in transcriptome space; error bars on both axes represent standard deviation; both cell composition and transcriptomes contain ample information on developmental stage. (D), Heatmap showing the effects of temperature on mean cell type abundance relative to untreated, stage-matched controls (left) and on variability (CV relative to controls) of cell counts (right). Significant tests (q < 0.05) from beta binomial regression are indicated with a black box. Each column represents a pseudostage bin, wherein embryos from untreated and treated samples are stage-matched. (E), UMAP projection of all cell types, colored by relative abundance change in severe (bent) individuals raised at 34°C compared to normal-looking embryos also raised at 34°C.
Figure 3.
Figure 3.. Temperature introduces asynchrony in developmental rate across cell types.
(A), Dotplots showing the transcriptional ages of all cell types at 24 hpf, faceted by temperature. Cell types on the y-axis are ordered by their relative acceleration at 34°C, highlighting the most sensitive cell types near the top, and insensitive types near the bottom. Cell type ordering is the same for all temperatures; specific examples are indicated with labels. (B), Histogram showing distributions of relative cell type progression at each temperature, with vertical lines showing the relative progression expected for the whole embryo. (C), Barplot showing the effect sizes for expression levels of several cellular processes related to metabolism, protein folding, proliferation, and stress response in an additive model predicting relative progression of the cell type at high temperature. (D), Scatterplot showing basal levels of the unfolded protein response in each cell type against its relative progression, revealing a positive trend for both temperatures. (E), Density histogram showing increased variance in developmental stage for embryos raised at elevated temperature. (F), Heatmaps showing pairwise correlation coefficients of transcriptional age for all cell types in the embryo; at 28°C, most cell type pairs are positively correlated across individual embryos, whereas this correlation structure is diminished at elevated temperatures. (G), Density histogram of pairwise correlation values at each temperature, summarizing the loss in correlation structure seen in panel (F).
Figure 4.
Figure 4.. Exceptional regulation of the unfolded protein response underlies temperature sensitivity in the notochord.
(A), Scatterplot showing levels of translation signature and UPR signature across all embryo-cell types. Consistent with known translational attenuation by UPR, these processes are generally uncorrelated across cell types. The notochord (plotted as black dots) is an exception, with a positive correlation (Pearson’s r = 0.51) between these processes, and appreciable levels of both UPR and translation in a subset of embryos. (B), Circular barplot showing occurrence of translation + UPR co-expression, displayed as % double positive in each cell type (grey bars). Overlaid dots show raw % double positive cells for embryos raised at elevated temperature, colored pink and dark red for 32°C and 34°C, respectively. Orange bars show the relative change in the fraction of double positive cells in each cell type at elevated temperatures. For the large majority of cell types, this difference is negative. The notochord, hypochord, and pectoral fin bud are the sole exceptions, where double positive cells increase in response to temperature increase. (C), Marker gene plots showing expression of genes defining notochord sub-types (rab32a and cav3 in vacuolated cells; col8a1a in sheath cells; entpd5a in pre-mineralization sheath cells). (D), UMAP showing co-embedded notochord cells from reference and temperature perturbation experiment, colored according to the mean time point label of nearest neighbors in the reference. Annotations for each cell type are indicated. (E), UMAP showing sheath cells from temperature perturbation experiment with significant spatial bias using hotspot test (q < 0.05) in UMAP space (see Methods). Cells with a significant spatial base are shown in red. Inset shows levels of UPR markers and translation signature in these cells increasing with temperature.
Figure 5.
Figure 5.. Loss of Atf6 limits temperature-induced acceleration of developmental rate and increases temperature sensitivity of the notochord.
(A), Images of Alcian-blue stained notochords (camera image in black-and-white) in the tails of wild-type and atf6 crispant embryos raised at 28°C and 35°C. Examples of notochord defects in crispants raised at elevated temperature, kinks indicated with red arrows (phenylthiourea was used for imaging 28°C crispants). (B), Boxplots showing reduced capacity for acceleration of development at 34°C for the entire embryo (left) and notochord (right), while no developmental delay is apparent at 28°C. (C), Results of TEM of notochord sheath cells in atf6 crispants raised at elevated temperature, showing disrupted ER structure and aggregated collagen fibrils (red asterisks). Scale bar = 200nm; sc = sheath cell; s = sheath.

References

    1. Schirone RC, and Gross L (1968). Effect of temperature on early embryological development of the zebra fish,Brachydanio rerio. J. Exp. Zool. 169, 43–52.
    1. Sharpe PJ, and DeMichele DW (1977). Reaction kinetics of poikilotherm development. J. Theor. Biol. 64, 649–670. - PubMed
    1. Kuntz SG, and Eisen MB (2014). Drosophila embryogenesis scales uniformly across temperature in developmentally diverse species. PLoS Genet. 10, e1004293. - PMC - PubMed
    1. Gillooly JF, Charnov EL, West GB, Savage VM, and Brown JH (2002). Effects of size and temperature on developmental time. Nature 417, 70–73. - PubMed
    1. Rayon T, Stamataki D, Perez-Carrasco R, Garcia-Perez L, Barrington C, Melchionda M, Exelby K, Lazaro J, Tybulewicz VLJ, Fisher EMC, et al. (2020). Species-specific pace of development is associated with differences in protein stability. Science 369. 10.1126/science.aba7667. - DOI - PMC - PubMed

Publication types