. 2023 Dec 5;35(12):2200-2215.e9.
doi: 10.1016/j.cmet.2023.10.014. Epub 2023 Nov 9.

Stress-induced β cell early senescence confers protection against type 1 diabetes

Affiliations

Stress-induced β cell early senescence confers protection against type 1 diabetes

Hugo Lee et al. Cell Metab. .

Abstract

During the progression of type 1 diabetes (T1D), β cells are exposed to significant stress and, therefore, require adaptive responses to survive. The adaptive mechanisms that can preserve β cell function and survival in the face of autoimmunity remain unclear. Here, we show that the deletion of the unfolded protein response (UPR) genes Atf6α or Ire1α in β cells of non-obese diabetic (NOD) mice prior to insulitis generates a p21-driven early senescence phenotype and alters the β cell secretome that significantly enhances the leukemia inhibitory factor-mediated recruitment of M2 macrophages to islets. Consequently, M2 macrophages promote anti-inflammatory responses and immune surveillance that cause the resolution of islet inflammation, the removal of terminally senesced β cells, the reduction of β cell apoptosis, and protection against T1D. We further demonstrate that the p21-mediated early senescence signature is conserved in the residual β cells of T1D patients. Our findings reveal a previously unrecognized link between β cell UPR and senescence that, if leveraged, may represent a novel preventive strategy for T1D.

Keywords: ER stress; M2 macrophage; NOD mice; UPR; immune surveillance; secretome; senescence; type 1 diabetes; β cells.


Conflict of interest statement

Declaration of interests The authors declare no competing interests.

Figures
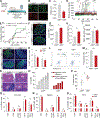
Figure 1.
Figure 1.. Atf6 deletion in NOD β-cells protects against T1D
(A) Schematic representation of Atf6 deletion. (B) Insulin and ATF6 co-staining in pancreatic sections from 4–5-week-old Atf6fl/fl and Atf6β−/− mice. (C) RT-qPCR of Atf6 in the islets of 6-week-old Atf6fl/fl and Atf6β−/− mice (n=3/group). (D and E) (D) Blood glucose measurements and (E) diabetes progression in mice. Blue line denotes 250 mg/dL. (F) Representative images of insulin, glucagon, and DAPI co-staining of pancreatic sections of 10-week-old Atf6fl/fl (n=8) and Atf6β−/− (n=5) mice. (G) Quantification of insulin RFI. (H) Serum insulin of 13-week-old mice (n=4–5/group). (I) Quantification of mean islet area (75–100 islets/animal). (J and K) (J) Representative images and (K) quantification of insulin, Ki67, and DAPI co-staining (n=5/group). (L and M) (L) Representative dot plots of Annexin V and PI co-staining of the islets from 19-weekold Atf6fl/fl (n=3) and Atf6β−/− (n=5) mice and (M) quantification of apoptotic cells. (N) Representative H&E images. (O and P) (O) Percent islet infiltration in 10-week-old Atf6fl/fl (n=6) and Atf6β−/− (n=5) mice and (P) percent intact islets. (Q-S) Immunophenotyping of (Q) pancreas, (R) spleen and (S) PLN of 12-week-old Atf6fl/fl (n=6) and Atf6β−/− (n=4) mice. Scale bars: 20μm. RFI, relative fluorescence intensity; w, weeks; ns, not significant; PLN, pancreatic lymph node. Data are represented as mean ± SEM. *p<0.05, **p<0.01. Unpaired, two-tailed t-tests ([C], [G]-[I], [K], [M], [P]-[S]) and Kaplan-Meier estimate [E].
Figure 2.
Figure 2.. Atf6β−/− and Ire1αβ−/− mice exhibit p21-mediated early senescence
(A-F) (A-C) Expression of genes in the p53/p21 signaling, antioxidant, and DDR pathways from RNA-seq of sorted β-cells from 6-week-old Atf6β−/− mice and (D-F) scRNA-seq of islets from 5week-old Ire1αβ−/− mice, compared to control mice. (G-J) Insulin, p21, and DAPI co-staining and quantification in pancreatic sections from (G and H) Atf6fl/fl, Atf6β−/− (n=6/time point), and Ins2CreERT/+ (n=3) mice, and (I and J) Ire1αfl/fl and Ire1αβ−/− mice (n=5/time point) at indicated time points. (K-N) Insulin, γ-H2AX, and DAPI co-staining and quantification in pancreatic sections from (K and L) Atf6fl/fl, Atf6β−/− (n=6/time point), and Ins2CreERT/+ (n=3) mice, and (M and N) Ire1αfl/fl and Ire1αβ−/− mice (n=5/time point) at indicated time points. (O) Representative histograms of DAPI staining. (P and Q) Cell cycle analysis of islet cells from 6-week-old (P) Atf6fl/fl and Atf6β−/− (n=5/group) mice and (Q) Ire1αfl/fl and Ire1αβ−/− mice (n=4/group). Scale bars: 20μm. FC, fold change; w, weeks; ns, not significant. Data are represented as mean ± SEM. **p<0.01, ***p<0.001, ****p<0.0001. Unpaired, two-tailed t-tests ([H], [J], [L], [N], [P], [Q]). FDR<0.05.
Figure 3.
Figure 3.. ATF6 and IRE1α/XBP1 differentially regulate p21
(A) Identification of CRE element at Cdkn1a promoter of human, mouse, and rat. (B-D) (B) Cdkn1a mRNA levels following 8 hours and (C and D) p21 protein levels following 16 hours in INS1 832/3 cells treated with 2μg/ml tunicamycin (Tun), 15μM Ceapin-A7 and 1μM CREB inhibitor (CREBi), 666–15. (E-G) (E) mRNA levels of canonical CREB targets and Cdkn1a, and (F and G) p21 protein levels in INS1 832/3 cells following 20μM forskolin treatment for 6 hours. (H) Model for regulation of Cdkn1a expression. (I and J) (I) Representative blot and (J) quantification of EMSA of Cdkn1a promoter oligo following incubation with nuclear extracts from transfected and treated INS1 832/3 cells as depicted. (K) pCREB ChIP-qPCR for Cdkn1a promoter in INS1 832/2 cells transfected with empty vector, CA-ATF6, or GFP and treated with 20μM forskolin for 6 hours (n=2 independent experiments). (L) Identification of UPRE element at Cdkn1a promoter of human, mouse, and rat. (M) Representative image of IP of sXBP1 in INS1 832/3 cells. (N and O) sXBP1 and IgG ChIP-qPCR for Cdkn1a promoter (n=2 independent experiments). Ns, not significant. Data are represented as mean ± SEM. *p<0.05, **p<0.01, ***p<0.001. Unpaired, two-tailed t-tests ([E], [G]) and one-way ANOVA followed by Tukey’s post-hoc pair-wise comparisons ([B], [D], [J]).
Figure 4.
Figure 4.. M2 macrophage recruitment to the islets of UPR-deficient mice
(A) Comparison of PASP genes using RNA-seq datasets from Atf6β−/−, Ire1αβ−/− mice, and a published gene set from MEF cells. (B) Correlation of PASP genes between Atf6β−/− and Ire1αβ−/− mice. (C and D) mRNA levels of macrophage attractants in (C) Atf6β−/− and (D) Ire1αβ−/− β-cells based on RNA-seq analysis. (E-H) (E and G) Representative images and (F and H) quantification of Arginase1, insulin, and DAPI co-staining in pancreatic sections from 5- and 10-week-old Atf6fl/fl (n=5) and Atf6β−/− (n=6) mice, and 5- and 12-week-old Ire1αfl/fl and Ire1αβ−/− mice (n=5/group). (I-L) Quantification of M1/M2 macrophages via flow cytometry in (I and K) PLN and (J and L) pancreas from 5-week-old Atf6fl/fl and Atf6β−/− (n=5/group) and Ire1αfl/fl and Ire1αβ−/− mice (n=4/group). (M and N) Quantification of Arginase1, insulin, and DAPI co-staining in pancreatic sections from 5-week-old (M) Atf6β−/− (n=5/group) and (N) Ire1αβ−/− mice (n=4/group) following shScramble or shCdkn1a transduction. (O) Quantification of migrated macrophages in the presence of CM from NIT1 cells that were incubated with α-LIF or control IgG. (P and Q) Quantification of Arginase1, insulin, and DAPI co-staining following LIF neutralization from 5-week-old (P) Atf6β−/− (n=5/group) and (Q) Ire1αβ−/− mice (n=3 for IgG, n=4 for α-LIF). (R and S) (R) Representative western blot image and (S) quantification of LIF expression in NIT1 cells. Scale bars: 20μm. CM, conditioned media; PLN, pancreatic lymph node; w, weeks; ns, not significant. Data are represented as mean ± SEM. *p<0.05, **p<0.01, ***p<0.001, ****p<0.0001. FDR<0.05. Unpaired, two-tailed t-tests ([F],[H-N],[P-Q]) and one-way ANOVA followed by Tukey’s post-hoc pair-wise comparisons ([O], [S]).
Figure 5.
Figure 5.. β-Cells of Atf6β−/− and Ire1αβ−/− mice exhibit significantly less terminal senescence
(A-C) Cell cycle analysis of islet cells from (A) 12- and (B) 16-week-old Atf6fl/fl and Atf6β−/− mice (n=3–4/group), and (C) 16-week-old Ire1αfl/fl (n=4) and Ire1αβ−/− (n=3) mice by flow cytometry. (D and E) (D) Representative histogram of C12FDG staining and (E) its quantification in islets from 5- and 20-week-old Atf6fl/fl and Atf6β−/− mice (n=5/group/time point). (F and G) (F) Representative histogram of C12FDG staining and (G) its quantification in islets from 20-week-old Ire1αfl/fl and Ire1αβ−/− mice (n=4/group). (H and I) (H) Representative histogram of cell size and (I) its quantification in islets from 5- and 20-week-old Atf6fl/fl and Atf6β−/− mice. (J and K) (J) Representative histogram of cell size and (K) its quantification in islets from 20-week-old Ire1αfl/fl and Ire1αβ−/− mice (n=4/group). C12FDG, 5-Dodecanoylaminofluorescein Di-β-D-Galactopyranoside; w, weeks; ns, not significant. Data are represented as mean ± SEM. *p<0.05, **p<0.01. Unpaired, two-tailed t-tests ([A], [B], [C], [E], [G], [I], [K]).
Figure 6.
Figure 6.. Early senescence signature of UPR-deficient mice is preserved in residual β-cells of T1D donors
(A and B) qPCR analysis of PASP gene expression in (A) EndoC-βH1 cells, following 2.5 μg/mL tunicamycin and 15μM Ceapin-A7 treatments for 72 hours, and (B) islets obtained from healthy donors following 0.25μg/ml tunicamycin, 15μM Ceapin-A7, and 50μM 4μ8C treatments for 72 hours (n=3 male donors). (C-F) Log expression analysis of (C) p53/p21 signaling pathway, (D) antioxidant response, (E) DDR, and (F) PASP genes in individuals with no-diabetes (ND) (n=5) and T1D (n=6). Expression is normalized read counts. ns, not significant. Data are represented as means ± SEM. *p<0.05, **p<0.01, ***p<0.001, ****p<0.0001. One-way ANOVA followed by Tukey’s post-hoc pair-wise comparisons ([A], [B]) and Wilcoxon–Mann–Whitney test ([C], [D], [E], [F]).

Comment in

References

    1. Harding HP, Zhang Y, Zeng H, Novoa I, Lu PD, Calfon M, Sadri N, Yun C, Popko B, Paules R, et al. (2003). An integrated stress response regulates amino acid metabolism and resistance to oxidative stress. Mol Cell 11, 619–633. 10.1016/s1097-2765(03)00105-9. - DOI - PubMed
    1. Bernales S, Papa FR, and Walter P (2006). Intracellular signaling by the unfolded protein response. Annu Rev Cell Dev Biol 22, 487–508. 10.1146/annurev.cellbio.21.122303.120200. - DOI - PubMed
    1. Walter P, and Ron D (2011). The unfolded protein response: from stress pathway to homeostatic regulation. Science 334, 1081–1086. 10.1126/science.1209038. - DOI - PubMed
    1. Engin F (2016). ER stress and development of type 1 diabetes. J Investig Med 64, 2–6. 10.1097/JIM.0000000000000229. - DOI - PMC - PubMed
    1. Eizirik DL, Pasquali L, and Cnop M (2020). Pancreatic beta-cells in type 1 and type 2 diabetes mellitus: different pathways to failure. Nat Rev Endocrinol 16, 349–362. 10.1038/s41574-020-0355-7. - DOI - PubMed

Publication types

Substances