. 2023 Dec;299(12):105441.
doi: 10.1016/j.jbc.2023.105441. Epub 2023 Nov 8.

Interaction between the mitochondrial adaptor MIRO and the motor adaptor TRAK

Affiliations

Interaction between the mitochondrial adaptor MIRO and the motor adaptor TRAK

Elana E Baltrusaitis et al. J Biol Chem. 2023 Dec.

Abstract

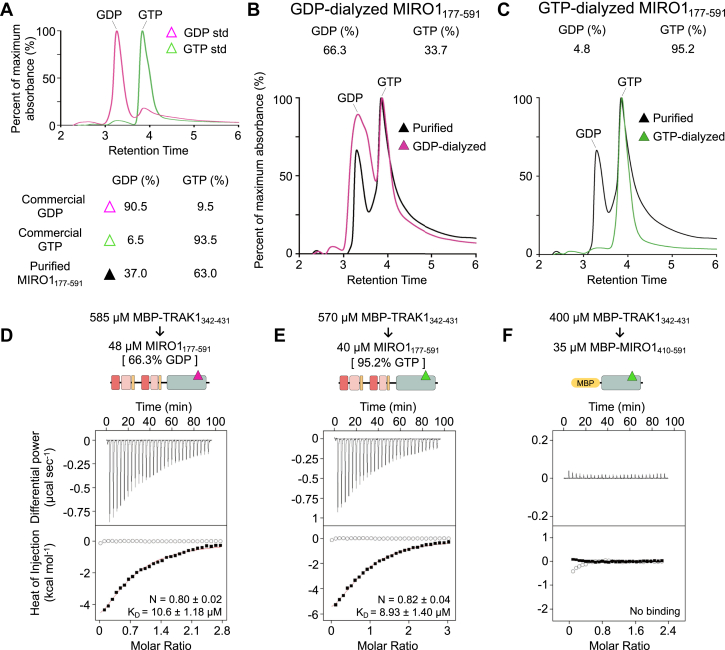
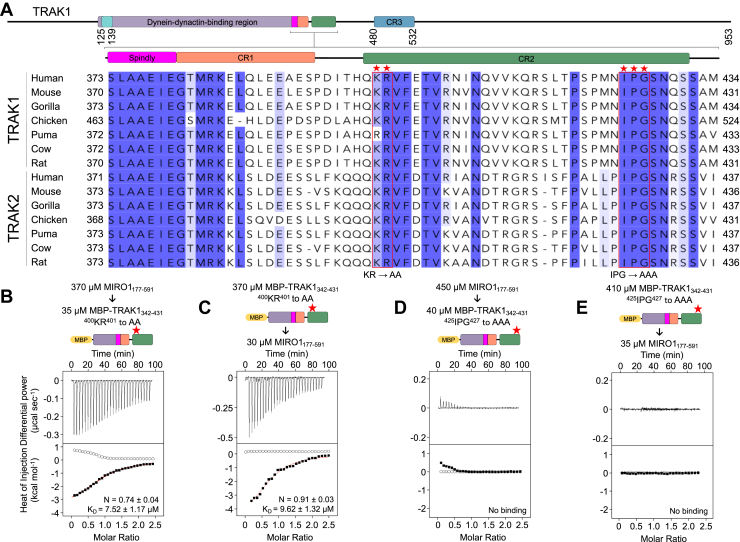
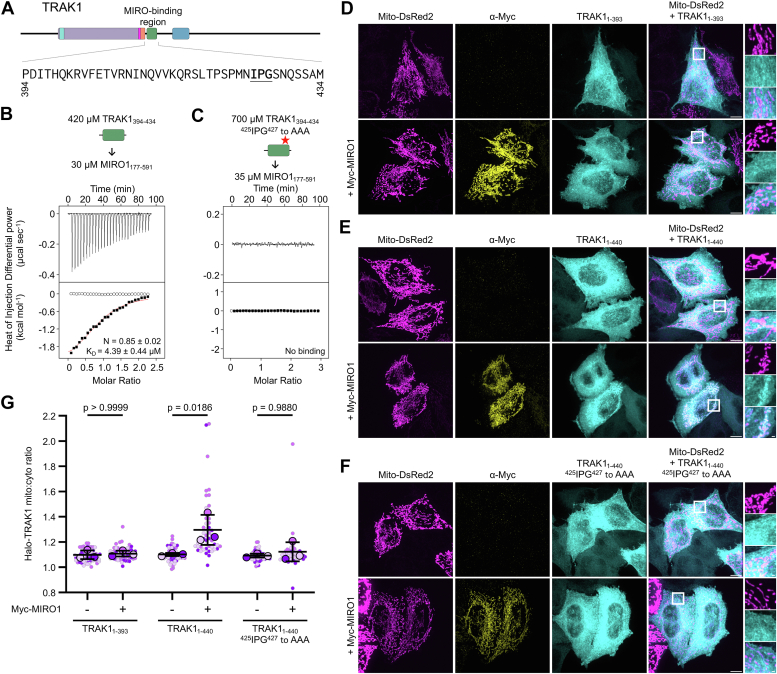
MIRO (mitochondrial Rho GTPase) consists of two GTPase domains flanking two Ca2+-binding EF-hand domains. A C-terminal transmembrane helix anchors MIRO to the outer mitochondrial membrane, where it functions as a general adaptor for the recruitment of cytoskeletal proteins that control mitochondrial dynamics. One protein recruited by MIRO is TRAK (trafficking kinesin-binding protein), which in turn recruits the microtubule-based motors kinesin-1 and dynein-dynactin. The mechanism by which MIRO interacts with TRAK is not well understood. Here, we map and quantitatively characterize the interaction of human MIRO1 and TRAK1 and test its potential regulation by Ca2+ and/or GTP binding. TRAK1 binds MIRO1 with low micromolar affinity. The interaction was mapped to a fragment comprising MIRO1's EF-hands and C-terminal GTPase domain and to a conserved sequence motif within TRAK1 residues 394 to 431, immediately C-terminal to the Spindly motif. This sequence is sufficient for MIRO1 binding in vitro and is necessary for MIRO1-dependent localization of TRAK1 to mitochondria in cells. MIRO1's EF-hands bind Ca2+ with dissociation constants (KD) of 3.9 μM and 300 nM. This suggests that under cellular conditions one EF-hand may be constitutively bound to Ca2+ whereas the other EF-hand binds Ca2+ in a regulated manner, depending on its local concentration. Yet, the MIRO1-TRAK1 interaction is independent of Ca2+ binding to the EF-hands and of the nucleotide state (GDP or GTP) of the C-terminal GTPase. The interaction is also independent of TRAK1 dimerization, such that a TRAK1 dimer can be expected to bind two MIRO1 molecules on the mitochondrial surface.

Keywords: EF-hand; GTPase; calcium; isothermal titration calorimetry (ITC); mitochondrial dynamics; motor adaptor; mutagenesis.


Conflict of interest statement

Conflict of interest The authors declare that they have no conflicts of interest with the contents of this article.

Figures

Figure 1
Figure 1
MIRO1 binds TRAK1 through a fragment comprising the EF-hands and cGTPase.A, domain diagrams of MIRO1 and TRAK1 (nGTPase and cGTPase, N- and C-terminal GTPase domains; ELM 1 and 2, EF-hand pair ligand mimic one and two; CC1 box, coiled-coil one box). Each ELM domain consists of a Ca2+-binding EF-hand (red), a hidden EF-hand that does not bind Ca2+ (pink), and a ligand mimic helix (orange). By analogy with other dynein-dynactin adaptors (21, 22), the dynein-dynactin-binding region of TRAK1 can be mapped to residues 118 to 392 (purple) and comprises the CC1 box (cyan) and the Spindly motif (magenta). The binding sites of kinesin-1 and MIRO1 have been approximately mapped to residues 1 to 360 (12, 14, 16, 17, 18) and 360 to 532 (17), respectively. BD, migration of MIRO11-591, MBP-MIRO11-180, MIRO1177-591 alone and together with TRAK199-532 in a 5 to 30% glycerol gradient. The figures show representative SDS-PAGE analyses of the fractions 4 to 17 (9–20% glycerol) containing these proteins. Densitometric analysis of the gels is shown at the bottom. For each fraction, the average TRAK1 signal (alone, green or with MIRO1 constructs, black) from N = 3 independent experiments (Fig. S2) is reported as the percentage of the average signal for the TRAK1 fraction with the maximum intensity. MBP, maltose-binding protein; MIRO, mitochondrial Rho GTPase; TRAK, trafficking kinesin-binding protein.
Figure 2
Figure 2
TRAK1 binds MIRO1 through a conserved sequence C-terminal of the Spindly motif. A, domain diagram (top), sequence conservation (bottom, gray bars), and coiled-coil prediction (bottom, maroon trace) of construct GCN4-TRAK1342-431 (also Fig. S1). Per-residue conservation scores were calculated with the program Scorecons (64) from an alignment of 183 vertebrate TRAK sequences, including 93 TRAK1 and 90 TRAK2 sequences. The coiled-coil prediction used a 28-amino acid window. Three conserved regions (CR1, CR2, and CR3) identified C terminally to the Spindly motif are highlighted. BD, representative ITC titrations of MIRO1177-591 into the indicated TRAK1 constructs from N = 3 independent experiments (Table S1). Prior to each titration, the proteins in the syringe (top) and in the cell (bottom) were codialyzed for 3 days in ITC buffer with 50 μM CaCl2. Listed with each titration are the concentrations of the protein in the syringe and in the cell and, for interacting proteins, the parameters of the fit (stoichiometry N and dissociation constant KD) to a binding isotherm (red line). Errors correspond to the SD of the fits. Open symbols correspond to control titrations into buffer. ITC, isothermal titration calorimetry; MIRO, mitochondrial Rho GTPase; TRAK, trafficking kinesin-binding protein.
Figure 3
Figure 3
The MIRO1-TRAK1 interaction is independent of Ca2+binding to the EF-hand domains. A and B, representative ITC titrations (see also Table S1) of 800 μM CaCl2 into MIRO1177-591. Prior to the titrations, MIRO1177-591 was dialyzed for 3 days in ITC buffer with either 5 μM CaCl2 (A) or 5 mM EGTA followed by stepwise removal of EGTA to a final concentration of 0.08 μM (B). The titrated CaCl2 was dissolved in the dialysis buffer. C and D, representative ITC titrations from N = 3 independent experiments (Table S1) of MIRO1177-591 into the indicated TRAK1 constructs. Proteins were dialyzed in ITC buffer with 5 mM EGTA. E and F, representative ITC titrations from N = 3 independent experiments (Table S1) of MBP-TRAK1342-431 into MIRO1177-591 mutants E208A (E) and E328A (F). Proteins were dialyzed in ITC buffer with 5 mM EGTA. Ribbon diagrams (left, color coded as in Figure 1A, Ca2+ ions in green) highlight the location of the mutated amino acid (cyan Cα) within the Ca2+-binding loop of each ELM domain (42). Shown with each ITC titration in this figure are the concentrations of the protein (or CaCl2) in the syringe and in the cell and the parameters of the fit (stoichiometry N and dissociation constant KD) to a binding isotherm (red line). Errors correspond to the SD of the fits. Open symbols correspond to control titrations into buffer. ITC, isothermal titration calorimetry; MBP, maltose-binding protein; MIRO, mitochondrial Rho GTPase; TRAK, trafficking kinesin-binding protein.
Figure 4
Figure 4
The MIRO1-TRAK1 interaction is independent of the nucleotide state of the cGTPase. A, HPLC analysis of analytical-grade commercial GDP (pink) and GTP (green) standards (top) and quantifications (bottom). The normalized maximum absorbance at 256 nm (y-axis) is plotted as a function of the retention time. B and C, HPLC analysis of E. coli-expressed MIRO1177-591 before (black trace) and after addition of 35-M excess of commercial nucleotide (GDP, pink trace; GTP, green trace) followed by 3-days dialysis into ITC buffer with 5 mM EGTA and no extra nucleotide added (bottom). Quantifications based on absorbance at 256 nm are shown above each graph and in part A (top). D–F, representative ITC titrations from N = 3 independent experiments (Table S1) of MBP-TRAK1342-431 into the nucleotide-exchanged MIRO1177-591 samples (GDP, part B and D; GTP, part C and E) or MIRO1410-591 (same buffer as in part C). Listed with each titration are the concentrations of the protein in the syringe and in the cell and the parameters of the fit (stoichiometry N and dissociation constant KD) to a binding isotherm (red line). Errors correspond to the SD of the fits. Open symbols correspond to control titrations into buffer. ITC, isothermal titration calorimetry; MBP, maltose-binding protein; MIRO, mitochondrial Rho GTPase; TRAK, trafficking kinesin-binding protein.
Figure 5
Figure 5
A conserved motif in TRAK1 mediates the interaction with MIRO1. A, subgroup of TRAK1/2 sequences extracted from an alignment of 183 TRAK sequences (Fig. S1) and showing residues 373 to 434, including the CR2 region that binds MIRO1 (Fig. 2, B and C). Amino acids conserved in >50% and >85% of the 183 sequences are highlighted light and dark blue, respectively. Stars highlight residues 400KR401 and 425IPG427 (boxed red) mutated to alanine. BE, representative ITC titrations of MIRO1177-591 into the MBP-TRAK1342-431 mutants (B and D) and inverted titrations (C and E) from N = 3 independent experiments (Table S1). Prior to each titration, the proteins in the syringe (top) and in the cell (bottom) were codialyzed for 3 days in ITC buffer with 5 mM EGTA. Listed with each titration are the concentrations of the protein in the syringe and in the cell and the parameters of the fit (stoichiometry N and dissociation constant KD) to a binding isotherm (red line). Errors correspond to the SD of the fits. Open symbols correspond to control titrations into buffer. ITC, isothermal titration calorimetry; MBP, maltose-binding protein; MIRO, mitochondrial Rho GTPase; TRAK, trafficking kinesin-binding protein.
Figure 6
Figure 6
The CR2 region of TRAK1 is sufficient to bind MIRO1 in vitro and in cells. A, schematic and sequence representation of the MIRO1-binding region of TRAK1. B and C, representative ITC titrations of TRAK1394-434 into MIRO1177-591 WT (B) and mutant 425IPG427 to AAA (C) from N = 3 independent experiments (Table S1). Proteins were dialyzed in ITC buffer with 5 mM EGTA and 0.1 μM GTP. Proteins were dialyzed in ITC buffer with 50 μM GTP (F). Listed with each titration are the concentrations of the protein in the syringe and in the cell and, for interacting proteins, the parameters of the fit (stoichiometry N and dissociation constant KD) to a binding isotherm (red line). Errors correspond to the SD of the fits. Open symbols correspond to control titrations into buffer. D–F, representative maximum-intensity projections of Halo-TRAK11-393 (D), Halo-TRAK11-440 (E) or Halo-TRAK11-440425IPG427 to AAA (F) and Mito-DsRed2 in HeLa cells, with or without Myc-MIRO1 coexpression. G, ratio of mitochondrial to cytoplasmic intensity for Halo-TRAK1 constructs, with or without Myc-MIRO1 coexpression. Data points are color-coded by experimental replicate, with smaller points representing individual cells. N = 3 independent experiments, with 48 to 63 cells per condition. The center line and bars represent the mean ± SD from independent experiments. p-values from one-way ANOVA with the Tukey’s multiple comparisons test are shown. The scale bars represent 10 μm (D–F), 1 μm (D–F insets). ITC, isothermal titration calorimetry; MIRO, mitochondrial Rho GTPase; TRAK, trafficking kinesin-binding protein.
Figure 7
Figure 7
Two MIRO1 molecules bind one TRAK1 dimer on the mitochondrial surface. One TRAK1 dimer binds to two MIRO1 molecules on the mitochondrial surface, independent of Ca2+-binding to the EF-hands or the cGTPase nucleotide state of MIRO1. The interaction is mediated by a conserved motif C terminal to the Spindly motif of TRAK1 and directly implicates MIRO1’s EF-hands. MIRO, mitochondrial Rho GTPase; TRAK, trafficking kinesin-binding protein.

References

    1. Fransson A., Ruusala A., Aspenstrom P. Atypical Rho GTPases have roles in mitochondrial homeostasis and apoptosis. J. Biol. Chem. 2003;278:6495–6502. - PubMed
    1. Fransson S., Ruusala A., Aspenstrom P. The atypical Rho GTPases Miro-1 and Miro-2 have essential roles in mitochondrial trafficking. Biochem. Biophys. Res. Commun. 2006;344:500–510. - PubMed
    1. Weihofen A., Thomas K.J., Ostaszewski B.L., Cookson M.R., Selkoe D.J. Pink1 forms a multiprotein complex with Miro and Milton, linking Pink1 function to mitochondrial trafficking. Biochemistry. 2009;48:2045–2052. - PMC - PubMed
    1. Saotome M., Safiulina D., Szabadkai G., Das S., Fransson A., Aspenstrom P., et al. Bidirectional Ca2+-dependent control of mitochondrial dynamics by the Miro GTPase. Proc. Natl. Acad. Sci. U. S. A. 2008;105:20728–20733. - PMC - PubMed
    1. Birsa N., Norkett R., Higgs N., Lopez-Domenech G., Kittler J.T. Mitochondrial trafficking in neurons and the role of the Miro family of GTPase proteins. Biochem. Soc. Trans. 2013;41:1525–1531. - PubMed

Publication types

MeSH terms

LinkOut - more resources