

Age related changes in hyaluronan expression leads to Meibomian gland dysfunction
- PMID: 37949327
- PMCID: PMC11095397
- DOI: 10.1016/j.matbio.2023.11.002
Age related changes in hyaluronan expression leads to Meibomian gland dysfunction
Abstract
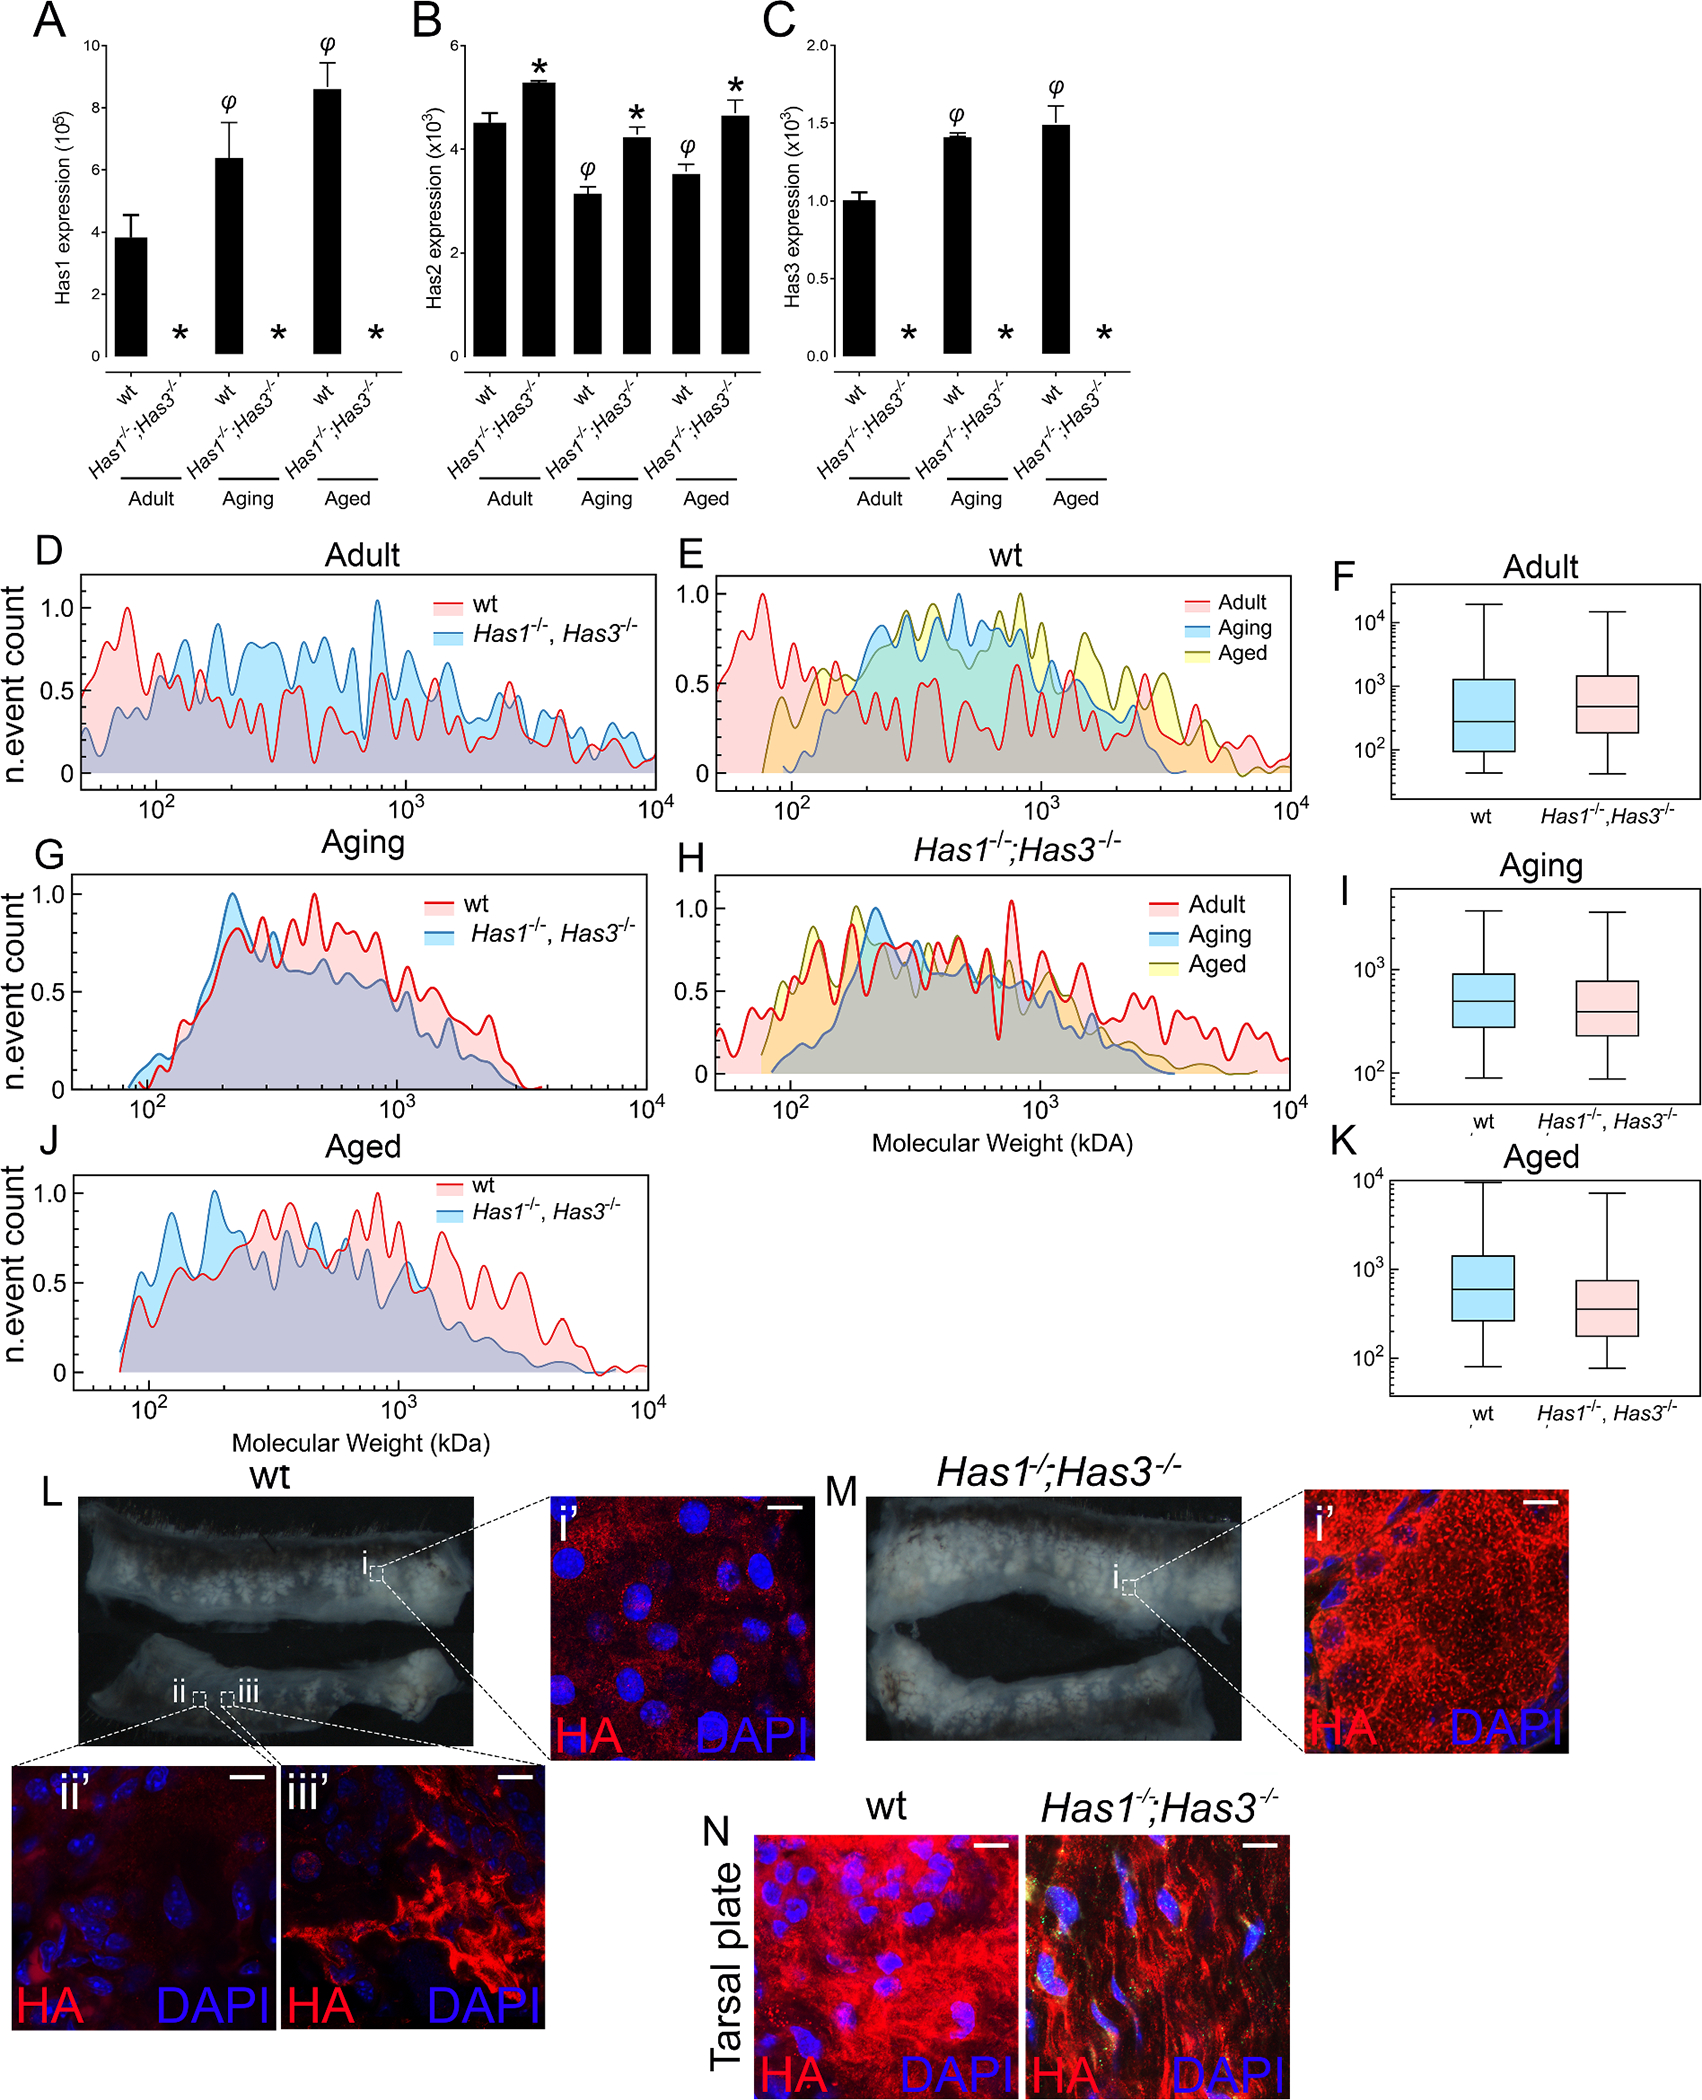
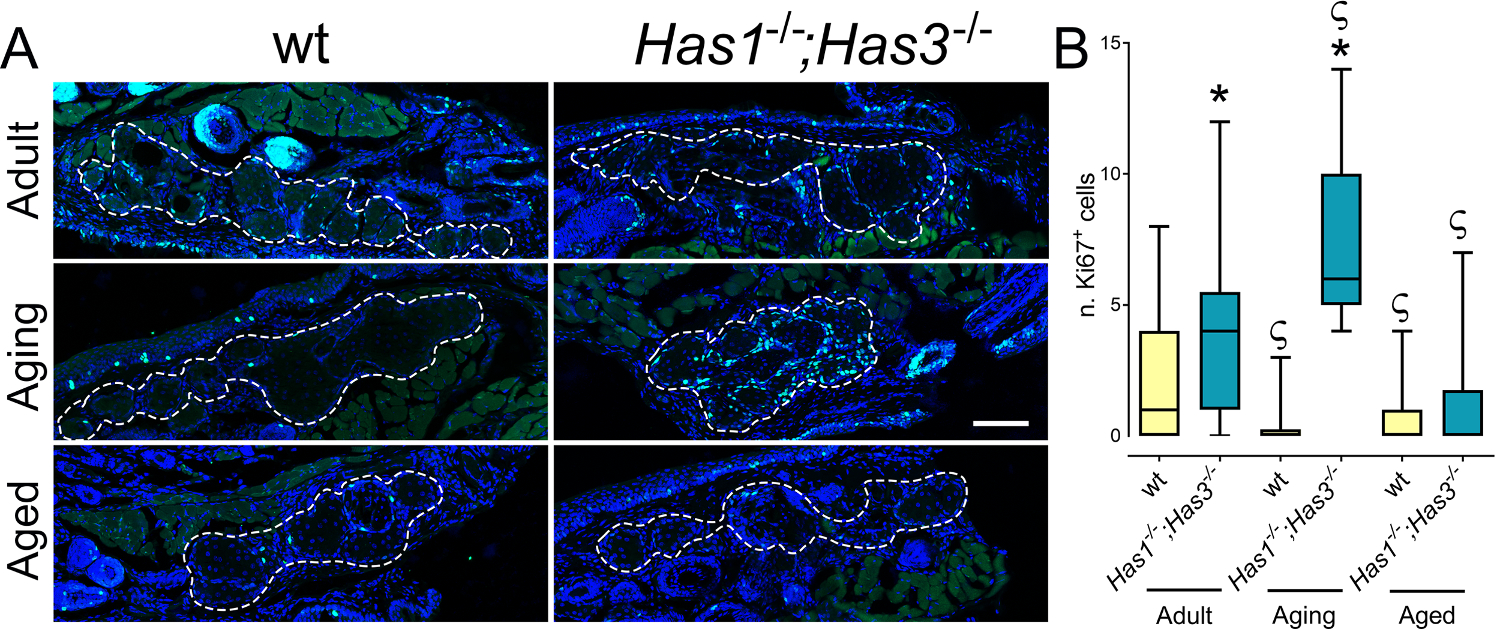
The prevalence of dry eye disease (DED) ranges from ∼5 to 50 % and its associated symptoms decrease productivity and reduce the quality of life. Approximately 85 % of all DED cases are caused by Meibomian gland dysfunction (MGD). As humans and mice age, their Meibomian glands (MGs) undergo age-related changes resulting in age related-MGD (ARMGD). The precise cause of ARMGD remains elusive, which makes developing therapies extremely challenging. We previously demonstrated that a hyaluronan (HA)-rich matrix exists surrounding the MG, regulating MG morphogenesis and homeostasis. Herein, we investigated whether changes to the HA matrix in the MG throughout life contributes towards ARMGD, and whether altering this HA matrix can prevent ARMGD. For such, HA synthase (Has) knockout mice were aged and compared to age matched wild type (wt) mice. MG morphology, lipid production, PPARγ expression, basal cell proliferation, stem cells, presence of atrophic glands and MG dropout were analyzed at 8 weeks, 6 months, 1 year and 2 years of age and correlated with the composition of the HA matrix. We found that as mice age, there is a loss of HA expression in and surrounding the MGs of wt mice, while, in contrast, Has1-/-Has3-/- mice present a significant increase in HA expression through Has2 upregulation. At 1 year, Has1-/-Has3-/- mice present significantly enlarged MGs, compared to age-matched wt mice and compared to all adult mice. Thus, Has1-/-Has3-/- mice continue to develop new glandular tissue as they age, instead of suffering MG atrophy. At 2 years, Has1-/-Has3-/- mice continue to present significantly larger MGs compared to age-matched wt mice. Has1-/-Has3-/- mice present increased lipid production, increased PPARγ expression and an increase in the number of proliferating cells when compared to wt mice at all-time points analyzed. Taken together, our data shows that a loss of the HA matrix surrounding the MG as mice age contributes towards ARMGD, and increasing Has2 expression, and consequently HA levels, prevents ARMGD in mice.
Keywords: Aging; Hyaluronan; Meibomian gland; Ocular surface; Stem cells.
Copyright © 2023 Elsevier B.V. All rights reserved.
Conflict of interest statement
Declaration of Competing Interest None.
Figures


Similar articles
-
Comparative Analysis of Age-Associated Changes in Meibum Composition, Distribution, and Function in Mice With Altered Hyaluronan Expression.Invest Ophthalmol Vis Sci. 2025 Jul 1;66(9):72. doi: 10.1167/iovs.66.9.72. Invest Ophthalmol Vis Sci. 2025. PMID: 40736174 Free PMC article.
-
Recent advances in age-related meibomian gland dysfunction (ARMGD).Ocul Surf. 2023 Oct;30:298-306. doi: 10.1016/j.jtos.2023.11.003. Epub 2023 Nov 17. Ocul Surf. 2023. PMID: 37979775 Free PMC article. Review.
-
Loss of hyaluronan synthases impacts bone morphology, quality, and mechanical properties.Bone. 2023 Jul;172:116779. doi: 10.1016/j.bone.2023.116779. Epub 2023 Apr 24. Bone. 2023. PMID: 37100359
-
Hyaluronan Rich Microenvironment in the Limbal Stem Cell Niche Regulates Limbal Stem Cell Differentiation.Invest Ophthalmol Vis Sci. 2017 Sep 1;58(11):4407-4421. doi: 10.1167/iovs.17-22326. Invest Ophthalmol Vis Sci. 2017. PMID: 28863216 Free PMC article.
-
Hyaluronan and hyaluronan synthases: potential therapeutic targets in cancer.Curr Drug Targets Cardiovasc Haematol Disord. 2005 Feb;5(1):3-14. doi: 10.2174/1568006053005056. Curr Drug Targets Cardiovasc Haematol Disord. 2005. PMID: 15720220 Review.
Cited by
-
Age-Related Differences in the Mouse Corneal Epithelial Transcriptome and Their Impact on Corneal Wound Healing.Invest Ophthalmol Vis Sci. 2024 May 1;65(5):21. doi: 10.1167/iovs.65.5.21. Invest Ophthalmol Vis Sci. 2024. PMID: 38739085 Free PMC article.
-
Meibomian gland atrophy in children with allergic conjunctivitis.Int J Ophthalmol. 2025 May 18;18(5):832-839. doi: 10.18240/ijo.2025.05.07. eCollection 2025. Int J Ophthalmol. 2025. PMID: 40385119 Free PMC article.
-
Applied anatomy and morphology of Meibomian glands in the non-human primate.Sci Rep. 2025 Jul 1;15(1):20749. doi: 10.1038/s41598-025-05452-9. Sci Rep. 2025. PMID: 40596124 Free PMC article.
-
Safety of lifitegrast: A real-world pharmacovigilance study based on FAERS.PLoS One. 2025 Apr 24;20(4):e0321307. doi: 10.1371/journal.pone.0321307. eCollection 2025. PLoS One. 2025. PMID: 40273175 Free PMC article.
-
Comparative Analysis of Age-Associated Changes in Meibum Composition, Distribution, and Function in Mice With Altered Hyaluronan Expression.Invest Ophthalmol Vis Sci. 2025 Jul 1;66(9):72. doi: 10.1167/iovs.66.9.72. Invest Ophthalmol Vis Sci. 2025. PMID: 40736174 Free PMC article.
References
-
- Knop E, Knop N, Millar T, Obata H, Sullivan DA, The international workshop on meibomian gland dysfunction: report of the subcommittee on anatomy, physiology, and PATHOPHYSIOLOGY of the meibomian gland, Invest. Ophthalmol. Vis. Sci. 52 (4) (2011) 1938–1978, 10.1167/iovs.10-6997c. Mar. - DOI - PMC - PubMed
-
- Schaumberg DA, Nichols JJ, Papas EB, Tong L, Uchino M, Nichols KK, The international workshop on meibomian gland dysfunction: report of the subcommittee on the epidemiology of, and associated risk factors for, MGD, Invest. Ophthalmol. Vis. Sci. 52 (4) (2011) 1994–2005, 10.1167/IOVS.10-6997E. Mar. - DOI - PMC - PubMed
MeSH terms
Substances
Grants and funding
LinkOut - more resources
Full Text Sources
Research Materials
