. 2023 Nov 10;7(2):e202302051.
doi: 10.26508/lsa.202302051. Print 2024 Feb.

Visualization of conformational transition of GRP94 in solution

Affiliations

Visualization of conformational transition of GRP94 in solution

Shangwu Sun et al. Life Sci Alliance. .

Abstract

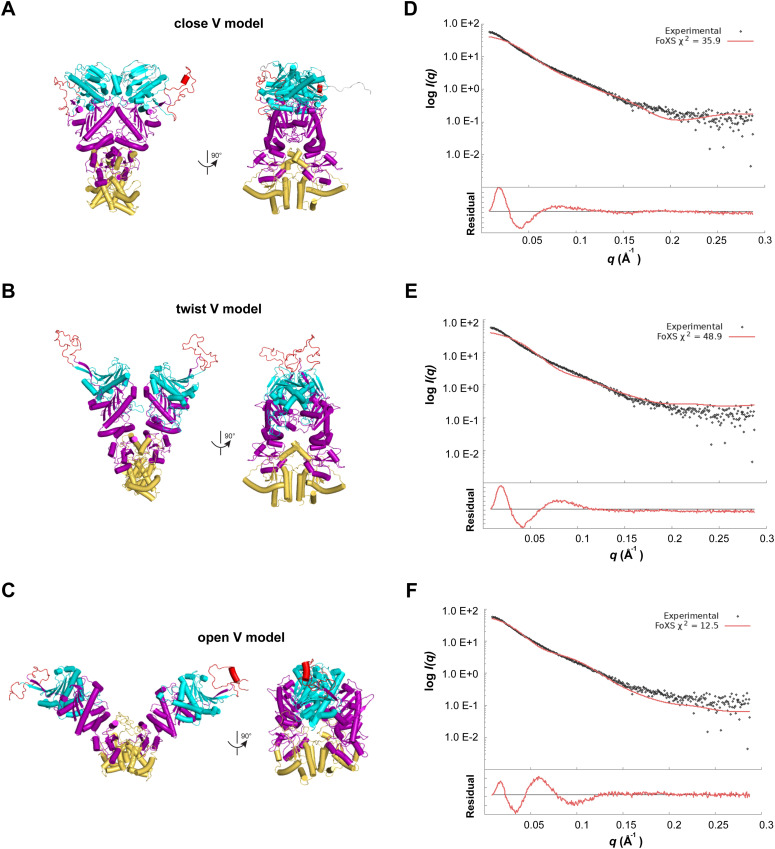
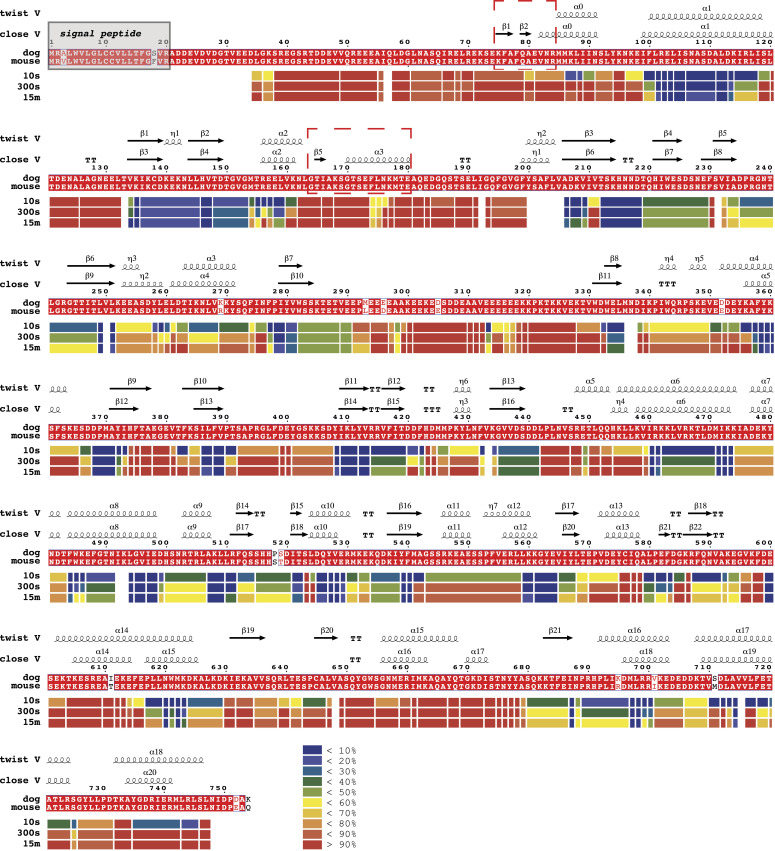
GRP94, an ER paralog of the heat-shock protein 90 family, binds and hydrolyses ATP to chaperone the folding and maturation of its selected clients. Compared with other hsp90 proteins, the in-solution conformational dynamics of GRP94 along the ATP hydrolysis cycle are less understood, hindering our understanding of its chaperoning mechanism. Leveraging small-angle X-ray scattering, negative-staining EM, and hydrogen-deuterium exchange coupled mass-spec, here we show that in its apo form, ∼60% of mouse GRP94 (mGRP94) populates an "extended" conformation, whereas the rest exist in either "close V" or "twist V" like "compact" conformations. Different from other hsp90 proteins, the presence of AMPPNP only impacts the relative abundance of the two compact conformations, rather than shifting the equilibrium between the "extended" and "compact" conformations of mGRP94. HDX-MS study of apo, AMPPNP-bound, and ADP-bound mGRP94 suggests a conformational transition from "twist V" to "close V" upon ATP binding and a back transition from "close V" to "twist V" upon ATP hydrolysis. These results illustrate the dissimilarities of GRP94 in conformation transition during ATP hydrolysis from other hsp90 paralogs.


Conflict of interest statement

The authors declare that they have no conflict of interest.

Figures

Figure S1.
Figure S1.. The inline SEC-SAXS profiles of mGRP94 in different states.
(A) Schematic diagram illustrating the construct of mGRP94 (22–754 aa) with the Pre-N and charged linker regions preserved. Pre-N, pre-N terminal domain; NTD, N-terminal domain; MD, middle domain; CTD, C-terminal domain. (B) Gel filtration profiles of purified mGRP94. Shown in the inset are the SDS–PAGE results of indicated peak fractions. (C) ATPase activity of purified mGRP94 presented as Michaelis–Menten plot. Experiments were independently performed three times and error bars depict the standard error of the mean. (D, E, F) The inline SEC-SAXS profiles of mGRP94 in the absence of nucleotides (D) and in the presence of AMPPNP (E) or ADP (F). The Rgs of the samples are also shown.
Figure 1.
Figure 1.. Apo mGRP94 samples extended conformation in solution.
(A) I(q) versus q as log-linear plots, the inset shows the Guinier fits (yellow lines) for determination of Rg. The red squares indicate data within the Guinier region with qRg < 1.3. (A, B) Dimensionless Kratky plots calculated from the scattering data in (A). (C) Normalized P(r) curves simulated from the structural models of mGRP94 in “open V” (grey), “close V” (cyan) or “twist V” (yellow) conformation are compared with the normalized experimental P(r) of mGRP94 in apo form (red). Neither of the structural models matches the experimental SAXS data of mGRP94 in apo form. The P(r) curves are normalized to equal areas.
Figure S2.
Figure S2.. Comparison of theoretical and experimental scattering curves and residuals of the fit.
(A, B, C) Cartoon representations of the mGRP94 “close V,” “twist V,” and “open V” models, with the pre-N (grey), N-terminal (cyan), charged linker (red), middle (purple), and C-terminal (orange) domains color-coded as in Fig S1A. (D, E, F) Theoretical scattering curves (red lines) of mGRP94 “close V” (D), “twist V” (E), and “open V” (F) models are overlayed with the experimental scattering data of the apo mGRP94 sample (gray dots). Residuals of the fit are shown at the bottom. Theoretical scattering curves are generated by FOXS (Schneidman-Duhovny et al, 2013).
Figure 2.
Figure 2.. “Extended” and “Compact” conformations of apo mGRP94 coexist in solution.
(A) Ensemble modeling results for apo mGRP4. (B) The fitting (blue line) of the OLIGOMER-picked models (inset) to the experimental profiles (red squares) is shown. Note that the models were rendered at 30 Å because the fit to the experimental SAXS data is good up to q = 0.05 Å−1, suggesting that the models are reliable up to a resolution level at about 20 Å.
Figure 3.
Figure 3.. nsEM visualization of apo mGRP94 indicates the coexistence of “extended open,” “compact twist,” and “compact closed” conformations.
(A, B, C) The nsEM reconstructions of apo mGRP94 unravel the coexistence of three different conformations. The nsEM reconstructions were shown in different views (top). To examine the correspondence between nsEM raw images and the final reconstructions, reference-free averages were compared with representative 2D projections of the final reconstructions at different angles. The number of particles included in each average is shown.
Figure S3.
Figure S3.. Relative abundancy and model fitting of nsEM reference-free 3D classes.
(A) The frequency distributions of the three different conformations. (B, C) The class 2 and class 3 of nsEM reference-free 3D classes could fit well by the “close V” (B) and “twist V” (C)-like mGRP94 models.
Figure S4.
Figure S4.. The binding of AMPPNP did not change the relative abundance of extended and compact conformations of mGRP94.
(A) Normalized experimental P(r) curve of AMPPNP-bound mGRP94 (green) and ADP-bound mGRP94 (blue) are compared with that of apo mGRP94 (red). The P(r) curves are normalized to equal areas. Note that the presence of nucleotides caused barely noticeable shift in the P(r) profiles of mGRP94. (B) The fitting (blue line) of the OLIGOMER-picked models (inset) to the experimental profiles of AMPPNP-bound mGRP94 (green squares) is shown.
Figure 4.
Figure 4.. In-solution conformational dynamics of apo mGRP94 as revealed by HDX.
The HDX profile of apo mGRP94 at different time points is presented as a heatmap under the aligned sequence of mGRP94 and dGRP94 (sequence identity: 97%). The inset shows the color coding for different percentages of deuteron incorporation. Above the alignments, secondary structural elements of dGRP94 in “compact twist V” and “compact close V” structures are shown. Note that the regions in mGRP94 that manifest low HDX rate generally match dGRP94 regions that adopt α-helix or β-sheet conformation in both structures, whereas the regions in mGRP94 that exhibit high HDX rate usually corresponds to dGRP94 regions that are consistently flexible in both structures. Notably, 75–84 aa and 165–180 aa (red boxes) adopt a folded conformation in a “compact close V” structure yet appear disordered in a “compact twist V” structure, and thus are chosen as “indicative regions” to signal the conformational transitions of mGRP94 between the two structures.
Figure 5.
Figure 5.. The conformational transition of mGRP94 in the presence of AMPPNP or ADP as captured by HDX-MS.
(A) Deuteron incorporation at 10 s for apo mGRP94 was mapped onto one protomer of the “twist V” and “close V” models, respectively, the other protomers in these models were colored grey and rendered transparent for clarity. The inset shows the color coding for different percentages of deuteron incorporation. The black arrows and the orange boxes indicate the position of the indicative regions in different models. The purple arrows indicate the positions of 86–93 aa (purple boxes) in different models. The conformations of the indicative regions and 86–93 aa in different models are also labeled. (B, C) The deuterium uptake data of each indicated peptide is plotted as percent deuterium uptake versus time on a logarithmic scale. (B, C) Binding of AMPPNP (compare green lines with red lines) induced obvious HDX protection in “indicative regions” (B) and regions encompassing 86–93 aa (C), although with different kinetics. In “indicative regions,” the HDX protection effect appears as early as 10 s, whereas in regions ranging from 86–93 aa, the HDX protection effect is prominent at 300 s. In the presence of ADP (blue lines), the HDX of 86–93 aa is close to that in the apo state (red lines), whereas the HDX of indicative regions is faster than that in the AMPPNP-bound state (green lines), but still slower than that in the apo state (red lines). The P-values were given by t test, comparing the #D of the same peptide in AMPPNP or ADP state against the apo state. ****P < 0.0001, ***P < 0.001, **P < 0.01, and *P < 0.05.
Figure S5.
Figure S5.. The HDX-MS peptide coverage map for mGRP94.
Green lines above the protein sequence represent the digested peptides that were identified and analyzed in this study.
Figure S6.
Figure S6.. Mass spectra of peptides showing HDX protection in the presence of AMPPNP and ADP.
(A) Deuteron incorporation at 10 s for apo mGRP94, mapped onto one protomer of the “open V,” “twist V,” and “close V” models, respectively, the other protomers in these models were colored grey and rendered transparent for clarity. The inset shows the color coding for different percentages of deuteron incorporation. The arrows indicate the position of the indicative regions in different models. (B, C) Mass spectra of indicated peptides from mGRP94 in different nucleotide-bound states are compared with each other in parallel (second to fourth panel), with the mass spectra of undeuterated and fully-deuterated samples shown as controls at the top and bottom panels. (B, C) Mass spectra of all identified peptides from the “indicative regions” (B) and mass spectra of peptides from the regions ranging 86–93 aa (C) are shown.

References

    1. Ali MM, Roe SM, Vaughan CK, Meyer P, Panaretou B, Piper PW, Prodromou C, Pearl LH (2006) Crystal structure of an hsp90-nucleotide-p23/sba1 closed chaperone complex. Nature 440: 1013–1017. 10.1038/nature04716 - DOI - PMC - PubMed
    1. Ansa-Addo EA, Thaxton J, Hong F, Wu BX, Zhang Y, Fugle CW, Metelli A, Riesenberg B, Williams K, Gewirth DT, et al. (2016) Clients and oncogenic roles of molecular chaperone gp96/grp94. Curr Top Med Chem 16: 2765–2778. 10.2174/1568026616666160413141613 - DOI - PMC - PubMed
    1. Bradshaw RT, Marinelli F, Faraldo-Gómez JD, Forrest LR (2020) Interpretation of hdx data by maximum-entropy reweighting of simulated structural ensembles. Biophys J 118: 1649–1664. 10.1016/j.bpj.2020.02.005 - DOI - PMC - PubMed
    1. Bron P, Giudice E, Rolland JP, Buey RM, Barbier P, Díaz JF, Peyrot V, Thomas D, Garnier C (2008) Apo-hsp90 coexists in two open conformational states in solution. Biol Cell 100: 413–425. 10.1042/BC20070149 - DOI - PubMed
    1. Burger VM, Arenas DJ, Stultz CM (2016) A structure-free method for quantifying conformational flexibility in proteins. Sci Rep 6: 29040. 10.1038/srep29040 - DOI - PMC - PubMed

Publication types

LinkOut - more resources