. 2023 Dec;10(36):e2303913.
doi: 10.1002/advs.202303913. Epub 2023 Nov 10.

Single-Cell Analysis Reveals Malignant Cells Reshape the Cellular Landscape and Foster an Immunosuppressive Microenvironment of Extranodal NK/T-Cell Lymphoma

Affiliations

Single-Cell Analysis Reveals Malignant Cells Reshape the Cellular Landscape and Foster an Immunosuppressive Microenvironment of Extranodal NK/T-Cell Lymphoma

Yi-Qi Li et al. Adv Sci (Weinh). 2023 Dec.

Abstract

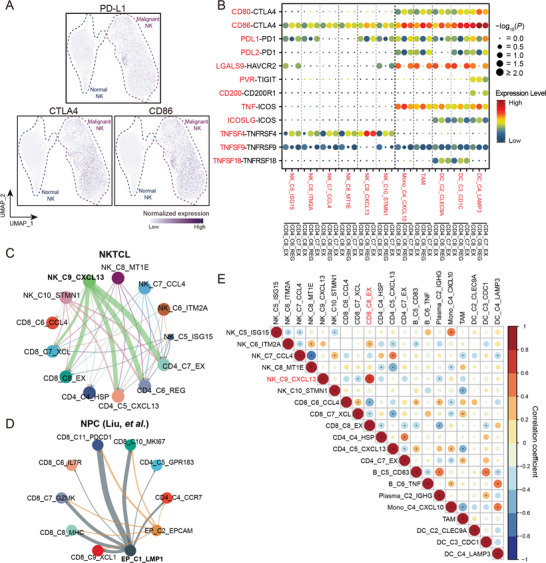
Extranodal natural killer/T-cell lymphoma (NKTCL) is an aggressive type of lymphoma associated with Epstein-Barr virus (EBV) and characterized by heterogeneous tumor behaviors. To better understand the origins of the heterogeneity, this study utilizes single-cell RNA sequencing (scRNA-seq) analysis to profile the tumor microenvironment (TME) of NKTCL at the single-cell level. Together with in vitro and in vivo models, the study identifies a subset of LMP1+ malignant NK cells contributing to the tumorigenesis and development of heterogeneous malignant cells in NKTCL. Furthermore, malignant NK cells interact with various immunocytes via chemokines and their receptors, secrete substantial DPP4 that impairs the chemotaxis of immunocytes and regulates their infiltration. They also exhibit an immunosuppressive effect on T cells, which is further boosted by LMP1. Moreover, high transcription of EBV-encoded genes and low infiltration of tumor-associated macrophages (TAMs) are favorable prognostic indicators for NKTCL in multiple patient cohorts. This study for the first time deciphers the heterogeneous composition of NKTCL TME at single-cell resolution, highlighting the crucial role of malignant NK cells with EBV-encoded LMP1 in reshaping the cellular landscape and fostering an immunosuppressive microenvironment. These findings provide insights into understanding the pathogenic mechanisms of NKTCL and developing novel therapeutic strategies against NKTCL.

Keywords: DPP4; LMP1+ malignant NK cells; NKTCL; immunosuppression; scRNA-seq.


Conflict of interest statement

The authors declare no conflict of interests.

Figures

Figure 1
Figure 1
Landscape profiling of NKTCL TME at single‐cell resolution. A) An overview of the study design. Single viable cells from matched tumor and peripheral blood samples were collected using fluorescence‐activated cell sorting (FACS) and subjected for cell barcoding. The cDNA libraries of 5′‐mRNA expression were constructed, followed by high throughput sequencing, downstream data analyses, and functional validations of key findings. B) UMAP plot showing a total of 137 304 cells clustered into six major cell types. Each dot represents a cell, colored according to its cell type as indicated at the right panel. The inlet plot shows the tissue distribution of cells colored according to their origins from either peripheral blood or tumor. C) Expression of canonical marker genes to define the major cell type on top. Each dot represents a cell, and the depth of color from light grey to deep purple represents low to high expression of marker genes. D) UMAP plots showing the subclusters of NK, T, B, and myeloid cells. Each dot represents a cell, colored according to its cell subtype. E) Diagrams showing basic information of each subcluster for NK, T, B, and myeloid cells (panels from top to bottom): the proportions of cells derived from ten patients with corresponding colors indicated at the bottom, the proportions of cells from either peripheral blood (cyan) or tumor (dark red), the numbers of cells, and the box plots of the numbers of UMIs. For box plots, center lines and whiskers denote median values and 1.5× the interquartile range, respectively.
Figure 2
Figure 2
The pivotal role of LMP1+ NK_C9_CXCL13 cells in oncogenic activation and development of NKTCL. A) UMAP plot showing 43713 NK cells grouped into ten clusters, including four normal clusters and six malignant clusters. Each dot represents a cell, colored according to its cell cluster as indicated at the right panel. B) Multiplex IF staining for NK_C9_CXCL13 malignant NK cells (CXCL13+LMP1+) in NKTCL biopsies from the SC‐cohort. CXCL13 and LMP1 proteins as well as nuclear DNA are detected with different colors as indicated on top. Images are representative of biological replicates from three patients. C) Heatmap showing the expression levels of selected genes (rows) for each NK cell cluster (columns). NK clusters of either normal (blue) or malignant NK (purple) are indicated as rectangles on top. Filled colors from blue to red in the squares represent normalized expression levels from low to high as scaled in row direction (row Z‐score). D) Experimental design for the in vivo blockade of LMP1 in BALB/c nude mice. For lentivirus‐mediated LMP1 knockdown (top panel), NKTCL mouse models were established with tumor initiation of NKTCL cells (YT) infected with sh‐LMP1 or control lentiviruses. For adeno‐associated virus (AAV)‐mediated LMP1 knockdown (bottom panel), NKTCL mouse models were established with tumor initiation of wild‐type YT cells, and intratumor injection of AAV‐expressing sh‐LMP1 or corresponding control was performed when the xenografts had grown to a certain volume. E) Tumor growth of xenografts derived from YT cells infected with lentivirus‐expressing shRNAs targeting LMP1 (sh‐LMP1‐1/‐2) or scrambled (sh‐Luci) at different time courses (day), with the tumor size (F) left panel) and tumor weight (F) right panel) for the excised xenografts. G) Multiplex IF staining assays (top panel) for the protein expression of Ki‐67 and c‐PARP1 in malignant NK cells for the tumor section of the xenografts excised from (E) and bar plots (bottom panel) for the percentages of Ki‐67+/c‐PARP1+ cells. H) Pseudotime development trajectories of malignant and normal NK cells. Each dot represents a cell in the trajectory projection, colored according to NK cell clusters. The inlet plot shows cells colored according to predicted pseudotime scores from deep blue to yellow, representing cell states from early stage to terminal stage, and two dashed curves represent the maturation of normal NK cells (left) and developmental process of malignant NK cells (right). Comparisons were made using Student's t‐test, and results for growth curves and bar plots are shown as mean value ± standard deviation (SD). ns p ≥ 0.05, *p < 0.05, **p < 0.01, ***p < 0.001, ****p < 0.0001. Scale bar, 100 µm.
Figure 3
Figure 3
Chemotaxis regulation by malignant NK cells in NKTCL TME. A) Dot plots showing the expression of chemokine ligands (left panel) and receptors (right panel) among malignant NK cells and immune cells (indicated at the bottom) in NKTCL. Horizontal lines of identical color connect cells expressing ligands with cells expressing corresponding cognate receptors, and vertical lines highlight the expression patterns of chemokines in selected cell clusters. Cell clusters and chemokines are indicated at the x‐ and y‐axis, respectively. B) Dot plot showing the expression of DPP4 among malignant and normal NK cell clusters (x‐axis). Circle sizes represent the proportions of cells expressing DPP4, and filled colors from light gray to deep purple represent normalized expression levels from low to high. C) Western blotting assay showing the protein expression of DPP4 and ACTIN in the supernatants and cell lysates of NKTCL cell lines (YT and NK‐92) with external DPP4 protein as positive control. D) Multiplex IF staining for DPP4‐expressing malignant NK cells (CD56+DPP4+) in NKTCL biopsies from the SC‐cohort. CD56 and DPP4 proteins as well as nuclear DNA are detected with different colors as indicated on top. Images are representative of biological replicates from three patients. Scale bars, 100 µm. E) Experimental design for the transwell assay to determine the migration ability of NK cells. DPP4 protein and the supernatants from NKTCL cells (YT and NK‐92) were incubated with DPP4 inhibitor (DPP4i) or DMSO as a control for 1 h, which were then incubated with culture medium without chemokines (PBS) or containing chemokine mixture for a 6‐h pretreatment and subsequently added into lower chambers. Peripheral NK cells isolated from PBMCs were then placed into the upper chambers for migration test. Bar plots showing the effect of F) exogenous or G) endogenous DPP4 on the transwell migration rates of NK cells. For (F), NK cells were cultured with chemokine mixture (CXCLs), and/or DPP4, and/or the DPP4i or without these factors (Control) in the lower chambers. For (G), NK cells were cultured with the supernatants from NKTCL cell lines (YT and NK‐92) with or without CXCLs and DPP4i in the lower chambers. Migration rates represent the percentages of migrated cells in all NK cells. Comparisons were made using paired Student's t‐test, and results are shown as mean value ± SD. H) Multiplex IF staining for DPP4 protein in malignant NK cells (CD56+) and extracellular regions as well as related chemokines (CXCL2, CXCL9, and CXCL10) in NKTCL tissue samples. The samples were categorized into two groups based on DPP4 expression: DPP4‐high (left panel) and DPP4‐low (right panel). Images are representative of biological replicates from three patients. Scale bars, 20 µm.
Figure 4
Figure 4
The immunosuppressive networks fostered by malignant NK cells in NKTCL TME. A) UMAP plots related to Figure 2A showing the normalized expression of immune checkpoint molecules, PD‐L1, CTLA4, and CD86, among normal and malignant NK cells. Each dot represents a cell, and the depth of color from light gray to deep purple represents low to high expression. B) Dot plot showing the ligand–receptor interactions (rows) of co‐stimulatory and co‐inhibitory molecules with significant difference between selected cell clusters (columns; the major left and right divisions annotated by the vertical dashed line in bold for malignant NK and myeloid cells, respectively). Ligands (red at the left; row) expressed by source cells (red at the bottom; column) are identified to interact with receptors (black at the left; row) expressed by exhausted and regulatory T cells (CD8_C8_EX, CD4_C6_REG, and CD4_C7_EX; black at the bottom; column). P values estimated using one‐sided permutation test (−log10 scaled) are indicated by circle sizes and the means of the average expression levels of two interacting molecules are indicated by filled colors, with blue to red representing low to high expression. Cellular interaction networks of immunosuppressive interactions between malignant NK cell clusters and tumor‐infiltrating T cell clusters in C) NKTCL and D) NPC. The thickness of each line represents the interaction intensity in scale estimated between the corresponding two cell types. E) Correlations between the cell fractions of pair‐wise cell clusters for NKTCL samples from the SH‐cohort (n = 51). The levels of correlation coefficients are indicated by filled colors; estimated p values are indicated by circle sizes; significant correlations are labeled (*p < 0.05).
Figure 5
Figure 5
The immunosuppressive effect of malignant NK cells on T cells. A) Multiplex IF staining for the juxtaposition of PDL1‐expressing TAMs (CD206+PD‐L1+; indicated by white arrows in bottom left panels) or PDL1‐expressing malignant NK cells (CD56+PD‐L1+; indicated by white arrows in bottom right panels) with CD8+ T cells (CD8+) in NKTCL tissue samples from the SC‐cohort. Proteins of interest are indicated on top with different colors. Images are representative of biological replicates from three patients. Scale bars, 100 µm for the top panel and 20 µm for the bottom panels, respectively. B) Experimental design for the co‐culture assay to assess the immunosuppressive effect of malignant NK cells (with or without LMP1 overexpression) on T cells in allogeneic (TIL‐T system; left panel) and antigen‐specific ways (TCR‐T system; right panel). For the TIL‐T co‐culture system, tumor‐infiltrating T lymphocytes (TIL‐T) isolated from tumor tissues were co‐cultured with NKTCL cells (YT) with or without overexpression of LMP1 for two days. For the TCR‐T co‐culture system, T cells engineered with NY‐ESO‐1‐specific T cell receptor (TCR) were co‐cultured with their target cells (HLA‐matching A549/A2‐NY‐ESO‐1 cells), and additional YT cells were added as the “third‐party cells.” C) Line charts showing the proportions of PD1+ (left panel) and LAG3+ cells (right panel) in T cells upon different co‐culture treatments within T‐TIL system. Fresh tumor‐infiltrating T cells from non‐small‐cell lung cancer (NSCLC) or NPC were co‐cultured without (Control) or with NKTCL cells (YT) infected with lentivirus‐expressing LMP1 (YT‐LMP1) or empty vector control (YT‐Vector). D) Bar plots showing the proportions of IFN‐γ+/Ki‐67+ cells in tumor‐infiltrating T cells (TIL‐T system; left panel) and TCR‐engineered T cells (TCR‐T system; right panel) upon different co‐culture treatments. Fresh tumor‐infiltrating T cells derived from tumor tissues (TIL‐T) or NY‐ESO‐1‐specific TCR‐engineered T cells (TCR‐T) with their HLA‐matching target cells (A549) were co‐cultured without or with NKTCL cells (YT) infected with lentivirus‐expressing LMP1 (YT‐LMP1) or empty vector control (YT‐Vector). Comparisons were made using Student's t‐test, and results for bar plots are shown as mean value ± SD. Corresponding treatments and the proportions of cells for the results of co‐culture assays are indicated at the x‐ and y‐axis, respectively.
Figure 6
Figure 6
Heterogeneous TME signatures and the prognostic indicators of NKTCL. A) Violin plots showing the normalized expression of HLA‐II genes in malignant NK cells for each patient. Patients of two groups and the expression levels of genes are indicated at the x‐ and y‐axis, respectively. B) Multiplex IF staining for HLA‐II‐expressing malignant NK cells (CD56+HLA‐DR+) in NKTCL tumor biopsies of patients with HLA‐IIhigh (top panel) or HLA‐IIlow (bottom panel) from the SC‐cohort. CD56 and HLA‐DR proteins as well as nuclear DNA are detected with different colors as indicated on top. Images are representative of biological replicates from three patients. Scale bar, 100 µm. C) Box plot showing the proportion of EBV+ cells (y‐axis) for each malignant NK cluster (x‐axis) in patient groups of EBVhigh (red) or EBVlow (blue). Center lines denote median values; whiskers denote 1.5× the interquartile range; colored dots denote the proportion of EBV+ cells for each malignant cluster in each patient. Comparison was made using Wilcoxon rank‐sum test. D) Heatmap showing the expression levels of selected genes (rows) in malignant NK cells for each patient from our scRNA‐seq cohort (columns). Filled colors from blue to red in the squares represent normalized expression levels from low to high as scaled in row direction (row Z‐score). E) Bar plot showing signaling pathways with significant difference between EBVhigh and EBVlow patients. Each pathway is colored according to its upregulation in either EBVhigh (red) or EBVlow (blue) samples. The scaled GSVA scores and pathways are indicated at the x‐ and y‐axis, respectively. F) Violin plots showing the normalized expression levels (y‐axis) of PD‐L1 (top panel) and CTLA4 (bottom panel) in malignant NK cells for each patient (x‐axis). Comparison between two groups was made using Wilcoxon rank‐sum test. Kaplan–Meier overall survival curves of NKTCL patients stratified according to their transcriptional levels of G) EBV‐encoded genes or fractions of H) TAMs in the SH‐cohort (n = 51) or protein expression levels of CD206 in the SC‐cohort (n = 55; I). The red and blue lines represent two groups of patients with high and low levels of indicated TME signatures. Survival duration and probability are indicated at the x‐ and y‐axis, respectively. P values were calculated using log‐rank test. The bottom tables show the numbers of patients at risk by time for two groups.
Figure 7
Figure 7
Schematic diagrams of cross‐talks among malignant NK cells and immune cells in the TME of NKTCL. EBV‐infected malignant NK cells and immune cells together participate in the development of NKTCL. 1) Upon EBV infection, LMP1 may contribute to the malignant transformation of NK cells (Figure 2H). 2) Malignant NK cells and TAMs secret a variety of chemokines (including CCL2, CCL3, CCL4, CCL5, etc.) and thereby recruit multiple types of immune cells from peripheral blood through corresponding chemotactic interactions (Figure 3A). 3) Soluble DPP4 secreted by malignant NK cells can truncate and rapidly degrade CXCL2, CXCL9, and CXCL10 in NKTCL TME, whereby hampering the recruitment of CXCR2+CXCR3+ immune cells (Figure 3B–H). 4) Malignant NK cells (especially LMP1+ ones) expressing CD86 and PD‐L1 can negatively regulate the immune response of tumor‐infiltrating T cells including exhausted and regulatory T cells (CD8+ TEX, CD4+ TEX, and Treg; Figures 4A–C and 5A–D). 5) TAMs not only secrete immunosuppressive IL10 and angiogenic VEGFA, but also interact with tumor‐infiltrating T cells through suppressive interactions of CD86‐CTLA4 and PDL1‐PD1 (Figures 4B and 5A).

References

    1. Tse E., Kwong Y.‐L., J. Hematol. Oncol. 2017, 10, 85. - PMC - PubMed
    1. Huang H., Gao Y., Wang X., Cai Q., Cai Q., Bai B., Zhao W., Yan Z., Jiang W., Xia Z., Li Z., Blood 2015, 126, 1521.
    1. Yamaguchi M., Tobinai K., Oguchi M., Ishizuka N., Kobayashi Y., Isobe Y., Ishizawa K., Maseki N., Itoh K., Usui N., Wasada I., Kinoshita T., Ohshima K., Matsuno Y., Terauchi T., Nawano S., Ishikura S., Kagami Y., Hotta T., Oshimi K., J. Clin. Oncol. 2009, 27, 5594. - PubMed
    1. Kim S. J., Yang D.‐H., Kim J. S., Kwak J.‐Y., Eom H.‐S., Hong D. S., Won J Ho, Lee J. H., Yoon D. H., Cho J., Nam T.‐K., Lee S.‐W., Ahn Y. C., Suh C., Kim W. S., Ann. Hematol. 2014, 93, 1895. - PubMed
    1. Yamaguchi M., Kwong Y.‐L., Kim W. S., Maeda Y., Hashimoto C., Suh C., Izutsu K., Ishida F., Isobe Y., Sueoka E., Suzumiya J., Kodama T., Kimura H., Hyo R., Nakamura S., Oshimi K., Suzuki R., J. Clin. Oncol. 2011, 29, 4410. - PubMed

Publication types

MeSH terms