Meta-Analysis
. 2023 Nov 11;14(1):7300.
doi: 10.1038/s41467-023-43036-1.

A large meta-analysis identifies genes associated with anterior uveitis

Collaborators, Affiliations
Meta-Analysis

A large meta-analysis identifies genes associated with anterior uveitis

Sahar Gelfman et al. Nat Commun. .

Abstract

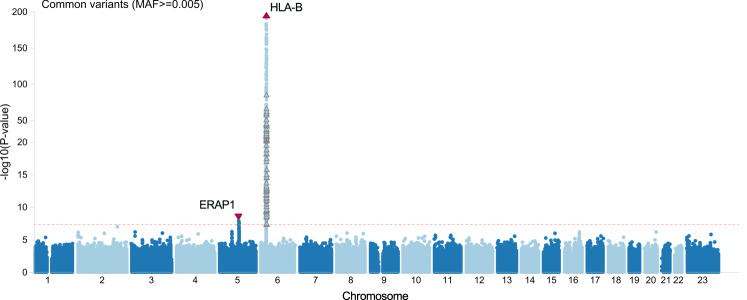
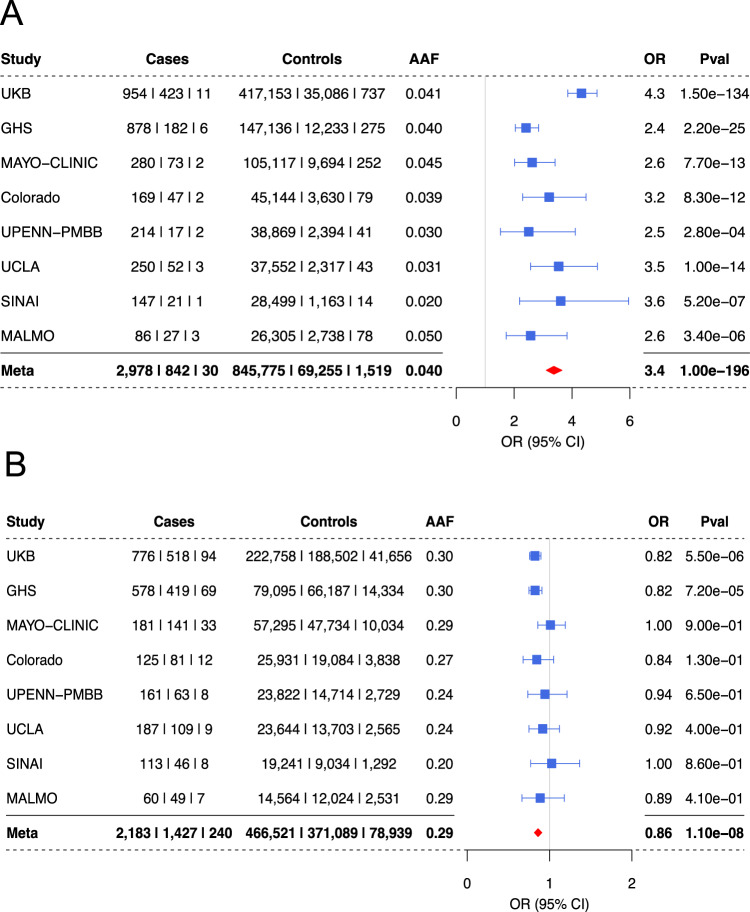
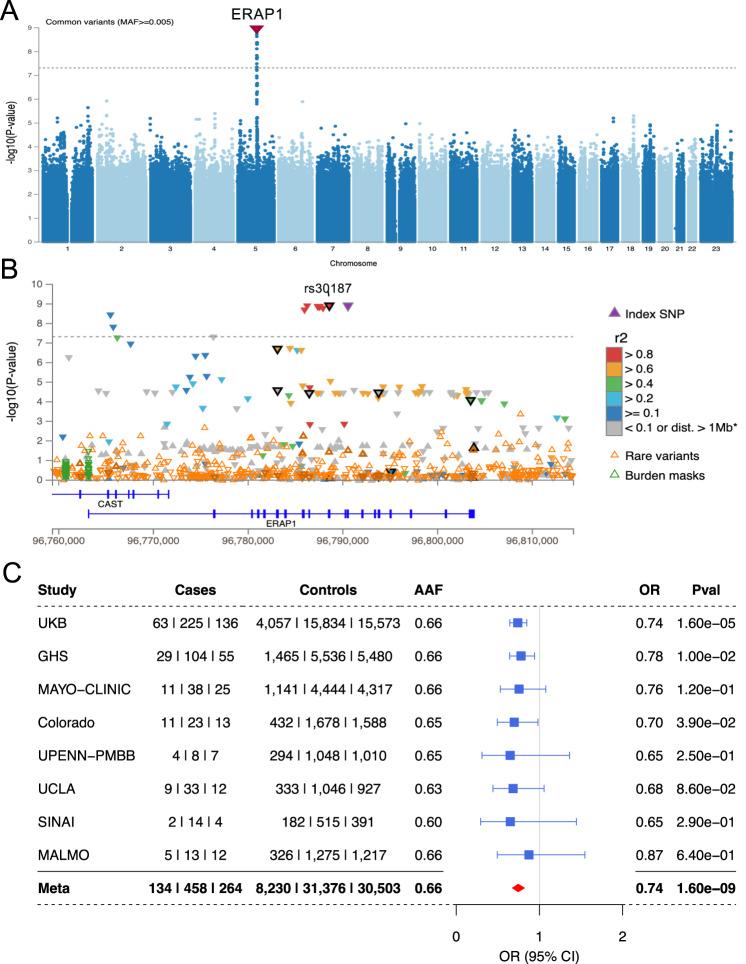
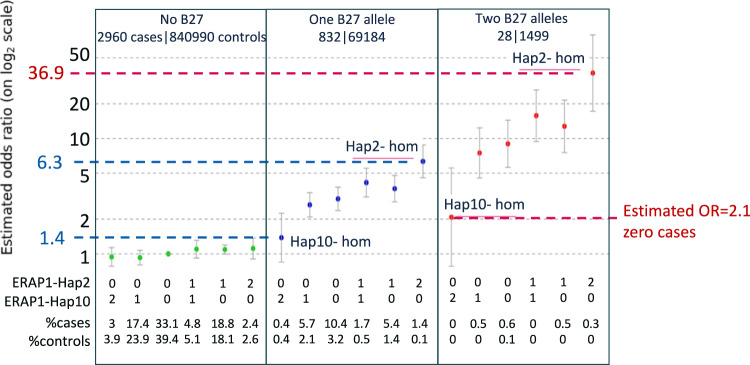
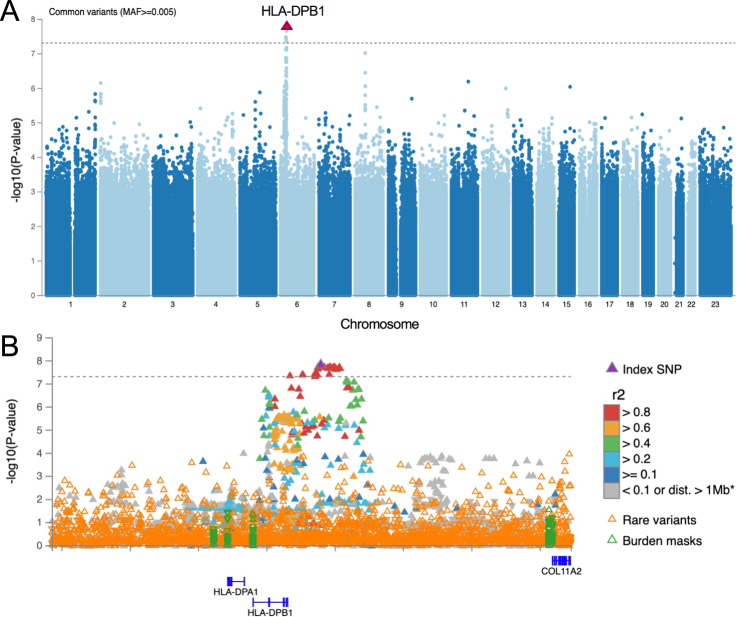
Anterior Uveitis (AU) is the inflammation of the anterior part of the eye, the iris and ciliary body and is strongly associated with HLA-B*27. We report AU exome sequencing results from eight independent cohorts consisting of 3,850 cases and 916,549 controls. We identify common genome-wide significant loci in HLA-B (OR = 3.37, p = 1.03e-196) and ERAP1 (OR = 0.86, p = 1.1e-08), and find IPMK (OR = 9.4, p = 4.42e-09) and IDO2 (OR = 3.61, p = 6.16e-08) as genome-wide significant genes based on the burden of rare coding variants. Dividing the cohort into HLA-B*27 positive and negative individuals, we find ERAP1 haplotype is strongly protective only for B*27-positive AU (OR = 0.73, p = 5.2e-10). Investigation of B*27-negative AU identifies a common signal near HLA-DPB1 (rs3117230, OR = 1.26, p = 2.7e-08), risk genes IPMK and IDO2, and several additional candidate risk genes, including ADGFR5, STXBP2, and ACHE. Taken together, we decipher the genetics underlying B*27-positive and -negative AU and identify rare and common genetic signals for both subtypes of disease.


Conflict of interest statement

S.G., A.M., S.M.H., R.W., V.R., N.P., V.K.P., E.C., M.L., R.H., J.F., B.C., A.J.L., C.G.M., T.V., J.W., C.R., B.S., A.B., E.A.S. and G.C. are current employees and/or stockholders of Regeneron Genetics Center or Regeneron Pharmaceuticals. All other authors declare no conflict of interest.

Figures

Fig. 1
Fig. 1. Common HLA-B risk and ERAP1 protection with 3850 AU cases and 916,549 controls.
A Manhattan plot depicting the -log10(P value) for all common variants (y-axis) across all chromosomes (x-axis). HLA-B top risk signal is shown by an upward red triangle on chromosome six, while ERAP1 protection is shown by the downward red triangle on chromosome five. Association models were run with age, age2, sex and age × sex, and 10 ancestry-informative principal components as covariates. P values are uncorrected and are from two-sided tests performed using approximate Firth logistic regression.
Fig. 2
Fig. 2. Top SNPs at the HLA-B and ERAP1 loci across eight cohorts.
A A forest plot depicting the association details for HLA-B top risk variant rs543685299 in each of the eight cohorts tested and including all ancestries. B A forest plot depicting the association details for the top ERAP1 protective intronic variant rs3198304 in the eight cohorts tested and including all ancestries. A meta-analysis result combining all cohorts is the lowest row (bold), meta-analysis OR is presented by a red diamond. Center points represent odds ratios as estimated by approximate Firth logistic regression, with errors bars representing 95% confidence intervals. P values are uncorrected and reflect two-sided tests. Numbers below the cases and controls columns represent counts of individuals with homozygote reference, heterozygote and homozygous alternative genotypes, respectively.
Fig. 3
Fig. 3. A B*27-pos analysis exhibiting ERAP1 as the only genome-wide significant risk for B*27-AU.
A A Manhattan plot depicting the -log10(P value) for all common variants (y-axis) across all chromosomes (x-axis). ERAP1 top protective signal is shown by a downward red triangle on chromosome five. B A locus zoom plot showing ERAP1. Genome-wide significant threshold of 5e–08 is represented by a dashed gray line. Coding variants are highlighted in black, including labeled rs30187 (K528R). C A forest plot depicting the association details for ERAP1 top risk variant (rs30187) in all cohorts tested. A meta-analysis result combining all cohorts is the lowest row (bold), meta-analysis OR is represented by a red diamond. Center points represent odds ratios as estimated by approximate Firth logistic regression, with errors bars representing 95% confidence intervals. P values are uncorrected and reflect two-sided tests. Numbers below the cases and controls columns represent counts of individuals with homozygote reference, heterozygote and homozygous alternative genotypes, respectively.
Fig. 4
Fig. 4. The combined risk for AU with HLA-B*27 and ERAP1-haplotyes.
The effect of homozygous and heterozygous ERAP1 haplotypes Hap2 and Hap10 on different HLA-B*27 backgrounds. Zero HLA-B and ERAP1 protection haplotypes combination (two copies of Hap10 and no copies of Hap2) was defined as the reference risk genotype (i.e. OR = 1, first column on left panel). The assessed risk of the ERAP1 Hap10 and Hap2 combinations on a B*27 negative background is shown (left panel and supplementary Data 5). Middle panel is the same as left panel, but for one copy of HLA-B*27. Right panel is the same as left panel, but for two copies of HLA-B*27.
Fig. 5
Fig. 5. HLA-DPB1 is a significant risk for B*27-neg AU.
A Manhattan plot depicting the -log10(P value) for all common variants (y-axis) across all chromosomes (x-axis). HLA-DPB1 top risk signal is shown by an upward red triangle on chromosome five. B A locus zoom plot showing all common and rare signals on HLA-DPB1. Genome-wide significant threshold of 5e–08 is represented by a dashed gray line, above which there is a stretch of high LD variants downstream to HLA-DPB1. Association models were run with age, age2, sex and age × sex, and 10 ancestry-informative principal components as covariates. P values are uncorrected and are from two-sided tests performed using approximate Firth logistic regression.

References

    1. Durrani OM, et al. Degree, duration, and causes of visual loss in uveitis. Br. J. Ophthalmol. 2004;88:1159–1162. - PMC - PubMed
    1. Rosenbaum JT, et al. New observations and emerging ideas in diagnosis and management of non-infectious uveitis: A review. Semin Arthritis Rheum. 2019;49:438–445. - PubMed
    1. Thorne JE, et al. Prevalence of noninfectious uveitis in the United States: A claims-based analysis. JAMA Ophthalmol. 2016;134:1237–1245. - PubMed
    1. Joltikov KA, Lobo-Chan AM. Epidemiology and risk factors in non-infectious uveitis: A systematic review. Front Med. (Lausanne) 2021;8:695904. - PMC - PubMed
    1. Chang JH, Wakefield D. Uveitis: a global perspective. Ocul. Immunol. Inflamm. 2002;10:263–279. - PubMed

Publication types