. 2023 Nov 10;14(1):7279.
doi: 10.1038/s41467-023-43159-5.

Leveraging information between multiple population groups and traits improves fine-mapping resolution

Affiliations

Leveraging information between multiple population groups and traits improves fine-mapping resolution

Feng Zhou et al. Nat Commun. .

Abstract

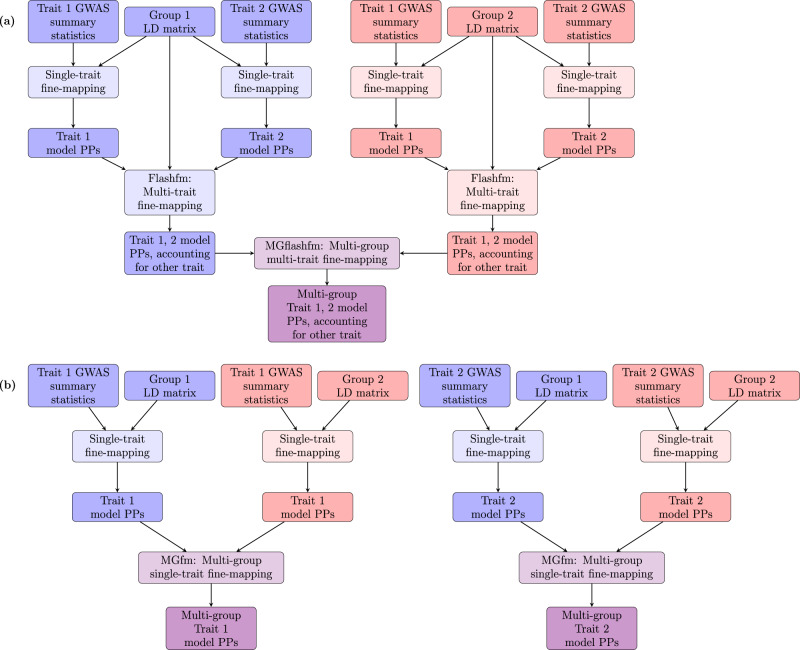
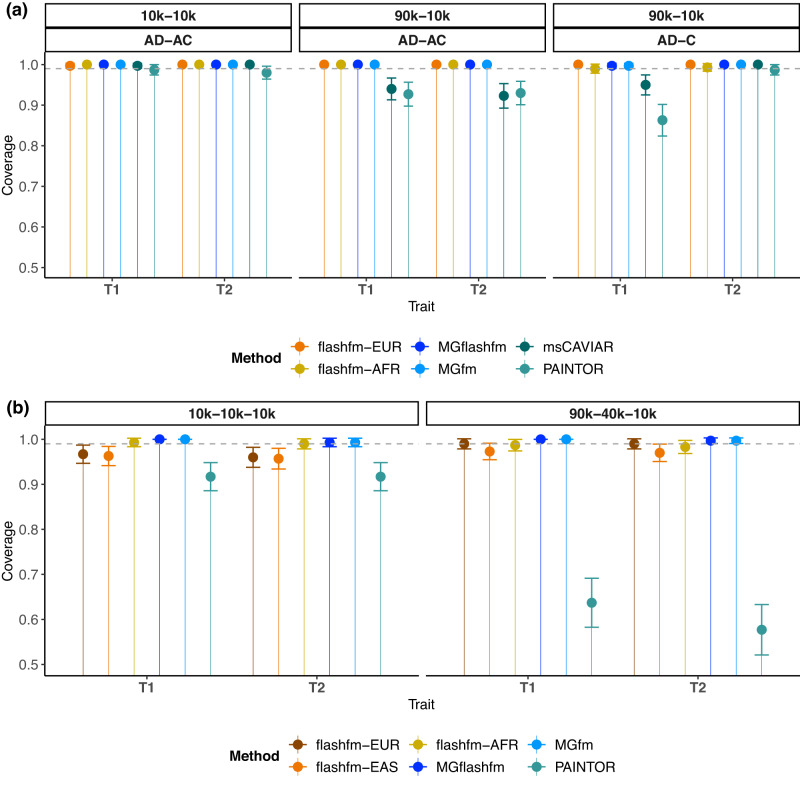
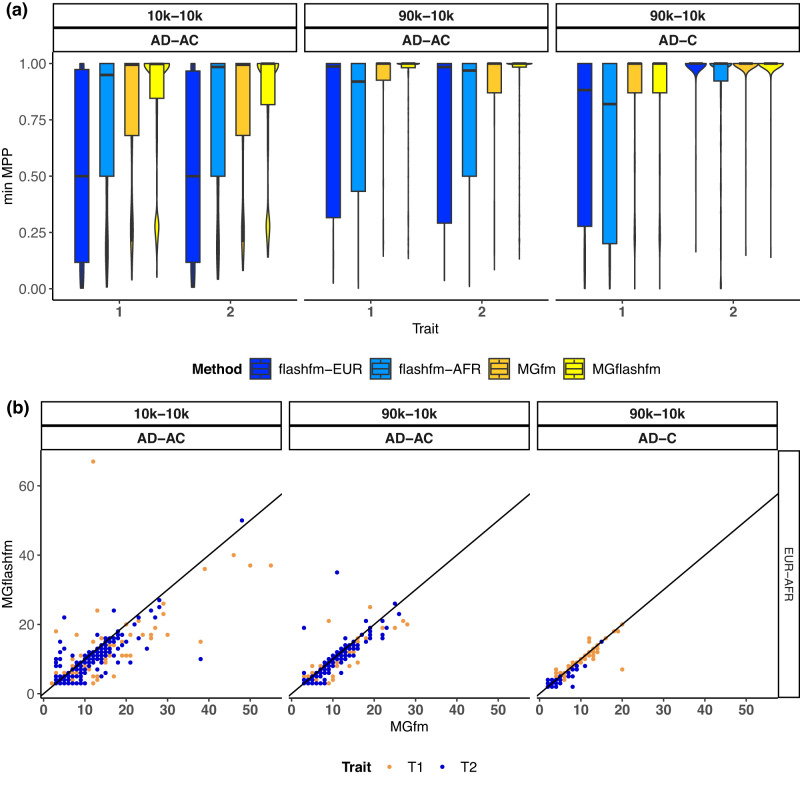
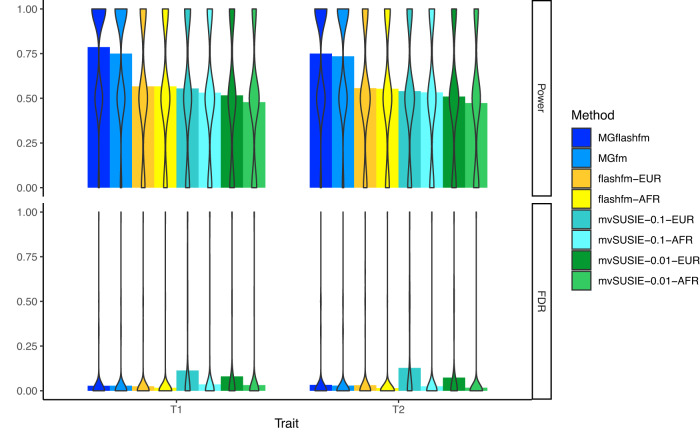
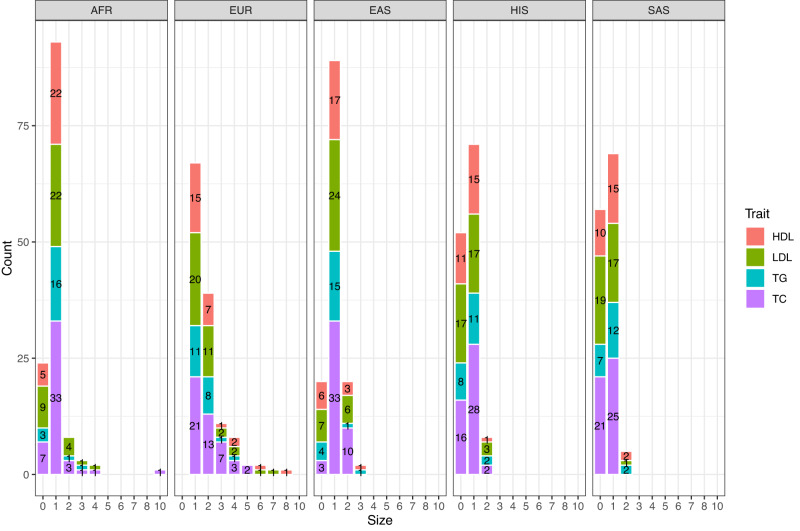
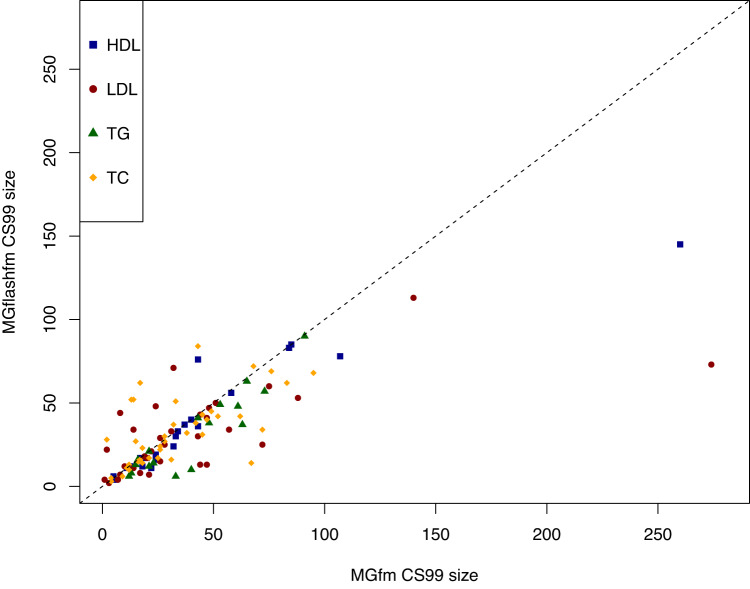
Statistical fine-mapping helps to pinpoint likely causal variants underlying genetic association signals. Its resolution can be improved by (i) leveraging information between traits; and (ii) exploiting differences in linkage disequilibrium structure between diverse population groups. Using association summary statistics, MGflashfm jointly fine-maps signals from multiple traits and population groups; MGfm uses an analogous framework to analyse each trait separately. We also provide a practical approach to fine-mapping with out-of-sample reference panels. In simulation studies we show that MGflashfm and MGfm are well-calibrated and that the mean proportion of causal variants with PP > 0.80 is above 0.75 (MGflashfm) and 0.70 (MGfm). In our analysis of four lipids traits across five population groups, MGflashfm gives a median 99% credible set reduction of 10.5% over MGfm. MGflashfm and MGfm only require summary level data, making them very useful fine-mapping tools in consortia efforts where individual-level data cannot be shared.


Conflict of interest statement

The authors declare no competing interests.

Figures

Fig. 1
Fig. 1. Schematic diagrams of multi-group fine-mapping.
Diagrams are shown for two groups and two traits, and the methods are available for at most six groups and six traits. a In MGflashfm (multi-group multi-trait fine-mapping), multi-SNP models for each trait are first constructed within each group, using appropriate LD for the group. Within each group, multi-trait fine-mapping then leverages information between the traits while making use of group-specific LD. Trait-adjusted model PPs within each group are then jointly assessed across groups; b In MGfm (multi-group single-trait fine-mapping), multi-SNP models for each trait are first constructed within each group, using the group-specific LD. Then, in parallel, trait models within each group are jointly assessed across groups, independently of the other trait. For both MGfm and MGflashfm, the final output for each trait is the credible set variants, as well as the multi-group marginal PP (mgMPP) of each variant being causal, as well as other variant-specific details.
Fig. 2
Fig. 2. Flashfm, MGflashfm and MGfm, are well-calibrated.
Coverage is measured as the probability that all causal variants are captured by the 99% credible set, estimated over 300 replications. Data are presented as the proportion of replications in which the 99% credible set contains all causal variants ± SEM, where SEM is the standard proportion error bound of a 95% confidence interval based on 300 observations. Flashfm-EUR, flashfm-EAS and flashfm-AFR are multi-trait (single-group) fine-mapping for the indicated group and are well-calibrated in all settings, as are MGflashfm and MGfm. PAINTOR and msCAVIAR are not well-calibrated for unequal sample sizes, though msCAVIAR is well-calibrated in the single causal variant setting. a Coverage results from EUR-AFR simulations. Within each panel the three simulation settings are shown as either having equal sample sizes of 10k each or sample sizes of 90k EUR and 10k AFR, and either two causal variants for each trait with one shared (trait 1: AD, trait 2: AC) or non-overlapping causal variants and one trait having a single causal variant (trait 1: AD, trait 2: C); any pair of causal variants have r2 < 0.5. b Coverage results from EUR-EAS-AFR simulations with equal sample sizes of 10k each or 90k EUR, 40k EAS, and 10k AFR. In both settings each trait has two causal variants (trait 1: AD, trait 2: AC). The A variant has 0.005 < MAF < 0.05 in EUR and EAS groups, but MAF > 0.05 in the AFR group, and the C and D variants have MAF > 0.05 in all groups.
Fig. 3
Fig. 3. MGflashfm has the highest gains in prioritisation and resolution among calibrated methods.
For EUR-AFR simulations, three simulation settings are shown as either having equal sample sizes of 10k each or sample sizes of 90k EUR and 10k AFR, and either two causal variants for each trait with one shared (trait 1: AD, trait 2: AC) or non-overlapping causal variants and one trait having a single causal variant (trait 1: AD, trait 2: C); any pair of causal variants have r2 < 0.5 and there are 300 replications within each setting. a Distribution of the minimum MPP of causal variants for each trait via violin plots; the median is given by the centre line, upper and lower quartiles are the box limits, whiskers are at most 1.5× interquartile range, and width indicates the frequency. This indicates that MGflashfm is best at prioritising causal variants when the traits share a causal variant or similar performance to MGfm when no sharing. b Comparison of the sizes of 99% credible sets from MGflashfm and MGfm. This suggests that MGflashfm tends to have better resolution than MGfm.
Fig. 4
Fig. 4. MGflashfm has the highest power and low FDR.
For EUR-AFR simulations of two traits, results are summarised for sample sizes of 90k EUR and 10k AFR, where there are two causal variants for each trait with one shared (trait 1: AD, trait 2: AC); any pair of causal variants have r2 < 0.5 and there are 300 replications within each setting. The mean power and mean FDR are shown for each method, as indicated by the top of each bar; the distribution of the power and FDR estimates over the 300 replications is shown by violin plots, where width indicates frequency. Power and FDR for the flashfm family of methods are calculated using a MPP threshold of 0.9, and for mvSUSIE lfsr thresholds of 0.1 and 0.01 are used. The power is highest for MGflashfm, followed by MGfm, then the group-specific flashfm and mvSUSIE methods. FDR is relatively low and similar amongst all methods, though lowest for flashfm-AFR and highest for mvSUSIE-EUR.
Fig. 5
Fig. 5. Practical fine-mapping with 1000 Genomes reference panels favours one and two variant models.
Among 50 regions, HDL, LDL, TG and/or TC signals were fine-mapped in each of the five groups, using 1000 Genomes data (matched appropriately) and our practical approach.
Fig. 6
Fig. 6. MGflashfm generally gives smaller credible sets than MGfm for GLGC lipids.
For each of the 50 regions, the CS99 for a given trait is constructed from MGflashfm and MGfm. Most of the CS99 sizes from MGflashfm are smaller than those from MGfm.

References

    1. Claussnitzer M, et al. A brief history of human disease genetics. Nature. 2020;577:179–189. doi: 10.1038/s41586-019-1879-7. - DOI - PMC - PubMed
    1. Hutchinson A, Asimit J, Wallace C. Fine-mapping genetic associations. Hum. Mol. Genet. 2020;29:R81–R88. doi: 10.1093/hmg/ddaa148. - DOI - PMC - PubMed
    1. Spain SL, Barrett JC. Strategies for fine-mapping complex traits. Hum. Mol. Genet. 2015;24:R111–R119. doi: 10.1093/hmg/ddv260. - DOI - PMC - PubMed
    1. Asimit JL, Hatzikotoulas K, McCarthy M, Morris AP, Zeggini E. Trans-ethnic study design approaches for fine-mapping. Eur. J. Hum. Genet. 2016;24:1330–1336. doi: 10.1038/ejhg.2016.1. - DOI - PMC - PubMed
    1. Zaitlen N, Paşaniuc B, Gur T, Ziv E, Halperin E. Leveraging genetic variability across populations for the identification of causal variants. Am. J. Hum. Genet. 2010;86:23–33. doi: 10.1016/j.ajhg.2009.11.016. - DOI - PMC - PubMed

Publication types