

Coalescence and mixing dynamics of droplets in acoustic levitation by selective colour imaging and measurement
- PMID: 37949912
- PMCID: PMC10638323
- DOI: 10.1038/s41598-023-46008-z
Coalescence and mixing dynamics of droplets in acoustic levitation by selective colour imaging and measurement
Abstract
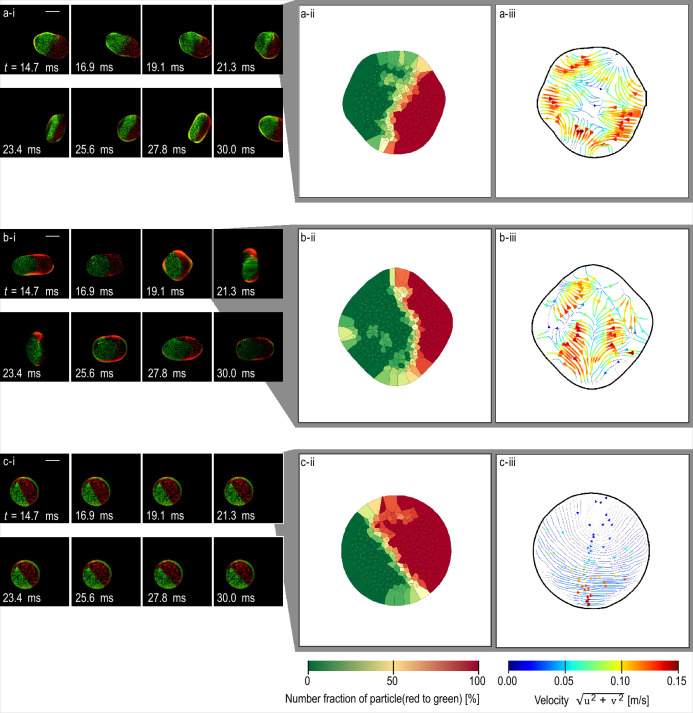
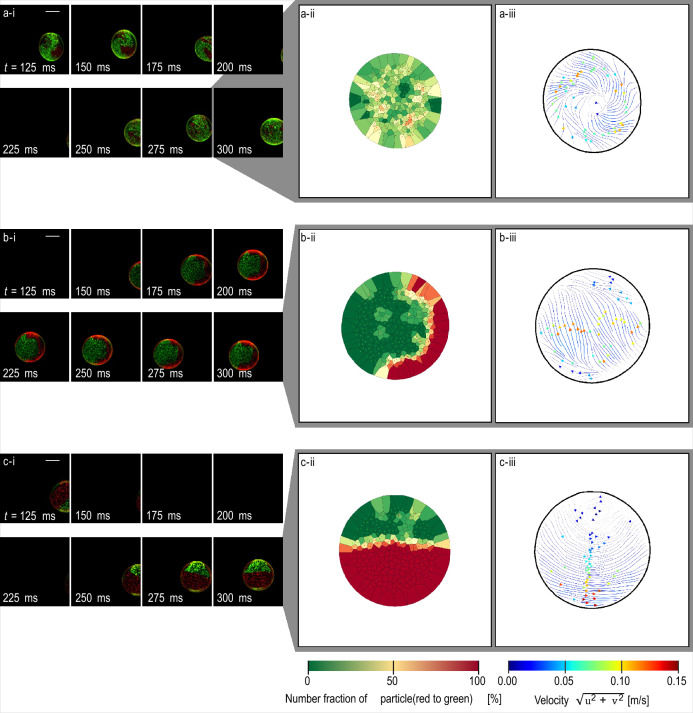
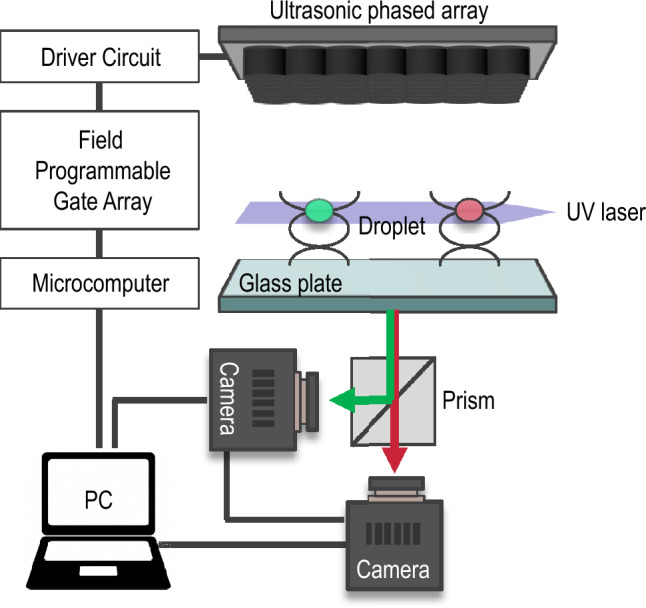
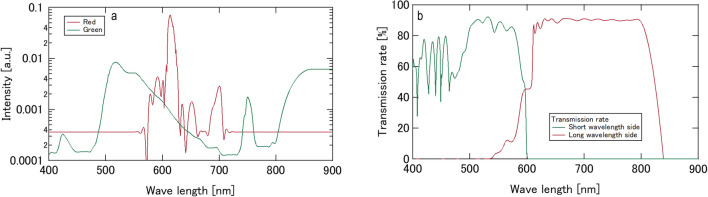
Acoustic levitation is well-suited to 'lab-on-a-drop' contactless chemical analysis of droplets. Rapid mixing is of fundamental importance in lab-on-a-drop platforms and many other applications involving droplet manipulation. Small droplets, however, have low Reynolds numbers; thus, mixing via turbulence is not possible. Inducing surface oscillation is effective in this regard, however, the relationship between internal flow and mixing dynamics of droplets remains unclear. In this study, we conducted a set of simultaneous optical measurements to assess both the flow field and the distribution of fluid components within acoustically levitated droplets. To achieve this, we developed a technique to selectively separate fluorescent particles within each fluid, permitting the measurement of the concentration field based on the data from the discrete particle distribution. This approach revealed a relationship between the mixing process and the internal flow caused by surface oscillation. Thus, the internal flow induced by surface oscillation could enhance droplet mixing. Our findings will be conducive to the application and further development of lab-on-a-drop devices.
© 2023. The Author(s).
Conflict of interest statement
The authors declare no competing interests.
Figures


Similar articles
-
Coalescence Dynamics of Acoustically Levitated Droplets.Micromachines (Basel). 2020 Mar 26;11(4):343. doi: 10.3390/mi11040343. Micromachines (Basel). 2020. PMID: 32224992 Free PMC article.
-
Oscillation Dynamics of Multiple Water Droplets Levitated in an Acoustic Field.Micromachines (Basel). 2022 Aug 23;13(9):1373. doi: 10.3390/mi13091373. Micromachines (Basel). 2022. PMID: 36143996 Free PMC article.
-
Contactless Fluid Manipulation in Air: Droplet Coalescence and Active Mixing by Acoustic Levitation.Sci Rep. 2018 Jul 5;8(1):10221. doi: 10.1038/s41598-018-28451-5. Sci Rep. 2018. PMID: 29977060 Free PMC article.
-
Evaporation issues of acoustically levitated fuel droplets.Ultrason Sonochem. 2023 Aug;98:106480. doi: 10.1016/j.ultsonch.2023.106480. Epub 2023 Jun 13. Ultrason Sonochem. 2023. PMID: 37393855 Free PMC article. Review.
-
Acoustically levitated droplets: a contactless sampling method for fluorescence studies.Ann N Y Acad Sci. 2008;1130:78-84. doi: 10.1196/annals.1430.039. Ann N Y Acad Sci. 2008. PMID: 18596335 Review.
Cited by
-
Dynamics of droplets and bubbles and their applications: current challenges and future opportunities.Sci Rep. 2025 Apr 10;15(1):12353. doi: 10.1038/s41598-025-96235-9. Sci Rep. 2025. PMID: 40210944 Free PMC article.
-
On the ultra-rapid mixing in two colliding Leidenfrost drops.Sci Rep. 2025 May 23;15(1):18038. doi: 10.1038/s41598-025-02940-w. Sci Rep. 2025. PMID: 40410384 Free PMC article.
References
-
- Tsujino S, Tomizaki T. Applications of acoustic levitation in chemical analysis and biochemistry. In: Zang D, editor. Acoustic Levitation: From Physics to Applications. Springer; 2020. pp. 151–179.
-
- Priego-Capote F, de Castro L. Ultrasound-assisted levitation: Lab-on-a-drop. Trends Anal. Chem. 2006;25:856–867. doi: 10.1016/j.trac.2006.05.014. - DOI
LinkOut - more resources
Full Text Sources
Miscellaneous
