. 2023 Nov 10;13(1):19567.
doi: 10.1038/s41598-023-46351-1.

Biodistribution and function of coupled polymer-DNA origami nanostructures

Affiliations

Biodistribution and function of coupled polymer-DNA origami nanostructures

Noah Joseph et al. Sci Rep. .

Abstract

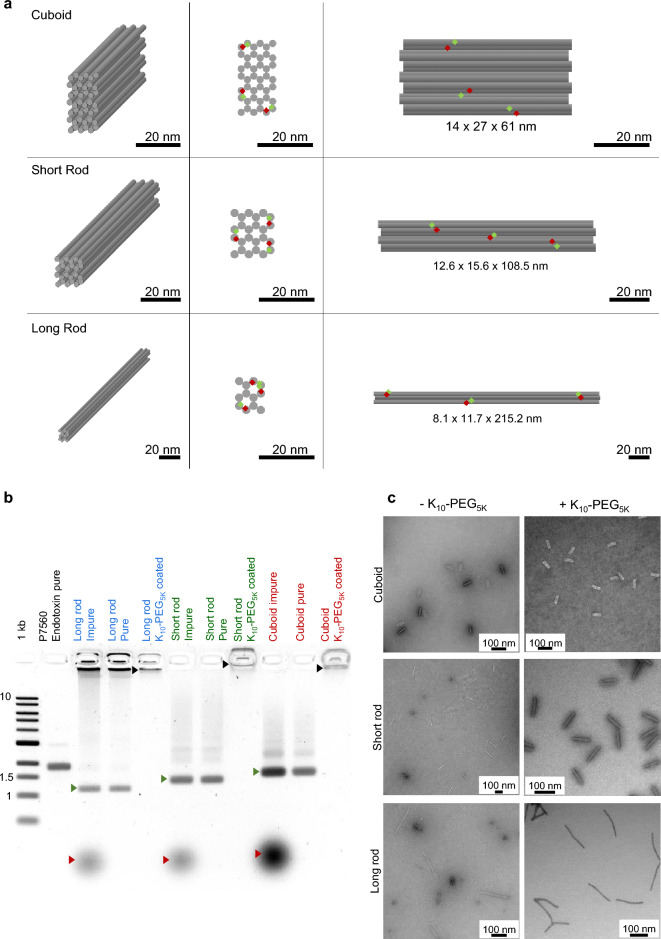
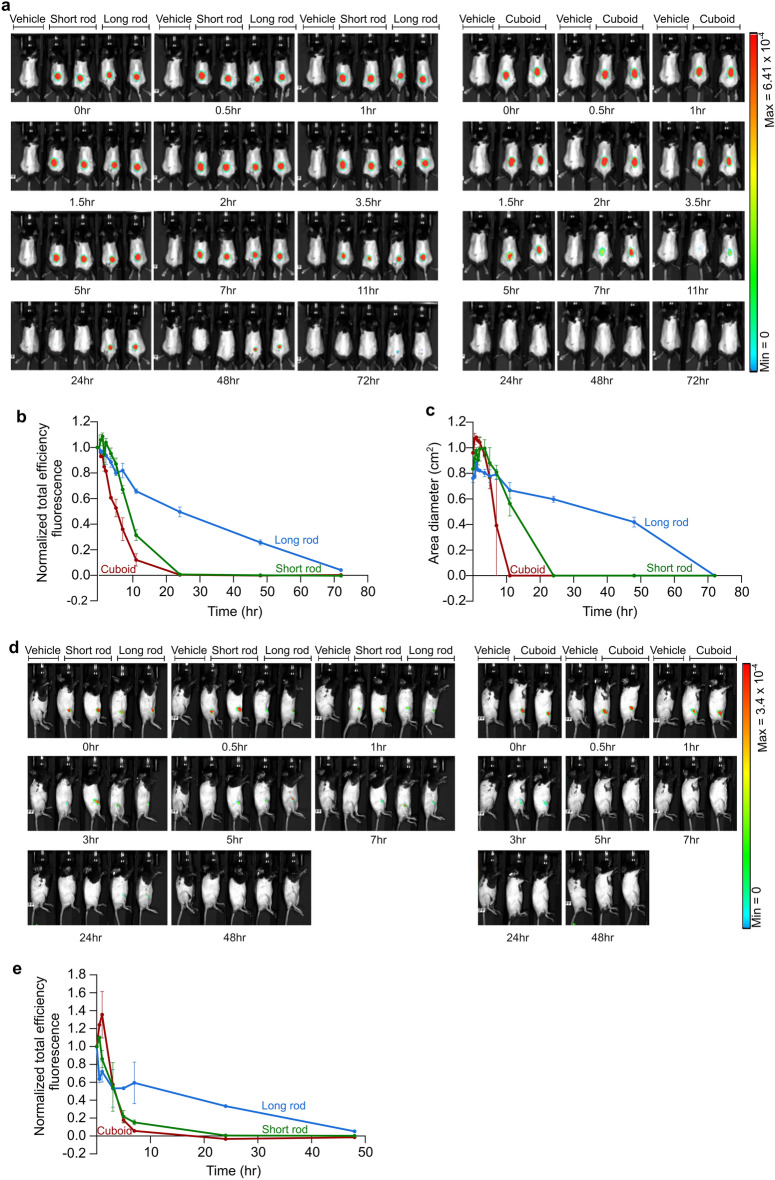
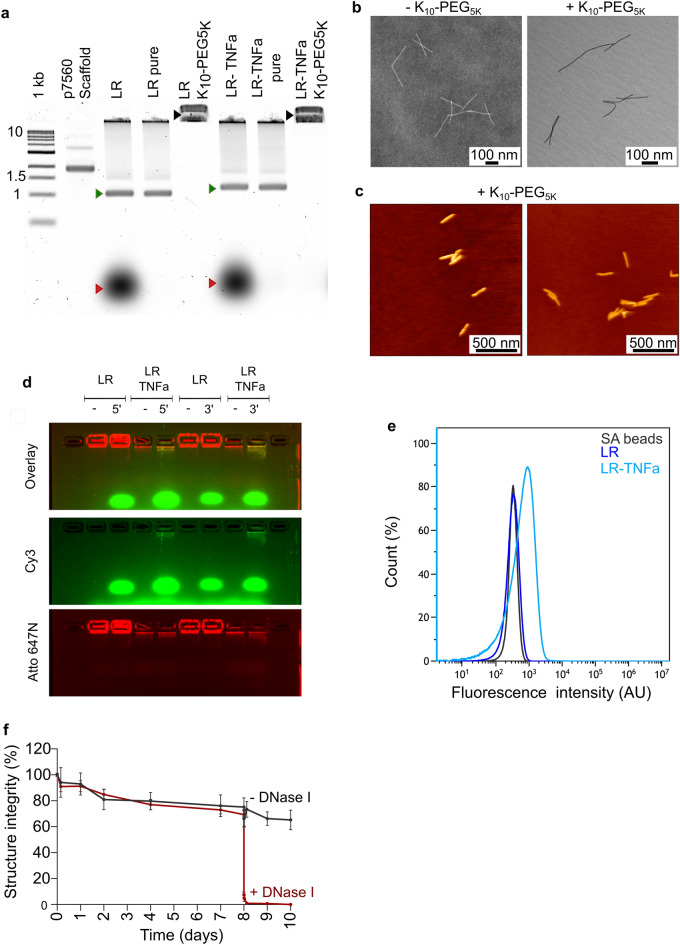
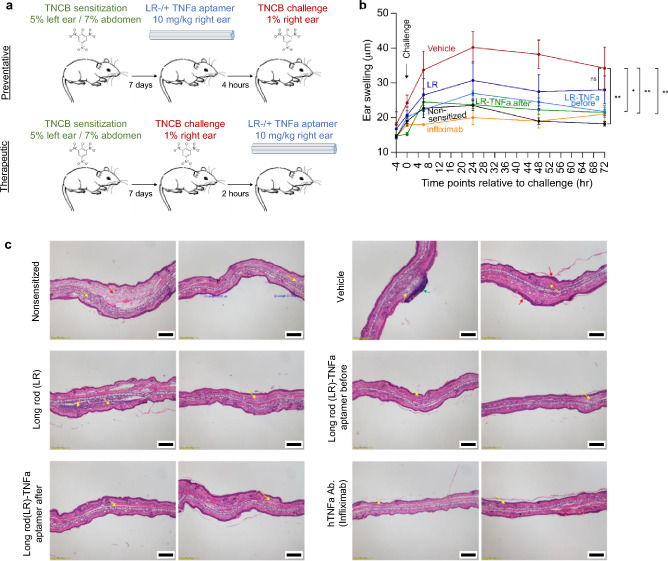
Spatial control over the distribution of therapeutics is a highly desired feature, which could limit the side effects of many drugs. Here we describe a nanoscale agent, fabricated from a coupled polymer-DNA origami hybrid that exhibits stability in serum and slow diffusion through tissues, in a manner correlating with shape and aspect ratio. Coupling to fragments of polyethylene glycol (PEG) through polyamine electrostatic interactions resulted in marked stability of the agents in-vivo, with > 90% of the agents maintaining structural integrity 5 days following subcutaneous injection. An agent functionalized with aptamers specific for human tumor necrosis factor TNF-alpha, significantly abrogated the inflammatory response in a delayed-type hypersensitivity model in humanized TNF-alpha mice. These findings highlight polymer-DNA hybrid nanostructures as a programmable and pharmacologically viable update to mainstream technologies such as monoclonal antibodies, capable of exerting an additional layer of control across the spatial dimension of drug activity.


Conflict of interest statement

NJ, AS, EG, SB, AAH, and IB are currently (or were in the past) employees and/or shareholders in Augmanity, a research company based in Rehovot, Israel, that develops DNA-related technologies, and are listed as inventors on patents related to technologies reported in this paper. BM declares no financial interests. All authors declare no non-financial interests.

Figures

Figure 1
Figure 1
Structural characterization of the DNA origami nanostructures and quality assessment of their assembly. (a) Design schematic. The rows show the different DNA origami nanostructures investigated: cuboid, short rod and long rod (from top to bottom). The columns show different views of the DNA origami nanostructures: 3D, front and side view (from left to right). FRET pairs are distributed evenly on the DNA origami nanostructures and shown as red (Atto 647N) and green (Atto 488) diamonds. All scale bars are 20 nm. (b) Quality evaluation of the DNA origami nanostructures after assembly (lanes 3, 6, 9), after PEG purification (lanes 4, 7, 10) and after PEG-polylysine addition (lanes 5, 8, 11) as analyzed by gel electrophoresis. 1 kb double-stranded DNA was used as a ladder and specific bands are indicated, numbers are in kb. Scaff. P7560 ssDNA scaffold. Red arrows indicate staple excess and leftovers, green arrows represent the well-folded nanostructures before and after PEG purification, and the black arrows show the purified nanostructures coated with PEG5K-K10. (c) DNA origami nanostructures as visualized by transmission electron microscopy (TEM). Each structure was imaged before and after PEG-Poly(lysine) coating as indicated. All scale bars are 100 nm.
Figure 2
Figure 2
Biodistribution of different DNA origami nanostructures. (a) Live image analysis of total body biodistribution over time of the indicated DNA origami nanostructures following their subcutaneous injection into mice. Heat map false color correlates to FRET levels. (b) Quantification of total efficiency fluorescence obtained in mouse images from A. Same region of interest (ROI) was chosen around the injection area for each mouse and the FRET fluorescent total efficiency of the indicated DNA origami nanostructures was measured in each ROI along time points. Calculations were performed as described in “Methods”. Data presented are the mean values ± SEM. (c) Quantification of the indicated DNA origami nanostructure diffusion along time following their subcutaneous injection into mice. Calculations were performed as described in “Methods” based on mouse images from A. Data presented are the mean values ± SEM. (d) Live image analysis of total body biodistribution over time of the indicated DNA origami nanostructures following their injection into mouse knee joints. Heat map false color correlates to FRET levels. (e) Quantification of total efficiency fluorescence obtained in mouse images from D. Same region of interest (ROI) was chosen around the injection area for each mouse and the FRET fluorescent total efficiency of the indicated DNA origami nanostructures was measured in each ROI along time points. Calculations were performed as described in “Methods”. Data presented are the mean values ± SEM.
Figure 3
Figure 3
Characterization of the long rod-TNFa aptamer structure, specificity and stability. (a) Quality evaluation of either the long rod-no aptamer (LR) or the long rod-TNFa aptamer (LR-TNFa) after assembly (lanes 3, 6), after PEG purification (lanes 4, 7) and after PEG-polylysine addition (lanes 5, 8) as analyzed by gel electrophoresis. 1 kb double-stranded DNA was used as a ladder and specific bands are indicated on the left side, numbers are in kb. Scaff., P7560 ssDNA scaffold. Red arrows indicate staple excess and leftovers, green arrows represent the well-folded nanostructures before and after PEG purification, and the black arrows show the purified nanostructures coated with PEG5K-K10. (b) TEM image of the long rod-TNFa aptamer before and after PEG-Poly(lysine) coating as indicated. All scale bars are 100 nm. (c) Representative AFM images of the long rod-TNFa aptamer. Height is coded by color. All scale bars are 500 nm. (d) Incubation of a reverse complement sequence for the TNFa aptamer with either the long rod-no aptamer (LR) or the long rod-TNFa aptamer (LR TNFa) followed by gel electrophoresis. 5ʹ or 3ʹ indicates the end at which the reverse complement oligonucleotide was tagged with Cy3. (e) FACS analysis of long rod binding to recombinant human TNFa protein-coated streptavidin (SA) beads. (f) Time-dependent stability of the long rod-TNFa aptamer in human serum. Half of the samples were treated with DNase I 192 h following incubation. Structure integrity was calculated as described in “Methods”. Data presented are the mean values ± SEM.
Figure 4
Figure 4
Biodistribution of long rod DNA origami following ear injection. (a) Live image analysis of total body biodistribution over time of the long rod DNA origami nanostructure after its injection into the left ear of nude mice. First two mice (from left to right) in each image were injected only with the vehicle. Heat map false color correlates to FRET levels. (b) Quantification of total efficiency fluorescence obtained in the left ear from (a). Same region of interest (ROI) was chosen around the injection area for each mouse and the fluorescent total efficiency of Atto 488, Atto 647N and FRET channels was measured in each ROI along time points. Calculations were performed as described in “Methods”. Marked rectangle is enlarged at the right. Data presented are the mean values ± SEM. Dashed lines in the magnified graph on the right indicate t1/2.
Figure 5
Figure 5
Long rod DNA origami coated with TNFa aptamers ameliorates inflammation indices in a DTHR mouse model. (a) Schematic illustration of TNCB-induced DTHR in humanized TNFa mice with two different treatment regimens, preventative (i.e., treatment is administered before the challenge with the hapten) and therapeutic (i.e., treatment is administered following the challenge) as indicated. (b) Ear thickness measurements before and at the indicated time points after TNCB challenge of nonsensitized mice (healthy), untreated TNCB-sensitized mice (vehicle), long rod-treated TNCB-sensitized mice, or infliximab-treated TNCB-sensitized mice. Both vehicle and healthy mouse groups were injected in their right ear with the buffer in which the long rod was dissolved in. All treatments were administered in mice sensitized with TNCB and challenged with TNCB, either before or after the challenge, as indicated. Long rod − / + TNFa aptamer was injected into the mouse right ear; infliximab was injected intravenously.Sensitization and challenge were performed as indicated in the method section. Data presented are the mean values ± SEM from two independent experiments, n = 4. Significance was determined by ANOVA with Tukey's multiple comparison test, and is indicated by asterisks (*P < 0.03; **P < 0.008; ns not significant). (c) Representative histopathological images of ear sections from the indicated mouse groups. All ear sections were fixed 72 h after ear challenge followed by hematoxylin and eosin staining. Red arrows indicate an increase of the dermis (healthy group), or the epidermis (vehicle group); yellow arrows indicate inflammatory infiltration; green arrows indicate crust formation. All scale bars are 200 µm.

References

    1. Gilead Announces Partial Clinical Hold for Studies Evaluating Magrolimab in Combination With Azacitidine. https://www.gilead.com/news-and-press/press-room/press-releases/2022/1/g....
    1. Craveiro NS, Lopes BS, Tomás L, Almeida SF. Drug withdrawal due to safety: A review of the data supporting withdrawal decision. Curr. Drug Saf. 2020;15:4–12. doi: 10.2174/1574886314666191004092520. - DOI - PubMed
    1. Chames P, Van Regenmortel M, Weiss E, Baty D. Therapeutic antibodies: Successes, limitations and hopes for the future. Br. J. Pharmacol. 2009;157:220–233. doi: 10.1111/j.1476-5381.2009.00190.x. - DOI - PMC - PubMed
    1. Steinitz M. Three decades of human monoclonal antibodies: Past, present and future developments. Hum. Antibodies. 2009;18:1–10. doi: 10.3233/HAB-2009-0196. - DOI - PubMed
    1. Teillaud J-L. Engineering of monoclonal antibodies and antibody-based fusion proteins: successes and challenges. Expert Opin. Biol. Ther. 2005;5(Suppl 1):S15–27. doi: 10.1517/14712598.5.1.S15. - DOI - PubMed