. 2023 Nov 10;6(1):1143.
doi: 10.1038/s42003-023-05475-w.

Mining cancer genomes for change-of-metabolic-function mutations

Affiliations

Mining cancer genomes for change-of-metabolic-function mutations

Kevin J Tu et al. Commun Biol. .

Abstract

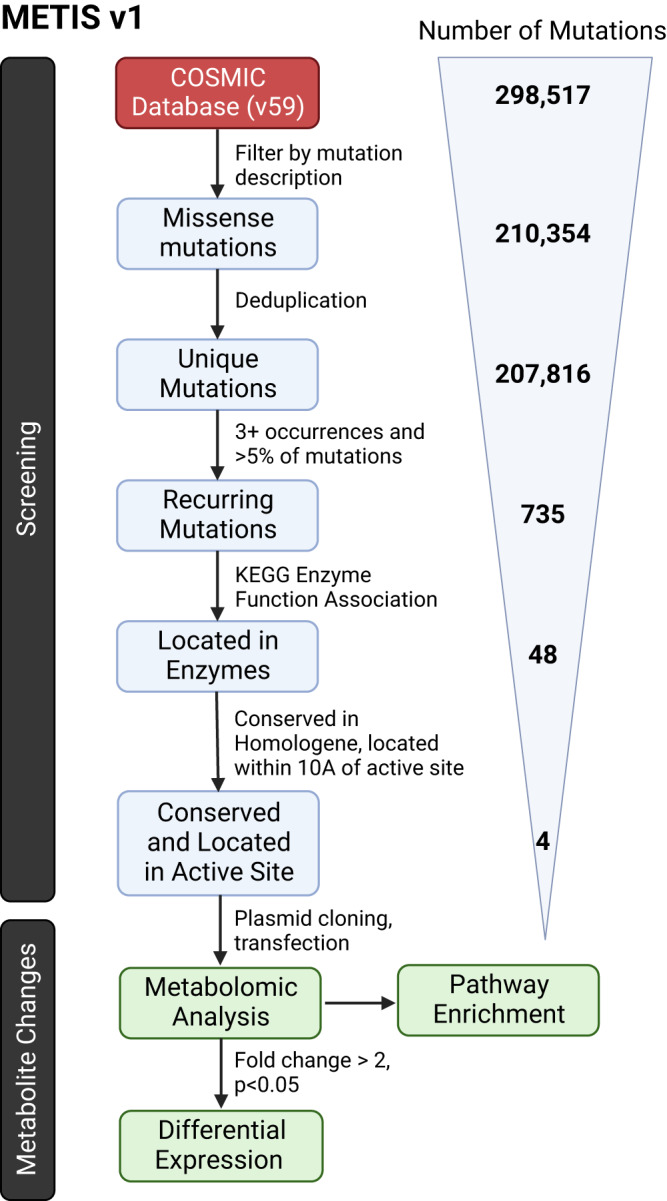
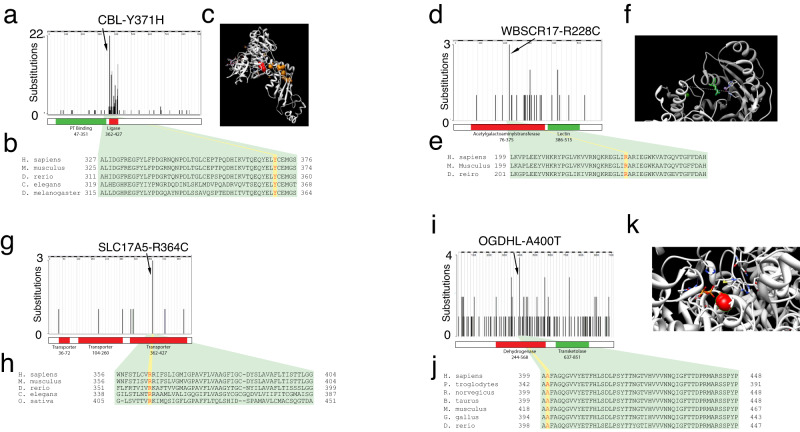
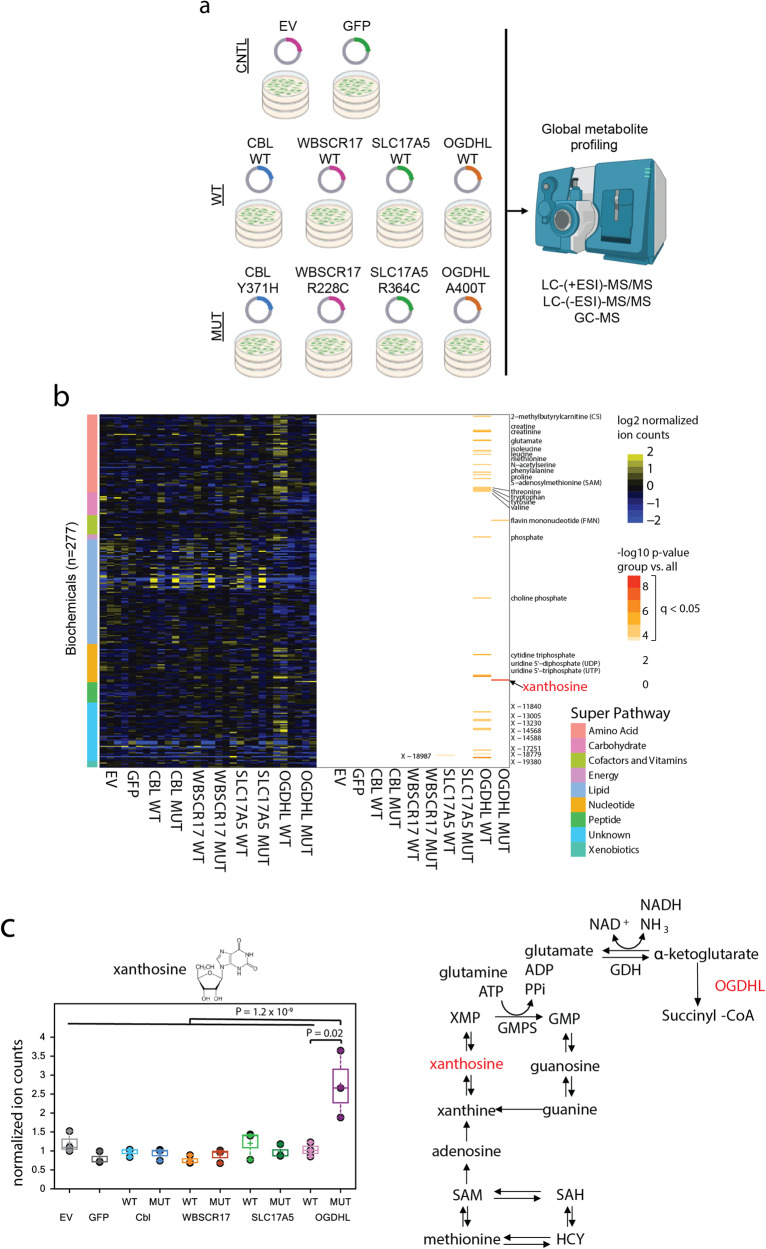
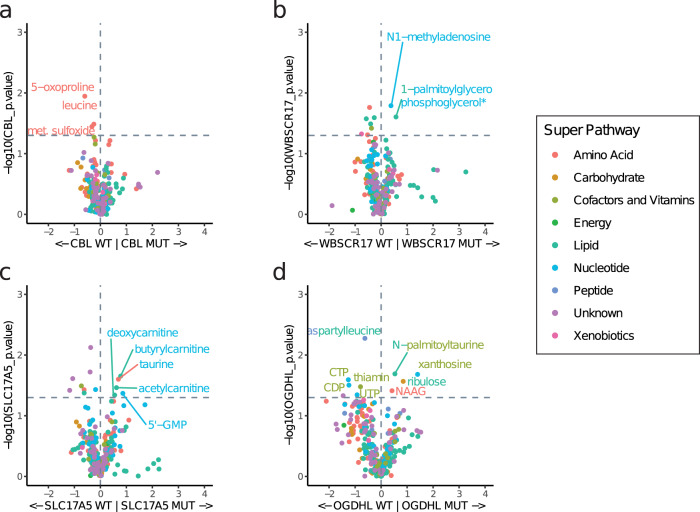
Enzymes with novel functions are needed to enable new organic synthesis techniques. Drawing inspiration from gain-of-function cancer mutations that functionally alter proteins and affect cellular metabolism, we developed METIS (Mutated Enzymes from Tumors In silico Screen). METIS identifies metabolism-altering cancer mutations using mutation recurrence rates and protein structure. We used METIS to screen 298,517 cancer mutations and identify 48 candidate mutations, including those previously identified to alter enzymatic function. Unbiased metabolomic profiling of cells exogenously expressing a candidate mutant (OGDHLp.A400T) supports an altered phenotype that boosts in vitro production of xanthosine, a pharmacologically useful chemical that is currently produced using unsustainable, water-intensive methods. We then applied METIS to 49 million cancer mutations, yielding a refined set of candidates that may impart novel enzymatic functions or contribute to tumor progression. Thus, METIS can be used to identify and catalog potentially-useful cancer mutations for green chemistry and therapeutic applications.


Conflict of interest statement

The authors declare the following competing interests: ZJR holds patents that are managed by the Office of Licensing and Ventures at Duke University that relate to cancer-derived enzyme redesign (US8691960B2). The other authors declare no competing interests.

Figures

Fig. 1
Fig. 1. METIS pipeline to identify COMF mutations in cancer mutational data.
Schematic showing pipeline, with number of mutations filtered at each step.
Fig. 2
Fig. 2. COMF candidates nominated by METIS.
a CBL mutational distribution in COSMIC v59 showing recurrent Y371H mutations. b Multiple alignment with Y371 shown in red. c Structure of human CBL-UBCH7 complex (PDB: 1FBV) with Y371 shown in red, other recurrently-mutated residues shown in orange, and ligands shown in stick representations. d WBSCR17 mutational distribution in COSMIC v59 showing recurrent R228C mutations. e Homology alignment for WBSCR17 with R228 shown in red. f Structure of mouse homolog of WBSCR17 (PDB: 1XHB) with R228 in active site pocket shown in green. g SLC17A5 mutational distribution in COSMIC v59 with recurrent R364C mutations. h Multiple alignment of SLC17A5 R364 region with R364 shown in red. i OGDHL mutational distribution in COSMIC v59 with recurrent A400T mutations shown. j Multiple alignment of OGDHL with A400 shown in red. k Structure of SucA domain of Mycobacterium smegmatis alpha-ketoglutarate decarboxylase in complex with acetyl-CoA (PDB: 2XTA) with residue homologous to A400 shown in red with ligand shown in stick representation. Primary enzymatic function domains are represented by red boxes while secondary functions are represented by green boxes underneath the mutation plot.
Fig. 3
Fig. 3. Global metabolite profiling to identify biochemicals perturbed by candidate mutants.
a Schematic of experiment showing cells transfected with indicated mutants, their analogous WT constructs, and empty vector (EV) or GFP controls. b Heat map showing 277 unique biochemicals as rows. Color key on left indicates biochemical super pathway. Heat map on left shows normalized ion counts for n = 3 independent transfection replicates for each construct (columns). Heat map on right shows biochemicals with a significant difference when compared between one group and all other groups (-log10 of q-value for Welch’s t-test with Bonferroni correction). Biochemicals with q < 0.05 for any comparison are named on the right of the heat map. The biochemical with the most significant q-value named in red (xanthosine). Unique biochemicals of unknown structure are denoted by X-. c Normalized ion counts for xanthosine for n = 3 independent transfection replicates are shown on left with Welch’s t test p-value shown for comparisons between OGDHL-MUT and OGDHL-WT and for OGDHL-MUT vs. all other samples. Metabolic pathway for purine degradation and S-adenosyl-methionine (SAM)-mediated xanthosine production shown on right.
Fig. 4
Fig. 4. Comparisons between candidate COMF metabolomes and WT controls.
Volcano plots show fold-change (x-axis) and p-value (Welch’s t-test, y-axis) for biochemical abundance in cells expressing each mutant (n = 3 biological replicates) compared to the respective wild type (WT) controls (n = 3 biological replicates). a CBL Y371H (MUT) vs. wild type (WT); b WBSCR17 (MUT) vs. wild type (WT)R228C; c SLC17A5 R364C (MUT) vs. wild type (WT); d OGDHL A400T (MUT) vs. wild type (WT). Biochemicals are colored based on metabolic super pathway. Significant metabolites increased in the mutant group (P < 0.05, Welch’s t test, without FDR correction) and select metabolites increased in the WT groups are called out.
Fig. 5
Fig. 5. Second-generation pipeline to identify COMF mutations in cancer mutational data.
a Number of total missense mutations by year. b Number of 3 + , 4 + , … 9 + , 12+ recurrent mutations with COSMIC v59 (left) vs. COSMIC v96 (right) mutational data evaluated using METIS. An exponential Malthusian growth regression was used. c Schematic showing pipeline, with number of mutations filtered at each step.
Fig. 6
Fig. 6. COMF enzymatic candidates nominated by METIS2.
a DAO mutational distribution in COSMIC v96 showing recurrent R283W mutations. b Multiple alignment with R283 shown in red. c Predicted structure of human DAO complex with R283 highlighted. df Same for MICAL2-L99F. gi Same for SMPD3-D638A. jl Same for SMPD3-H639P. Primary enzymatic function domains are represented by red boxes while secondary functions are represented by green boxes underneath the mutation plot. Enzymes without currently defined domains are annotated as such.

References

    1. Balss J, et al. Spastic paraparesis as a manifestation of metabolic vitamin B12 deficiency: a case report. Acta Neuropathol. (Berl.) 2008;116:597–602. doi: 10.1007/s00401-008-0455-2. - DOI - PubMed
    1. Yan H, et al. IDH1andIDH2Mutations in Gliomas. N. Engl. J. Med. 2009;360:765–773. doi: 10.1056/NEJMoa0808710. - DOI - PMC - PubMed
    1. Zhao S, et al. Glioma-derived mutations in IDH1 dominantly inhibit IDH1 catalytic activity and induce HIF-1alpha. Science. 2009;324:261–265. doi: 10.1126/science.1170944. - DOI - PMC - PubMed
    1. Dang L, et al. Cancer-associated IDH1 mutations produce 2-hydroxyglutarate. Nature. 2009;462:739–744. doi: 10.1038/nature08617. - DOI - PMC - PubMed
    1. Reitman ZJ, et al. Profiling the effects of isocitrate dehydrogenase 1 and 2 mutations on the cellular metabolome. Proc. Natl Acad. Sci. 2011;108:3270–3275. doi: 10.1073/pnas.1019393108. - DOI - PMC - PubMed

Publication types