. 2023 Nov 11;20(1):50.
doi: 10.1186/s12014-023-09441-w.

A pathway activity-based proteomic classifier stratifies prostate tumors into two subtypes

Affiliations

A pathway activity-based proteomic classifier stratifies prostate tumors into two subtypes

Rui Sun et al. Clin Proteomics. .

Abstract

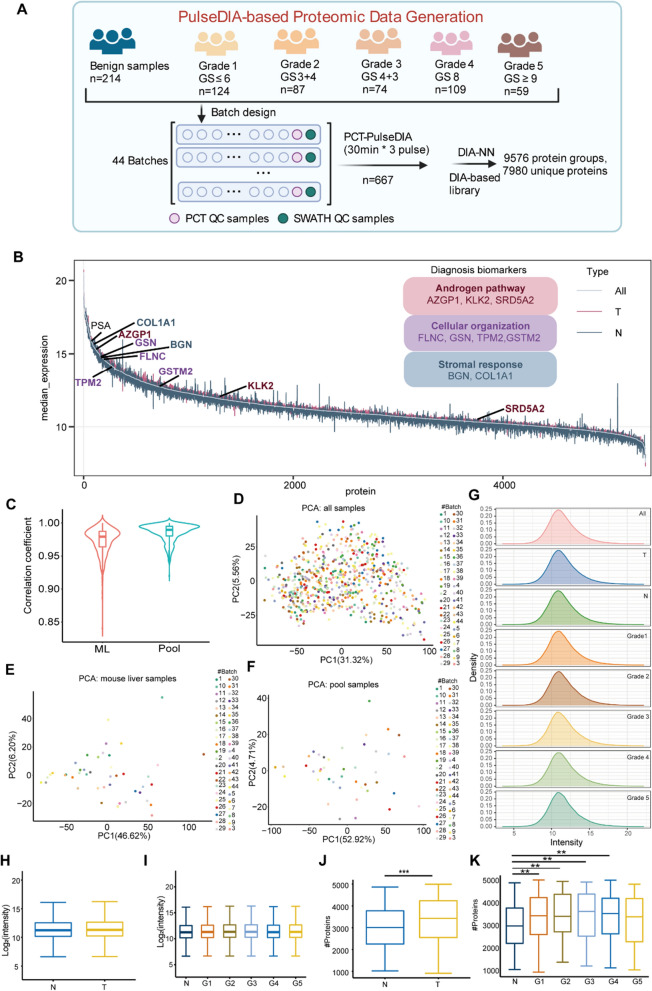
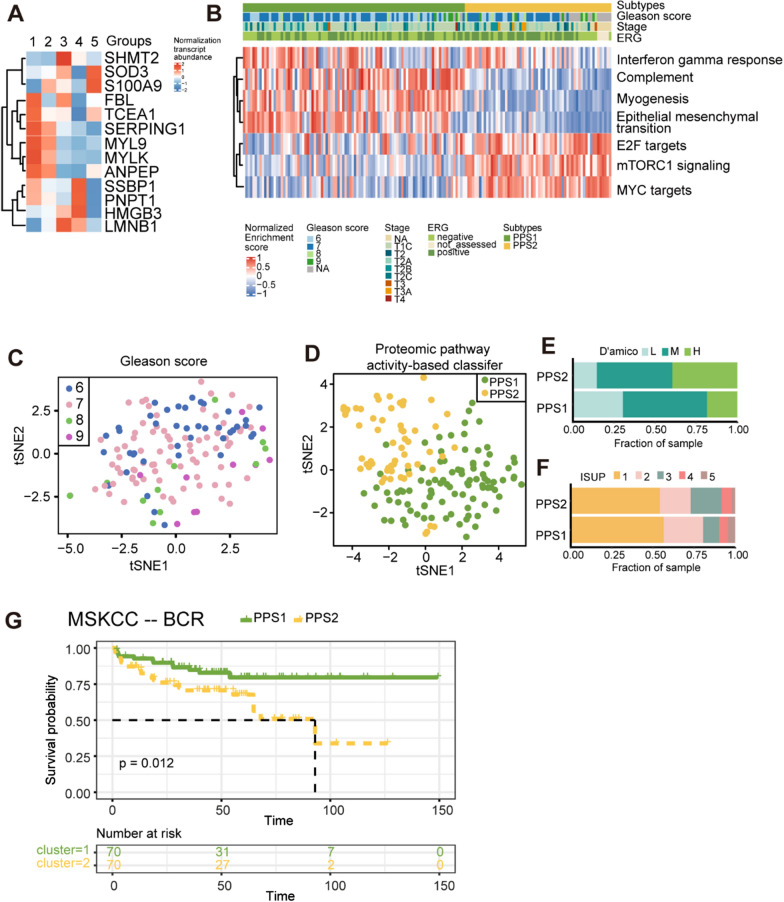
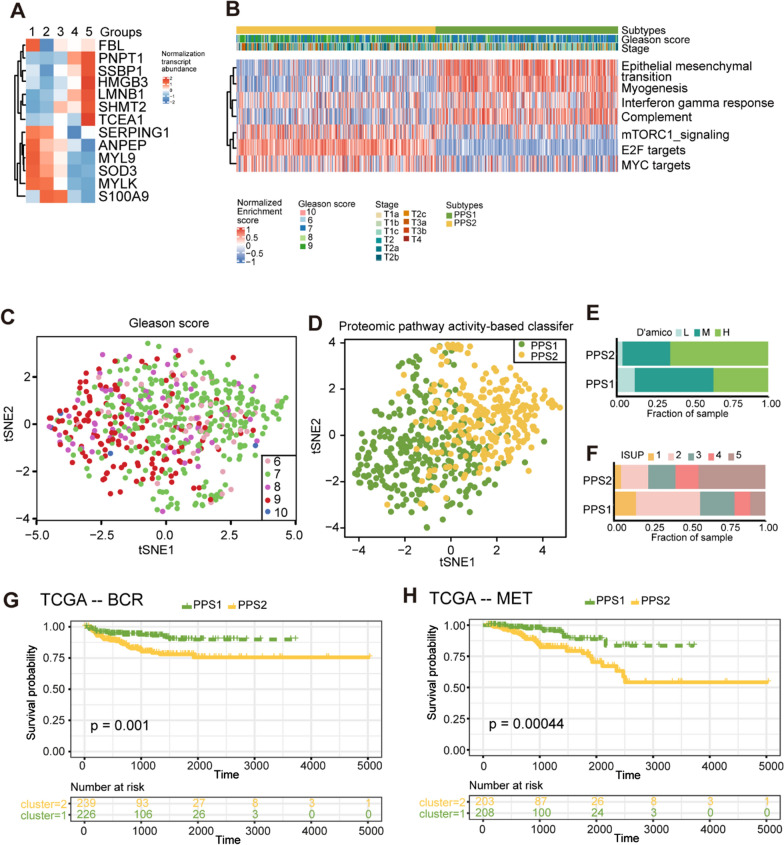
Prostate cancer (PCa) is the second most common cancer in males worldwide. The risk stratification of PCa is mainly based on morphological examination. Here we analyzed the proteome of 667 tumor samples from 487 Chinese PCa patients and characterized 9576 protein groups by PulseDIA mass spectrometry. Then we developed a pathway activity-based classifier concerning 13 proteins from seven pathways, and dichotomized the PCa patients into two subtypes, namely PPS1 and PPS2. PPS1 is featured with enhanced innate immunity, while PPS2 with suppressed innate immunity. This classifier exhibited a correlation with PCa progression in our cohort and was further validated by two published transcriptome datasets. Notably, PPS2 was significantly correlated with poor biochemical recurrence (BCR)/metastasis-free survival (log-rank P-value < 0.05). The PPS2 was also featured with cell proliferation activation. Together, our study presents a novel pathway activity-based stratification scheme for PCa.

Keywords: BCR-free survival; Prostate cancer; Proteomic pathway-based classifier; PulseDIA.


Conflict of interest statement

T.G. is a shareholder of Westlake Omics Inc. L.T. is an employee of Westlake Omics Inc. The other authors declare no competing interests in this paper.

Figures

Fig. 1
Fig. 1
A Study design of the molecular classification for PCa. A total of 453 FFPE prostate tissue samples from 5 different ISUP grades and 214 benign samples were used for proteomic analysis. B The median protein abundance of each protein across all samples. C The Pearson correlation distribution of the quality control samples including the mouse liver (ML) samples and pool PCa samples. DF PCA plots for 44 batches, including all samples (D), ML samples (E), and pool PCa samples (F). G Density plot for each PCa type. HI Protein quantification between different ISUP grades (H) and sample types (I). JK The number of proteins identified in the tumor and adjacent benign samples (J), and in the different ISUP grades (K). P-value: * < 0.05; ** < 0.01; *** < 0.001. T, tumor samples; N, adjacent benign samples
Fig. 2
Fig. 2
Proteomic pathway-based classifier. A Heatmap of 28 overlapping proteins that were significantly differentially expressed between tumor and adjacent benign samples (B-H adjusted P-value < 0.05, fold change > 2 or < 0.5), and 4 clusters (cluster 2, 5, 8, 10 in Additional file 2: Figure S1B) from mFuzz analysis (one-way ANOVA, B-H adjusted P-value < 0.05). Proteins that exhibit an increasing trend with ISUP grades are indicated by the color red, while those with a decreasing trend are represented by blue. Proteins that were not detected in our dataset are denoted by gray. Different shapes reflects the diverse biological functions of the proteins. B The protein–protein interaction network of the 28 proteins from STRING. C An unsupervised classifier based on proteomic pathways. DE The t-SNE shows the distribution of all tumor samples using ISUP standard and the pathway-based classifier. The classifier was based on the selected 13 proteins shown in Fig. 2A. F The overlay of proteomic pathway-based subtypes using the ISUP classification standard for PCa
Fig. 3
Fig. 3
The validation of the proteomic pathways-based classifier in the MSKCC dataset. A Heatmap showing the expression of 13 transcripts. The expression of transcript was normalized by Z-score across all PCa patients. B Unsupervised classification based on 13 transcripts enriched pathways at the transcriptomic level. CD The t-SNE plots show the distribution of all tumor samples based on the ISUP standard and the pathway-based classifier utilizing the selected 13 transcripts, as depicted in Fig. 3A. EF Overlay of proteomic-pathway-based subtypes with D’amico (E) and ISUP (F) classification standard for PCa. G Kaplan–Meier curves for the BCR-free survival between the two subtypes
Fig. 4
Fig. 4
The validation of the proteomic pathways-based classifier in the TCGA dataset. A Heatmap showing the expression of 13 transcripts. The expression of transcript was normalized by Z-score across all PCa patients. B Unsupervised classification based on 13 transcripts enriched pathways at the transcriptomic level. CD The t-SNE plots show the distribution of all tumor samples based on the ISUP standard and the pathway-based classifier utilizing the selected 13 transcripts, as depicted in Fig. 4A. EF Overlay of proteomic-pathway-based subtypes with D’amico (E) and ISUP (F) classification standard for PCa. GH Kaplan–Meier curves for the BCR-free (G) and metastasis-free (H) survival between the two subtypes

References

    1. Sung H, Ferlay J, Siegel RL, Laversanne M, Soerjomataram I, Jemal A, et al. Global cancer statistics 2020: GLOBOCAN estimates of incidence and mortality worldwide for 36 cancers in 185 countries. CA Cancer J Clin. 2021;71(3):209–249. doi: 10.3322/caac.21660. - DOI - PubMed
    1. Epstein JI, Egevad L, Amin MB, Delahunt B, Srigley JR, Humphrey PA, et al. The 2014 International Society of Urological Pathology (ISUP) Consensus Conference on Gleason Grading of Prostatic Carcinoma: Definition of Grading Patterns and Proposal for a New Grading System. Am J Surg Pathol. 2016;40(2):244–52. - PubMed
    1. Erickson A, Sandeman K, Lahdensuo K, Nordling S, Kallajoki M, Seikkula H, et al. New prostate cancer grade grouping system predicts survival after radical prostatectomy. Hum Pathol. 2018;75:159–166. doi: 10.1016/j.humpath.2018.01.027. - DOI - PubMed
    1. Allsbrook WC, Jr, Mangold KA, Johnson MH, Lane RB, Lane CG, Amin MB, et al. Interobserver reproducibility of Gleason grading of prostatic carcinoma: urologic pathologists. Hum Pathol. 2001;32(1):74–80. doi: 10.1053/hupa.2001.21134. - DOI - PubMed
    1. Melia J, Moseley R, Ball RY, Griffiths DF, Grigor K, Harnden P, et al. A UK-based investigation of inter- and intra-observer reproducibility of Gleason grading of prostatic biopsies. Histopathology. 2006;48(6):644–654. doi: 10.1111/j.1365-2559.2006.02393.x. - DOI - PubMed

LinkOut - more resources