. 2023 Nov 10;15(1):95.
doi: 10.1186/s13073-023-01250-y.

Skeletal muscle regeneration failure in ischemic-damaged limbs is associated with pro-inflammatory macrophages and premature differentiation of satellite cells

Affiliations

Skeletal muscle regeneration failure in ischemic-damaged limbs is associated with pro-inflammatory macrophages and premature differentiation of satellite cells

Kevin W Southerland et al. Genome Med. .

Abstract

Background: Chronic limb-threatening ischemia (CLTI), a severe manifestation of peripheral arterial disease (PAD), is associated with a 1-year limb amputation rate of approximately 15-20% and substantial mortality. A key feature of CLTI is the compromised regenerative ability of skeletal muscle; however, the mechanisms responsible for this impairment are not yet fully understood. In this study, we aim to delineate pathological changes at both the cellular and transcriptomic levels, as well as in cell-cell signaling pathways, associated with compromised muscle regeneration in limb ischemia in both human tissue samples and murine models of CLTI.

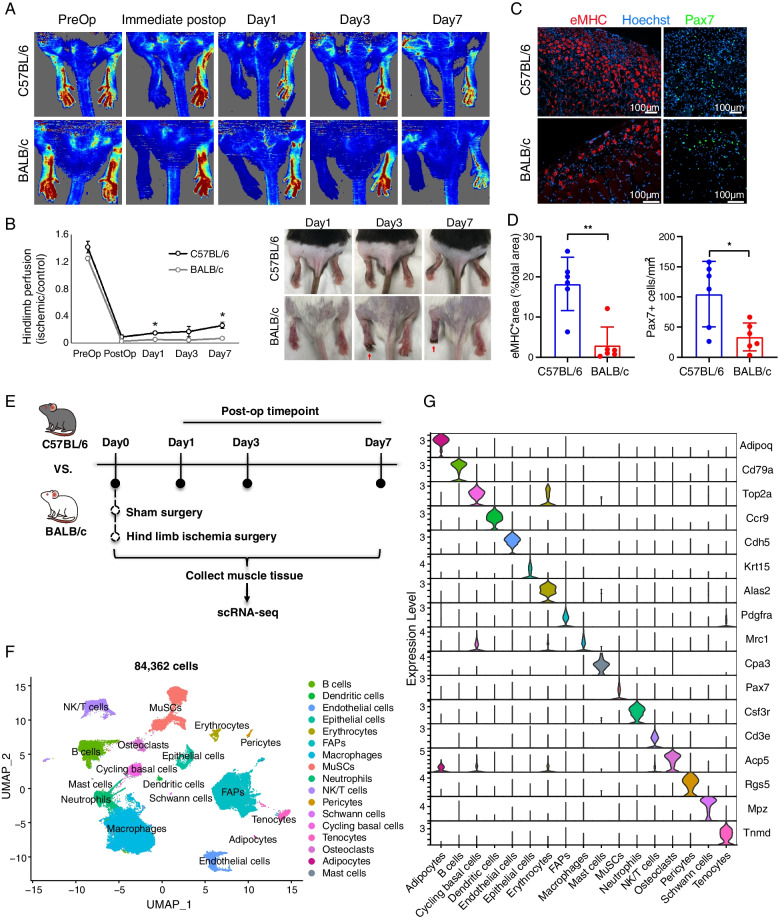
Methods: We performed single-cell transcriptome analysis of ischemic and non-ischemic muscle from the same CLTI patients and from a murine model of CLTI. In both datasets, we analyzed gene expression changes in macrophage and muscle satellite cell (MuSC) populations as well as differential cell-cell signaling interactions and differentiation trajectories.

Results: Single-cell transcriptomic profiling and immunofluorescence analysis of CLTI patient skeletal muscle demonstrated that ischemic-damaged tissue displays a pro-inflammatory macrophage signature. Comparable results were observed in a murine CLTI model. Moreover, integrated analyses of both human and murine datasets revealed premature differentiation of MuSCs to be a key feature of failed muscle regeneration in the ischemic limb. Furthermore, in silico inferences of intercellular communication and in vitro assays highlight the importance of macrophage-MuSC signaling in ischemia induced muscle injuries.

Conclusions: Collectively, our research provides the first single-cell transcriptome atlases of skeletal muscle from CLTI patients and a murine CLTI model, emphasizing the crucial role of macrophages and inflammation in regulating muscle regeneration in CLTI through interactions with MuSCs.

Keywords: Chronic limb-threatening ischemia; Macrophage polarization; Murine hindlimb ischemia; Muscle satellite cells; Peripheral arterial disease; Single-cell transcriptome analysis; Skeletal muscle regeneration.


Conflict of interest statement

The authors declare that they have no competing interests.

Figures

Fig. 1
Fig. 1
Single-cell transcriptional profiling of human CLTI patients’ limb muscle in non-ischemic versus ischemic conditions. A Schematic diagram illustrating the generation of scRNA-seq datasets using proximal and distal tissue from human CLTI skeletal muscle. B Uniform manifold approximation projection (UMAP) visualization showing cell populations (n = 16,201) from non-ischemic and ischemic tissues of CLTI patients (n = 3 donors, paired proximal and distal tissues were analyzed). C Dot plot displaying the expression of marker genes for each cell population. Dot size represents the percentage of cells that positively detect the transcripts, and the color scale indicates average expression levels. D, E UMAP visualization of macrophages in proximal (blue, non-ischemic) and distal (pink, ischemic) skeletal muscle (D) and sub-clusters (E, C0-C8). F Top five Gene Ontology (GO) terms enriched by differentially expressed genes (P-value < 0.05 & |log2FoldChange| > 0.25) between distal (pink, ischemic) clusters (1 and 2) and proximal (blue, non-ischemic) cluster (0). Pink and blue bars represent the GO terms enriched in distal and proximal conditions, respectively. G Feature plots showing the expression of pro-inflammatory genes in macrophages. H Quantification of representative pro-inflammatory gene expression in proximal versus distal macrophages. Adjusted p-values (adj.P) and log fold changes of average expression (avg.log2FC) were calculated by Wilcoxon rank-sum test. I Quantification of CD11b+/CD206+ and CD11b+/CD206- macrophages in ischemic and non-ischemic CLTI patient muscle specimens. P values were calculated by paired Wilcoxon rank-sum test
Fig. 2
Fig. 2
Single-cell RNA-seq analysis of hind limb ischemia (HLI) surgery induced limb muscle regeneration and damage responses in C57BL/6 and BALB/c mice. A Perfusion imaging of C57BL/6 (top) and BALB/c (bottom) mouse strains before and after HLI surgery (Pre-operatively and Post-operatively, respectively) and on post-op days 1, 3, and 7. B (Left) Quantification of limb perfusion as determined by perfusion imaging at indicated timepoints. Left hindlimb (HLI surgery) perfusion normalized to right hindlimb perfusion for each mouse. n = 3 per mouse strain, per timepoint. *p < 0.01. (Right) Representative images of mice on post-op days 1, 3, and 7 following HLI surgery. Red arrow indicates ischemic changes apparent on post-op days 3 and 7 in BALB/c mice. C Representative immunofluorescence staining images of mice on post-op day 7 following HLI surgery. eMHC (red) indicates regenerated muscle fibers; Pax7 (green) indicates satellite cells. D Quantification of eMHC+ area (left panel) and Pax7+ cell counts (right panel) shown in C. n = 6 mice per group. Data expressed as mean ± SEM. *p ≤ 0.05, **p ≤ 0.01. E Experimental design of mice scRNA-seq analysis of mouse models of HLI (n = 2 per mouse strain, per timepoint). F UMAP visualization of the scRNA-seq atlas assembled from all samples and time points. G The expression of cell type marker genes used for each cell type/cluster annotated in F
Fig. 3
Fig. 3
scRNA-seq analyses reveals that the pro-inflammatory macrophages are enriched in the BALB/c limb following HLI surgery. A UMAP plots illustrating the distribution of macrophages (depicted in blue) and other cells (depicted in grey) from C57BL/6 and BALB/c mice at specified time intervals. The left UMAP plot aggregates all cells from the two strains across all time points. In the right-hand UMAP plots, macrophages for the distinct time points and individual strains are highlighted in blue, while all remaining cells are represented in grey. B The inflammatory gene module score is high in cluster 5 cells, which are specific to BALB/c mice. Red color indicates high gene module score. C GSEA enrichment analysis reveals that M1 macrophage markers are highly expressed in BALB/c macrophages, while M2 macrophage markers are highly expressed in C57BL/6 macrophages. Macrophage gene expression patterns are assessed using scRNA-seq data. D Dot plot showing differentially expressed genes in macrophages between C57BL/6 and BALB/c mice on day 3 post-ischemia. Dot size represents -log10 FDR; color scale indicates log2-fold change in gene expression. Pink and blue colors indicate genes upregulated in C57BL/6 and BALB/c, respectively. E Volcano plot displaying differentially expressed genes from bulk RNA-seq analysis of macrophages purified from BALB/c and C57BL/6 mice at 3 days post-HLI. Red and blue dots represent upregulated genes in C57BL/6 and BALB/c mice, respectively. F: Genome browser snapshots showcasing bulk RNA-seq data at specified gene loci in macrophages derived from both strains on day 3 post-injury. Two biological replicates (rep1, rep2) are included for each condition. G Top five GO terms enriched by differentially expressed genes (FDR < 0.05, log2FoldChange>1) from panel E. Red and blue bars correspond to GO terms enriched in C57BL/6 and BALB/c mice, respectively
Fig. 4
Fig. 4
MuSCs/MPCs in BALB/c mice undergo precocious differentiation after HLI surgery. A UMAP representation displaying quiescent (depicted in yellow), activated/proliferative (in blue), and differentiating (in pink) muscle stem cells (MuSCs) and muscle precursor cells (MPCs). Total MuSC/MPC count stands at 9,217. B MuSCs/MPCs from part A are arranged in a pseudotime sequence, initiating from quiescent cells (left) and advancing to activated/proliferative (middle) and subsequently to differentiating cells (right). The heatmap's color gradient represents the expression intensity of the specified genes in MuSCs/MPCs in accordance with the pseudotime progression. C (Top) Violin plot showing the distribution of quiescent (depicted in yellow), activated/proliferative (in blue), and differentiating (in pink) MuSCs/MPCs in the two strains along the pseudotime trajectory shown in B. (Bottom) Curve plot showing the distribution of MuSC/MPCs at indicated time points, before (sham) and 1, 3, and 7 dpi post-HLI, in the two mouse strains along the pseudotime trajectory shown in B. D Gene set enrichment analysis (GSEA) highlighting the genes related to “skeletal muscle cell proliferation” are significantly enriched in the up-regulated genes in MuSCs/MPCs in C57BL/6 mice compared to those in BALB/c mice. E, F At 7 dpi, TA muscles were collected from both C57BL/6 and BALB/c for immunostaining using antibodies against Pax7 and cell proliferation marker Mki67. E n = 5 mice per strain. Data expressed as mean ± SEM. *p ≤ 0.05, **p ≤ 0.01. F Representative Pax7 (red) and Mki67 (green) immunofluorescence staining images along with DAPI (blue). G Representative RNAscope data showing that Adgre1+ macrophages (F4/80, green) and Myod1+ MuSC/MPCs (red) are spatially proximal to each other in the limb muscle of BALB/c and C57BL/6 mice at day 3 after HLI. Three mice per strain were used for RNAscope analysis. H Inferred ligand-receptor interactions between macrophages and MuSCs in BALB/c and C57BL/6 following HLI at 3 days post HLI surgery. I IGF1 promotes proliferation of primary MPCs purified from BALB/c and C57BL/6 strains. (Left) Representative images of EdU incorporation by C57BL/6 and BALB/c primary MPCs cultured with or without recombinant IGF1 for 72 h. EdU was added to the culture medium 6 h prior to cell fixation and imaging. Nuclei stained with Hoechst. Arrows indicate EdU+ cells. (Right) Quantification of the percentage of EdU+ cells for the indicated strains and treatment conditions. *P < 0.05, **P < 0.005
Fig. 5
Fig. 5
Increased pro-inflammatory signaling pathways between macrophages and MuSC/MPCs is associated with premature differentiation phenotype of MuSC/MPCs in the ischemia-damaged human limb of CLTI patients. A, B UMAP visualization presenting single-cell data gathered from human skeletal muscle tissue samples encompassing 3 CLTI patients under both proximal and distal conditions, along with data from 10 healthy individuals. A A total of 34,950 cells are represented in the UMAP graph. B The cells in clusters 2 and 13, illustrated in purple, exhibit Pax7 (left) and MyoG (right) expression respectively. C Cells from Pax7+ and MyoG+ clusters delineated in B are extracted from total cells and projected with an increased resolution onto a separate UMAP space that contain 5 sub-clusters (cluster 0–4), depicted in different colors. D Within this refined UMAP representation in D, cells in clusters 2 and 4 are denoted as “MPC”, demonstrating the expression of myogenic differentiation markers like MyoG and CKM. Conversely, the cells congregated in clusters 0 and 1 are identified as MuSCs, characterized by the expression of quiescent MuSCs markers Pax7 and Myf5. E The MPC and MuSCs defined in D are separated into healthy (yellow), distal (red), and proximal (blue) conditions for gene expression analyses. Violin plots show the expression of MyoG, MYH3, SPRY1, and CKD6 expression in MPCs (left) and in MuSCs (right), respectively. *P-value < 0.05; **P-value < 0.01. P-values were calculated by the Wilcoxon rank-sum test. F The numbers (left) and interaction strength (right) of inferred signaling interactions calculated by CellChat between macrophages and MuSCs in distal (pink, ischemic) and proximal (blue, non-ischemic) muscles of CLTI patients. G The significant signaling pathways between macrophages and MuSCs/MPCs are ranked based on their inferred strength differences between distal (ischemic) and proximal (non-ischemic) skeletal muscles. Signaling pathways colored in red are enriched in distal muscle, while those colored in blue are enriched in proximal tissues between macrophages and MuSCs/MPCs. H Ligand-receptor interactions inferred by CellPhoneDB between macrophages and MPCs or MuSCs in distal (ischemic) and proximal (non-ischemic) conditions. In distal conditions, we observed stronger pro-inflammatory signaling pathways, such as IL6, CCL4, and SPP1, compared to proximal conditions

Update of

References

    1. Gutierrez JA, Aday AW, Patel MR, Jones WS. Polyvascular disease: reappraisal of the current clinical landscape. Circ Cardiovasc Interv. 2019;12:e007385. doi: 10.1161/CIRCINTERVENTIONS.119.007385. - DOI - PMC - PubMed
    1. Morley RL, Sharma A, Horsch AD, Hinchliffe RJ. Peripheral artery disease. BMJ. 2018;360:j5842. doi: 10.1136/bmj.j5842. - DOI - PubMed
    1. Kullo IJ, Rooke TW. Clinical practice. Peripheral artery disease. N Engl J Med. 2016;374:861–71. doi: 10.1056/NEJMcp1507631. - DOI - PubMed
    1. Fowkes FGR, Aboyans V, Fowkes FJI, McDermott MM, Sampson UKA, Criqui MH. Peripheral artery disease: epidemiology and global perspectives. Nat Rev Cardiol. 2017;14:156–70. doi: 10.1038/nrcardio.2016.179. - DOI - PubMed
    1. Criqui MH, Aboyans V. Epidemiology of peripheral artery disease. Circ Res. 2015;116:1509–26. doi: 10.1161/CIRCRESAHA.116.303849. - DOI - PubMed

Publication types