. 2023 Nov 28;42(11):113425.
doi: 10.1016/j.celrep.2023.113425. Epub 2023 Nov 10.

Bcl6 is a subset-defining transcription factor of lymphoid tissue inducer-like ILC3

Affiliations

Bcl6 is a subset-defining transcription factor of lymphoid tissue inducer-like ILC3

Roser Tachó-Piñot et al. Cell Rep. .

Abstract

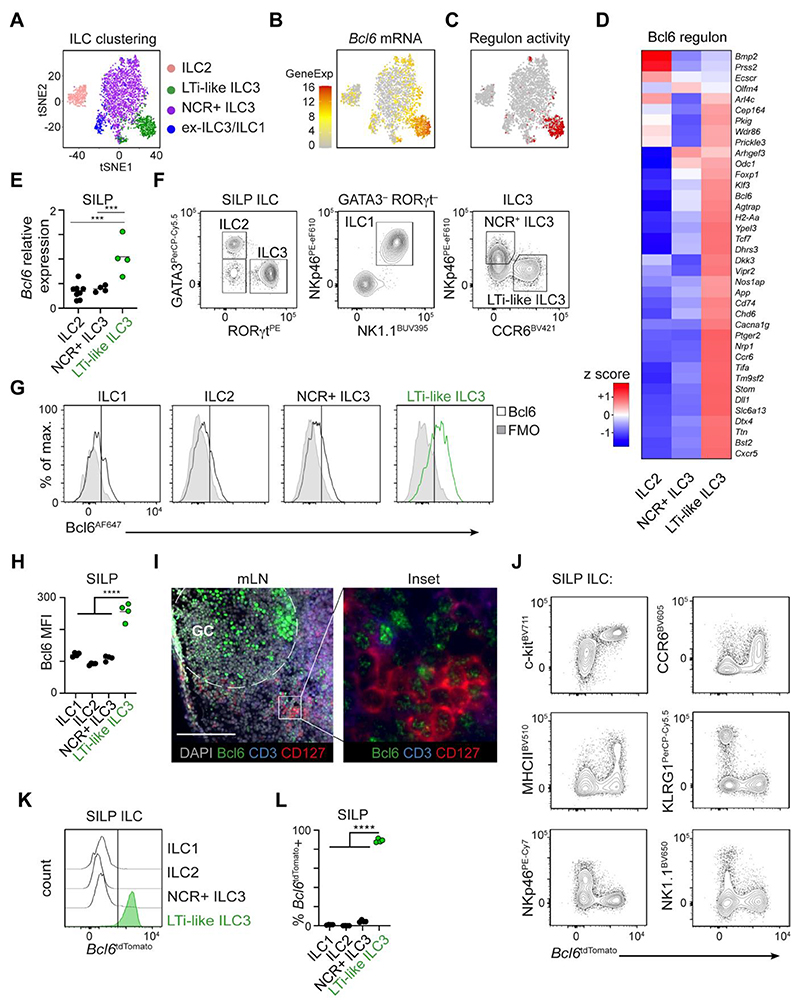
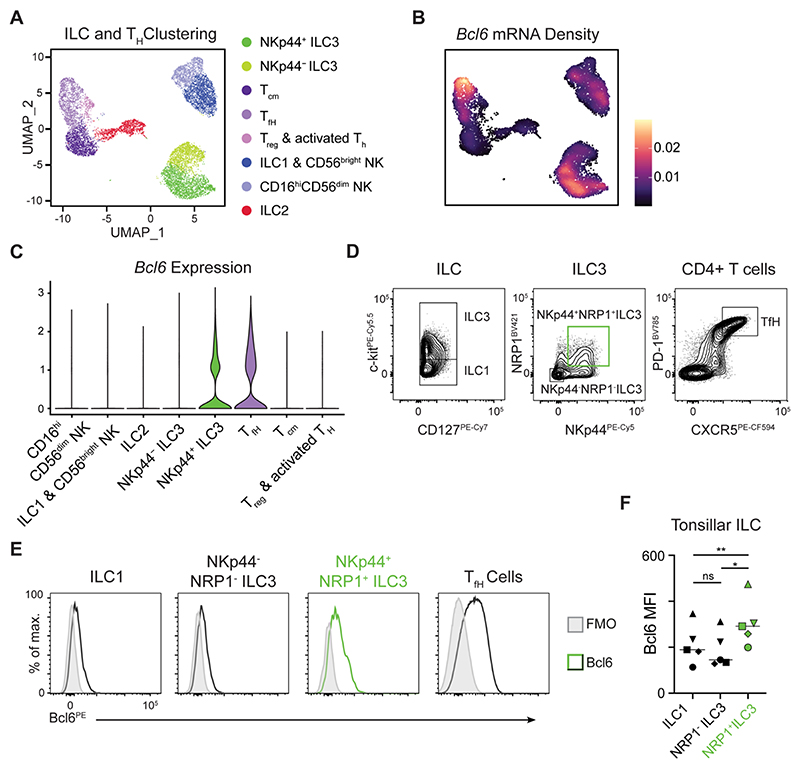
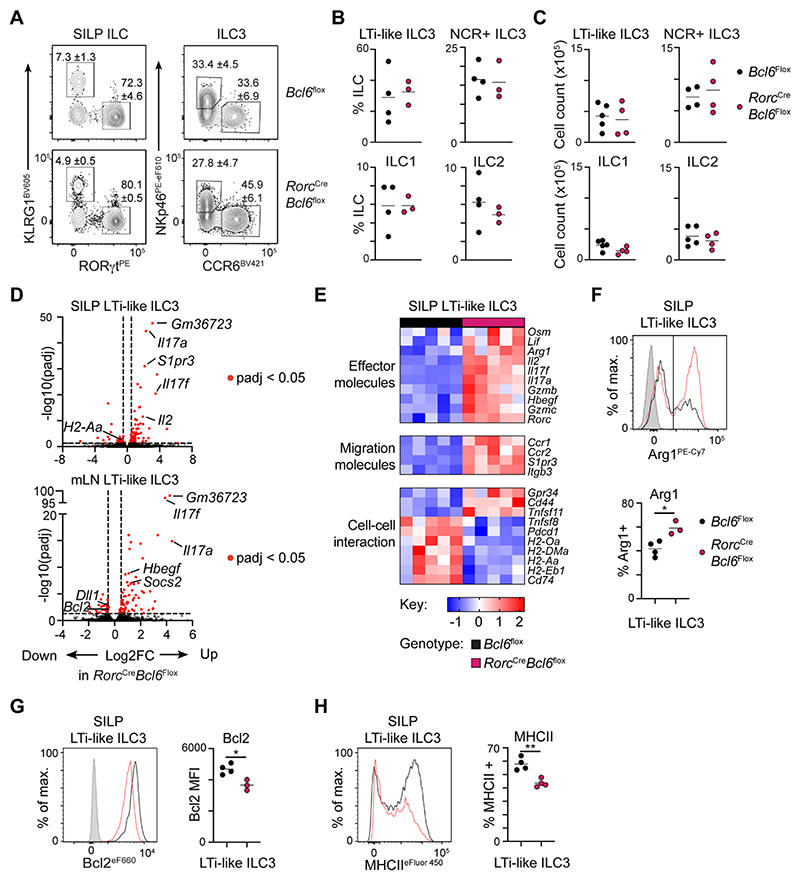
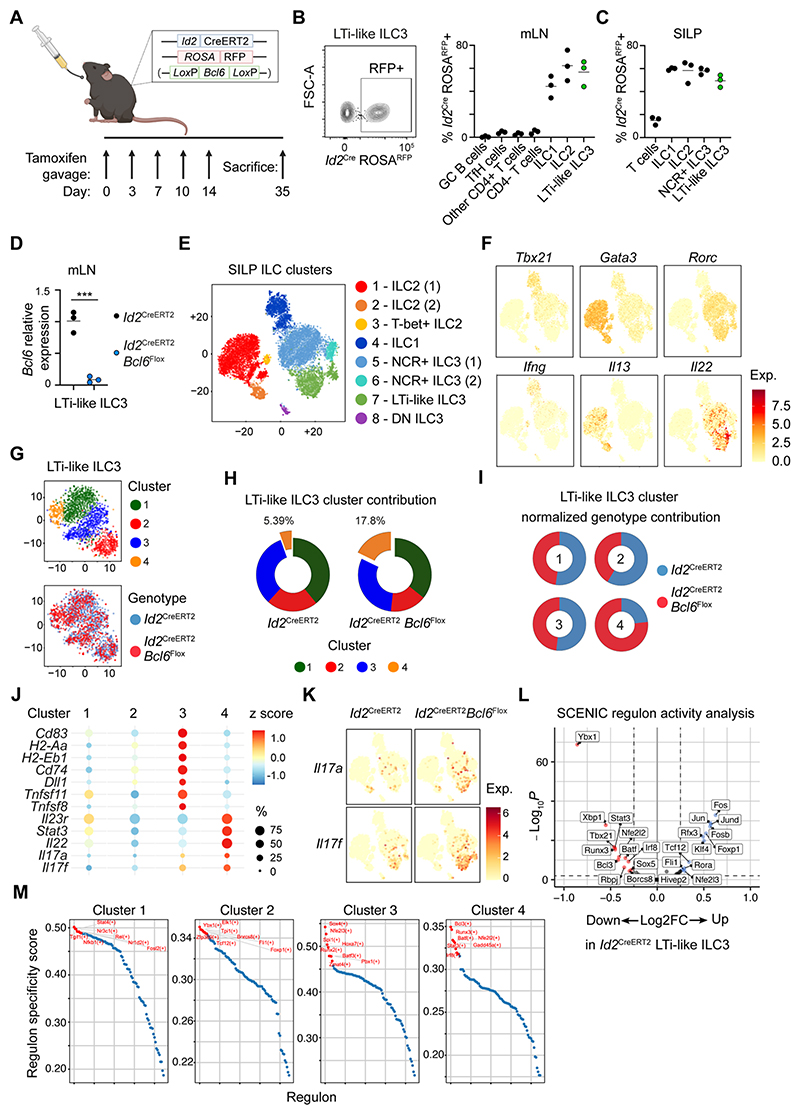
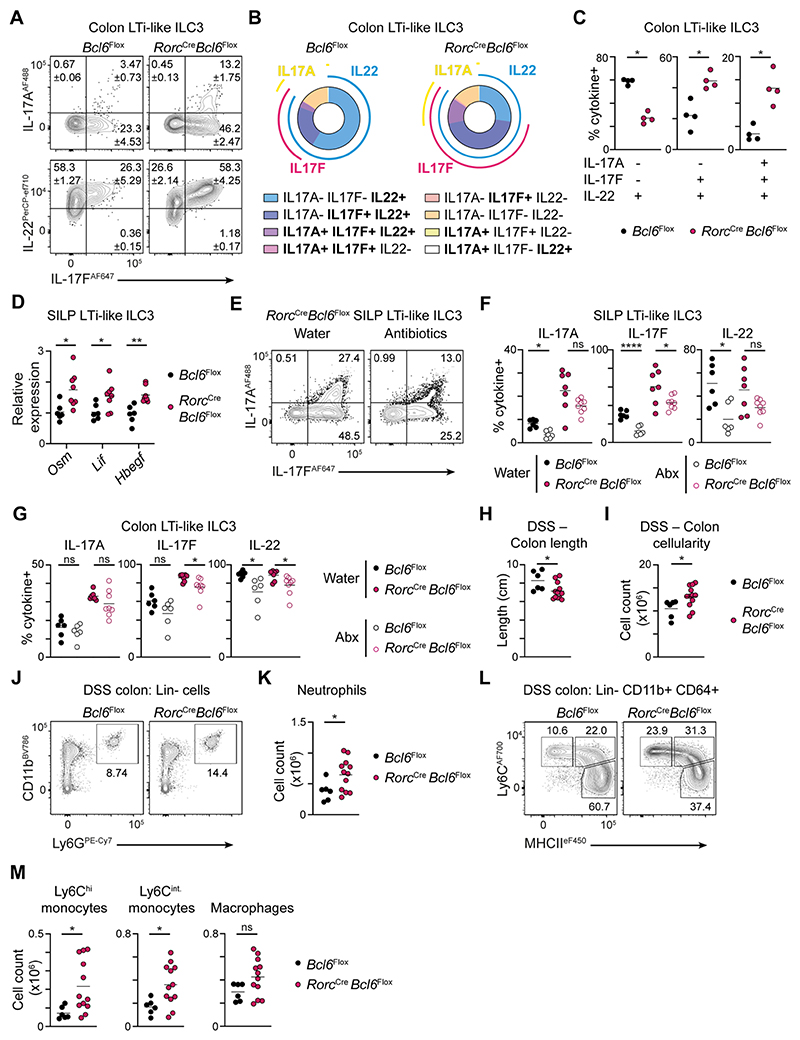
Innate lymphoid cells (ILCs) are tissue-resident effector cells with roles in tissue homeostasis, protective immunity, and inflammatory disease. Group 3 ILCs (ILC3s) are classically defined by the master transcription factor RORγt. However, ILC3 can be further subdivided into subsets that share type 3 effector modules that exhibit significant ontological, transcriptional, phenotypic, and functional heterogeneity. Notably lymphoid tissue inducer (LTi)-like ILC3s mediate effector functions not typically associated with other RORγt-expressing lymphocytes, suggesting that additional transcription factors contribute to dictate ILC3 subset phenotypes. Here, we identify Bcl6 as a subset-defining transcription factor of LTi-like ILC3s in mice and humans. Deletion of Bcl6 results in dysregulation of the LTi-like ILC3 transcriptional program and markedly enhances expression of interleukin-17A (IL-17A) and IL-17F in LTi-like ILC3s in a manner in part dependent upon the commensal microbiota-and associated with worsened inflammation in a model of colitis. Together, these findings redefine our understanding of ILC3 subset biology.

Keywords: Bcl6; CP: Immunology; IL-17; ILC3; innate lymphoid cells; intestinal immunity; lymphoid tissue inducer; microbiota; transcription factor.


Conflict of interest statement

Declaration of interests The authors declare no competing interests.

Figures

Figure 1
Figure 1. Bcl6 is expressed by murine LTi-like ILC3.
A) t-SNE plot showing ILC superclusters, B) Bcl6 mRNA expression and C) Bcl6 regulon activity in previously published scRNA seq analysis of ILC isolated from the small intestine lamina propria (SILP) of Id2CreERT2 mice . D) Heatmap showing relative expression of Bcl6 regulon-associated genes by ILC subsets from a publicly-available RNAseq data set (Immgen.org) . E) Relative expression of Bcl6 mRNA on ILCs sorted from the SILP of RORγteGFP mice, determined by RT-PCR, n=4-8. F) Representative flow cytometry gating strategy used to identify ILC subsets from the total ILC population (CD45+, CD11b- CD11c- B220- CD3- CD5-, CD127+ CD90.2+) in murine SILP. G) Representative histograms, and H) geometric mean fluorescence intensity of Bcl6 protein across ILC subsets in mouse SILP, n=4. I) Immunofluorescence imaging of murine mLN stained for Bcl6 (green), CD3 (blue), CD127 (red) and DAPI (grey). Scale bar 100μm. J) Unbiased gating and expression of subset-defining surface markers versus Bcl6tdTomato amongst total SILP ILCs (as in F), from Bcl6tdTomato reporter mice. K) Representative histograms L) quantification of Bcl6tdTomato expression amongst pre-gated ILC subsets from the SILP, n=4. Statistical significance was calculated using a one-way ANOVA (E, H, L) with Sidak’s (E) or Dunnet’s (H, L) post hoc test. Data pooled from two independent experiments (E), or representative of 2-3 independent experiments (F-L). Data represented as individual animals and mean. See also Figure S1 and Figure S2.
Figure 2
Figure 2. Human tonsillar Nrp1+ NKp44+ ILC3 express Bcl6.
A) UMAP showing ILC and helper T cell clusters and B) Bcl6 mRNA expression density from scRNA seq data generated from human tonsil cells. C) Violin plot summarizing Bcl6 expression from cell clusters (as identified in A). D) Representative flow cytometry gating of ILC subsets (from CD45+ Lin- CD3- CD127+ CRTH2-), ILC3 subsets (from CD45+ Lin- CD3- CD127+ CRTH2- c-kit+) and TfH cells (from Lin- CD3+ CD4+) from the human tonsil. E) Representative histograms and F) geometric mean fluorescence intensity quantification of Bcl6 protein expression from ILC1, NKp44- NRP1- ILC3, NKp44+ NRP3+ ILC3 or control TfH cells from human tonsils, n=5. Statistical significance was determined by a one-way ANOVA with Tukey’s Multiple Comparison test (F). Bars on plot signify median. Data pooled from 2 independent experiments (A-C), or representative of 5 independent donors (D-F). See also Figure S3.
Figure 3
Figure 3. Bcl6 shapes the transcriptional landscape of LTi-like ILC3.
A) Representative flow cytometry plots identifying ILC subsets from the total ILC population (CD45+, CD11b- CD11c- B220- CD3- CD5-, CD127+ CD90.2+). Values indicate average frequency (± standard error of the mean). B) Quantification of ILC subset frequency, n=3-4, C) and absolute cell counts in the SILP of RorcCre x Bcl6fl/fl and Bcl6fl/fl control mice, n=4-5. D) Volcano plot summarizing gene fold change (Log2FC) and adjusted P value (-log10(padj)), between LTi-like ILC3 of RorcCre x Bcl6fl/fl and Bcl6fl/fl control mice in the SILP (top), and mLN (bottom). E) Heatmap summarizing relative expression of curated and significantly differentially expressed genes between LTi-like ILC3 from the SILP of RorcCre x Bcl6fl/fl and Bcl6fl/fl control mice. (F-H) Representative flow cytometry histograms and summary quantification plots of F) Arg1 G) Bcl2 and H) MHCII on LTi-like ILC3 from the SILP from RorcCre x Bcl6fl/fl and Bcl6fl/fl control mice, n=3-4. Data representative of 3-5 independent experiments (A-C, F-H). Statistical significance was determined by an unpaired t-test (F-H). Data represented as individual animals and mean. See also Figure S4 and Figure S5.
Figure 4
Figure 4. Single cell sequencing of inducible Bcl6-deletion in ILCs.
A) Diagram of experimental design for Cre activation on Id2CreERT2 and Id2CreERT2 x Bcl6fl/fl mice. B) Representative flow cytometry plot (left) and quantification (right) of Id2CreERT2 activation reflected by ROSAtdRFP expression, on lymphocyte subsets from B) the mLN and C) SILP of Id2CreERT2 mice following tamoxifen administration, n=3. D) Relative Bcl6 expression determined by RT-PCR on sort-purified tdRFP+ LTi-like ILC3 from the mLN of Id2CreERT2 and Id2CreERT2 x Bcl6fl/fl mice, n=3. E) t-SNE and cluster identification of ILC single-cell RNAseq from the SILP of Id2CreERT2 and Id2CreERT2 x Bcl6fl/fl mice. F) mRNA expression of subset-defining transcription factors and cytokines related to (E). G) LTi-like ILC3 sub-cluster identification (top) and genotype origin (bottom). H) Relative enrichment of LTi-like ILC3 sub-clusters on Id2CreERT2 and Id2CreERT2 x Bcl6fl/fl mice, and I) relative genotype contribution to each LTi-like ILC3 sub-cluster as identified in (G). J) Dot-plot depicting frequency and normalised gene expression of selected genes across LTi-like ILC3 sub-clusters from (G). K) Il17a and Il17f mRNA expression on total ILCs from Id2CreERT2 and Id2CreERT2 x Bcl6fl/fl mice, clustered as in (E). L) Volcano plot showing fold change (Log2FC) and adjusted P value (-log10(padj)) of regulon activity determined by SCENIC on LTi-like ILC3 from Id2CreERT2 or Id2CreERT2 x Bcl6fl/fl mice. M) Regulon specificity score for each LTi-like ILC3 sub-cluster as identified in (G). Red labels indicate top most specific regulons in each cluster. Data representative of 2-5 independent experiments (B-D). Data represented as individual animals and mean. See also Figure S4 and Figure S6.
Figure 5
Figure 5. Bcl6 represses type 3 effector cytokine responses to the microbiota.
A) Representative flow cytometry plots showing expression of IL-17A, IL-17F and IL-22 by LTi-like ILC3 from the colon of RorcCre x Bcl6fl/fl and Bcl6fl/fl control mice. B) Pie charts depicting the average percentage of cells co-expressing one or more cytokine within LTi-like ILC3 from the colon of RorcCre x Bcl6fl/fl and Bcl6fl/fl control mice. C) Quantification of single (IL-22+), double (IL-22+ IL-17F+) and triple (IL-22+ IL-17F+ IL-17A+)-secreting LTi-like ILC3 from the colon of RorcCre x Bcl6fl/fl and Bcl6fl/fl control mice, n=4. D) Relative expression of Osm, Lif, and Hbegf mRNA on LTi-like ILC3 sorted from the SILP of RorcCre x Bcl6fl/fl and Bcl6fl/fl control mice, determined by RT-PCR, n=6-8. E) Representative flow cytometry plots showing IL-17A and IL-17F production by LTi-like ILC3 from the SILP of water- or antibiotics-treated RorcCre x Bcl6fl/fl mice. (F-G) Quantification of frequencies of IL-17A, IL-17F and IL-22 producing LTi-like ILC3 from the F) SILP or G) the colon of antibiotics- or water-treated RorcCre x Bcl6fl/fl and Bcl6fl/fl control mice, n=6-8. H) Length and I) absolute cell count of the colon of DSS-treated RorcCre x Bcl6fl/fl and Bcl6fl/fl control mice, n=6-12. J) Representative gating strategy and K) neutrophil cell count in the colon, n=6-12. L) Representative gating strategies and M) cell counts of Ly6Chi monocyte, Ly6Cint monocyte and macrophages in the colon, n=6-12. For myeloid cell analysis (J-M), cells expressing the lineage markers CD3, CD5, NK1.1 and CD19 were excluded. Data representative of 3-4 independent experiments (A-C), or pooled from 2 independent experiments (D-M). Statistical significance was determined using an unpaired Mann-Whitney test (C), unpaired t test (D, H-M), or an ordinary one-way ANOVA (F-G). Values on flow plots indicate average frequency (± standard error of the mean). Data represented as individual animals and mean. See also Figure S7.

References

    1. Klose CS, Artis D. Innate lymphoid cells as regulators of immunity, inflammation and tissue homeostasis. Nat Immunol. 2016;17:765–774. doi: 10.1038/ni.3489. - DOI - PubMed
    1. Melo-Gonzalez F, Hepworth MR. Functional and phenotypic heterogeneity of group 3 innate lymphoid cells. Immunology. 2017;150:265–275. doi: 10.1111/imm.12697. - DOI - PMC - PubMed
    1. Vivier E, Artis D, Colonna M, Diefenbach A, Di Santo JP, Eberl G, Koyasu S, Locksley RM, McKenzie ANJ, Mebius RE, et al. Innate Lymphoid Cells: 10 Years On. Cell. 2018;174:1054–1066. doi: 10.1016/j.cell.2018.07.017. - DOI - PubMed
    1. Eberl G, Di Santo JP, Vivier E. The brave new world of innate lymphoid cells. Nat Immunol. 2015;16:1–5. doi: 10.1038/ni.3059. - DOI - PubMed
    1. Spits H, Artis D, Colonna M, Diefenbach A, Di Santo JP, Eberl G, Koyasu S, Locksley RM, McKenzie AN, Mebius RE, et al. Innate lymphoid cells--a proposal for uniform nomenclature. Nat Rev Immunol. 2013;13:145–149. doi: 10.1038/nri3365. - DOI - PubMed

Publication types

Substances