. 2023 Dec 11;51(22):12076-12091.
doi: 10.1093/nar/gkad996.

The translational oscillation in oocyte and early embryo development

Affiliations

The translational oscillation in oocyte and early embryo development

Rajan Iyyappan et al. Nucleic Acids Res. .

Abstract

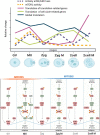
Translation is critical for development as transcription in the oocyte and early embryo is silenced. To illustrate the translational changes during meiosis and consecutive two mitoses of the oocyte and early embryo, we performed a genome-wide translatome analysis. Acquired data showed significant and uniform activation of key translational initiation and elongation axes specific to M-phases. Although global protein synthesis decreases in M-phases, translation initiation and elongation activity increases in a uniformly fluctuating manner, leading to qualitative changes in translation regulation via the mTOR1/4F/eEF2 axis. Overall, we have uncovered a highly dynamic and oscillatory pattern of translational reprogramming that contributes to the translational regulation of specific mRNAs with different modes of polysomal occupancy/translation that are important for oocyte and embryo developmental competence. Our results provide new insights into the regulation of gene expression during oocyte meiosis as well as the first two embryonic mitoses and show how temporal translation can be optimized. This study is the first step towards a comprehensive analysis of the molecular mechanisms that not only control translation during early development, but also regulate translation-related networks employed in the oocyte-to-embryo transition and embryonic genome activation.


Figures

Graphical Abstract
Graphical Abstract
Figure 1.
Figure 1.
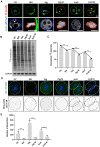
Global translation is decreased in the M-phase of meiosis and the two subsequent mitoses. (A) Immunocytochemical analysis of oocytes and early embryos in the interphase (LMN A/C, blue) and M-phase (H3-Ser10, red), DNA labelled with DAPI (gray), Actin (green, cortex). Scale bar, 15 μm. The lower row shows the zoomed nuclei/chromosomal area. (B) 35S-methionine labelling of oocytes and embryos to visualize global translation of the specific stage of the developing oocyte and early embryo. GAPDH was used as a loading control, n ≥ 3. (C) Normalized densitometric values of 35S-methionine from stages in (B). Data are represented as the mean ± s.d.; **P< 0.01 according to Student's t-test, n ≥ 3. (D) Proximity ligation assay detecting in situ ribosome assembly using RPL24 and RPS6 markers (L24 + S6, green and grey dots). The white and black dashed line indicates cellular cortex; representative images from three independent experiments shown. Scale bar, 20 μm. (E) Quantification of ribosome assembly in the specific developmental stages. Data are represented as the mean ± s.d.; **P< 0.01 and ***P< 0.001 according to Student's t-test; from three independent experiments, n ≥ 70. For additional analysis see Supplementary Figure 1.
Figure 2.
Figure 2.
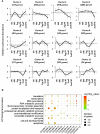
Dynamics of polysome bound mRNAs coding for components of specific biological processes in the oocyte and early embryo development. (A) 12 different clusters demonstrate temporal patterns of polysome bound RNAs in the developing oocyte and early embryo. Connected to Supplementary File S1 and Supplementary File 2. (B) Gene Ontology categories that relate to distinct clusters (A) are plotted from over representation analysis (WebGestalt). Connected to Supplementary File 3.
Figure 3.
Figure 3.
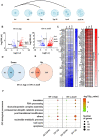
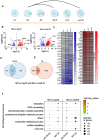
Polysome occupancy is higher in the oocyte interphase compared to embryo interphase. (A) Scheme of comparison of meiotic oocyte interphase with embryonic interphase. (B) Differential mRNA translation analysis of GV versus 1 and two-cell embryo stages. Volcano plots displaying candidate transcripts differentially enriched in polysomal fractions of oocytes and embryos from meiotic interphase and first mitotic interphases, highlighting those with FC > 2 (red) and FC < 2 (blue), adjusted P< 0.05. Dashed lines indicate candidate mRNAs translated in interphases compared. Connected to Supplementary File 4. (C) Heatmaps of Subset of mRNAs down and up regulated in oocyte interphase compared to embryo interphase. Connected to Supplementary File 4. (D) Venn diagram showing the number downregulated genes in oocyte interphase compared to embryo interphases. Connected to Supplementary File 4. (E) Venn diagram showing the number of upregulated genes in oocyte interphase compared to embryo interphases. Connected to Supplementary File 4. (F) Dot plot of top differentially translated gene transcripts and gene ontology (GO) analysis from (B). by WebGestalt for each cluster according to the top ranked genes for each cluster. The sizes and colours of the dots represent the number of genes and –log10-transformed P-values respectively. Connected to Supplementary File 5.
Figure 4.
Figure 4.
Meiotic M-phase has significantly higher translational activity than mitotic M-phases. (A) Scheme of comparison of meiotic M-phase with embryonic mitoses. (B) Differential mRNA translation analysis of meiotic M-phase versus first and second mitotic M-phases. Volcano plots displaying candidate transcripts differentially enriched in polysomal fractions of oocytes and embryos from interphase and M-phase comparisons, highlighting those with FC > 2 (red) and FC < 2 (blue), adjusted P< 0.05. Dashed lines indicate candidate mRNAs translated in M-phases compared. Connected to Supplementary File 6. (C) Candidate mRNAs commonly downregulated and upregulated in M-phases. Connected to Supplementary File 6. (D) Venn diagram showing the number of downregulated genes in MII phase compared to first mitotic M-phase. Connected to Supplementary File 6. (E) Venn diagram showing the number upregulated genes in MII phase compared to second mitotic M-phase. Connected to Supplementary File 6. (F) Dot plot of top differentially translated gene transcripts and gene ontology (GO) analysis from (B). by WebGestalt for each cluster according to the top ranked genes for each cluster. The sizes and colours of the dots represent the number of genes and –log10-transformed P-values, respectively. Connected to Supplementary File 7.
Figure 5.
Figure 5.
Translational regulation is significantly enriched in meiosis and 2nd embryonic mitosis. (A) Scheme of interphases and M-phases comparisons. (B) Differential gene expression analysis of M-phase versus interphase of oocytes and embryos. Volcano plots displaying candidate transcripts differentially enriched in polysomal fractions of oocytes and embryos from interphase and M-phase comparisons, highlighting those with FC > 2 (red) and FC < 2 (blue), adjusted P< 0.05. Dashed lines indicate candidate mRNAs translated in M-phases compared. See also Supplementary Figure 4 for candidate mRNA validation. Connected to Supplementary File 8. (C) Venn diagram showing the number of downregulated genes in M-phase compared to interphase. Connected to Supplementary File 8. (D) Venn diagram showing the number upregulated genes in M-phase compared to interphase. Connected to Supplementary File 8. (E) Candidate mRNAs commonly downregulated and upregulated in M-phases. Connected to Supplementary File 8. (F) Dot plot of top differentially translated gene transcripts and gene ontology (GO) analysis from (B). by WebGestalt for each group according to the top ranked genes for each cluster. The sizes and colours of the dots represent the number of genes and –log10-transformed P-values, respectively. Connected to Supplementary File S9. (G) Line graph derived from the dot plot (Figure 3F) highlighting the translation of cell cycle and translational gene in each group. Connected to Supplementary File 5.
Figure 6.
Figure 6.
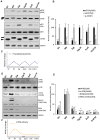
Increased activity of eEF2, 4E-BP1 and mTOR translational pathways during M-phase. (A) Immunoblot analyses of the key protein for cap-dependent translation show activity in M-phase. Arrow denotes phosphorylated and arrowhead for total form of protein. (B) Normalized densitometric values from components from (A). Data are represented as the mean ± s.d.; values obtained for relevant. stage with highest intensity was set as 100%. Data are represented as mean ± s.d.; *P< 0.05; **P< 0.01; ***P< 0.001 according to Student's t-test; from three biological replicates. (C) Scheme representing the active translation derived from the (A) and (B). (D) Western blot analysis of the key proteins for mTOR-related pathways. (E) Normalised densitometric values of immunoblot of (D). Data are represented as mean ± s.d.; MII set as 100%; *P< 0.05; **P< 0.01; ***P< 0.001 according to Student's t-test; from three biological replicates. (F) Scheme representing the mTOR activity derived from the (D) and (E).
Figure 7.
Figure 7.
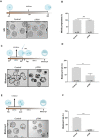
Modulation of eEF2K/ eEF2 axis negatively influences embryo development. (A) Scheme for inhibitor treatment of oocytes and impact on meiotic maturation. Representative images of meiotic progression of oocytes treated by 5μM p70KI inhibitor during meiotic maturation. For effect of inhibitor on the eEF2 phosphorylation see Supplementary Figure 6A, B. (B) Quantification of oocyte progression from GV to MII stage after inhibitor treatment. Data represented as mean ± s.d.; Student's t-test: ns, nonsignificant; from three biological replicates with presented n. (C) Scheme of inhibitor treatment in oocytes and followed by IVF. Representative image of embryo development after inhibitor treatment (p70KI) and IVF; n ≥ 3. (D) Quantification of blastocyst formation after inhibition of eEF2 during oocyte progression followed by IVF. Data are represented as mean ± s.d.; **P< 0.01 according to Student's t-test; from three biological replicates with presented n. For evaluation of fertilization see Supplementary Figure 6C. (E) Scheme for inhibitor treatment in embryos. Representative image of embryo development after 5 μM inhibitor treatment (p70KI); n ≥ 3. (F) Quantification of blastocyst formation after inhibition of eEF2 at zygote. Data are represented as mean ± s.d.; **P< 0.01 according to Student's t-test; from three biological replicates with presented n. For evaluation of two-cell development, see Supplementary Figure 6D. For additional inhibitor treatment see Supplementary Figure 7.

References

    1. Buccitelli C., Selbach M.. mRNAs, proteins and the emerging principles of gene expression control. Nat. Rev. Genet. 2020; 21:630–644. - PubMed
    1. Hu W., Zeng H., Shi Y., Zhou C., Huang J., Jia L., Xu S., Feng X., Zeng Y., Xiong T.et al. .. Single-cell transcriptome and translatome dual-omics reveals potential mechanisms of human oocyte maturation. Nat. Commun. 2022; 13:5114. - PMC - PubMed
    1. Jansova D., Tetkova A., Koncicka M., Kubelka M., Susor A.. Localization of RNA and translation in the mammalian oocyte and embryo. PLoS One. 2018; 13:e0192544. - PMC - PubMed
    1. De La Fuente R. Chromatin modifications in the germinal vesicle (GV) of mammalian oocytes. Dev. Biol. 2006; 292:1–12. - PubMed
    1. Li L., Zheng P., Dean J.. Maternal control of early mouse development. Development. 2010; 137:859–870. - PMC - PubMed

Publication types