Effect of Dietary Sodium on Blood Pressure: A Crossover Trial
- PMID: 37950918
- PMCID: PMC10640704
- DOI: 10.1001/jama.2023.23651
Effect of Dietary Sodium on Blood Pressure: A Crossover Trial
Abstract
Importance: Dietary sodium recommendations are debated partly due to variable blood pressure (BP) response to sodium intake. Furthermore, the BP effect of dietary sodium among individuals taking antihypertensive medications is understudied.
Objectives: To examine the distribution of within-individual BP response to dietary sodium, the difference in BP between individuals allocated to consume a high- or low-sodium diet first, and whether these varied according to baseline BP and antihypertensive medication use.
Design, setting, and participants: Prospectively allocated diet order with crossover in community-based participants enrolled between April 2021 and February 2023 in 2 US cities. A total of 213 individuals aged 50 to 75 years, including those with normotension (25%), controlled hypertension (20%), uncontrolled hypertension (31%), and untreated hypertension (25%), attended a baseline visit while consuming their usual diet, then completed 1-week high- and low-sodium diets.
Intervention: High-sodium (approximately 2200 mg sodium added daily to usual diet) and low-sodium (approximately 500 mg daily total) diets.
Main outcomes and measures: Average 24-hour ambulatory systolic and diastolic BP, mean arterial pressure, and pulse pressure.
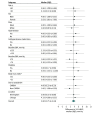
Results: Among the 213 participants who completed both high- and low-sodium diet visits, the median age was 61 years, 65% were female and 64% were Black. While consuming usual, high-sodium, and low-sodium diets, participants' median systolic BP measures were 125, 126, and 119 mm Hg, respectively. The median within-individual change in mean arterial pressure between high- and low-sodium diets was 4 mm Hg (IQR, 0-8 mm Hg; P < .001), which did not significantly differ by hypertension status. Compared with the high-sodium diet, the low-sodium diet induced a decline in mean arterial pressure in 73.4% of individuals. The commonly used threshold of a 5 mm Hg or greater decline in mean arterial pressure between a high-sodium and a low-sodium diet classified 46% of individuals as "salt sensitive." At the end of the first dietary intervention week, the mean systolic BP difference between individuals allocated to a high-sodium vs a low-sodium diet was 8 mm Hg (95% CI, 4-11 mm Hg; P < .001), which was mostly similar across subgroups of age, sex, race, hypertension, baseline BP, diabetes, and body mass index. Adverse events were mild, reported by 9.9% and 8.0% of individuals while consuming the high- and low-sodium diets, respectively.
Conclusions and relevance: Dietary sodium reduction significantly lowered BP in the majority of middle-aged to elderly adults. The decline in BP from a high- to low-sodium diet was independent of hypertension status and antihypertensive medication use, was generally consistent across subgroups, and did not result in excess adverse events.
Trial registration: ClinicalTrials.gov Identifier: NCT04258332.
Conflict of interest statement
Figures


Comment in
-
Making Sense of Individual Responses to Sodium Reduction.JAMA. 2023 Dec 19;330(23):2251-2252. doi: 10.1001/jama.2023.23650. JAMA. 2023. PMID: 38112823 Free PMC article. No abstract available.
-
Dietary Sodium and Blood Pressure.JAMA. 2024 Apr 2;331(13):1154-1155. doi: 10.1001/jama.2024.1907. JAMA. 2024. PMID: 38563840 No abstract available.
References
-
- World Health Organization . WHO Guideline: Sodium Intake for Adults and Children. World Health Organization; 2012. - PubMed
-
- Department of Agriculture and Department of Health and Human Services . Dietary Guidelines for Americans, 2020-2025. 9th ed. Dept of Agriculture and Dept of Health and Human Services; 2020.
Publication types
MeSH terms
Substances
Associated data
Grants and funding
LinkOut - more resources
Full Text Sources
Medical
Miscellaneous

