. 2023 Dec 7;83(23):4290-4303.e9.
doi: 10.1016/j.molcel.2023.10.012. Epub 2023 Nov 10.

RNF14-dependent atypical ubiquitylation promotes translation-coupled resolution of RNA-protein crosslinks

Affiliations

RNF14-dependent atypical ubiquitylation promotes translation-coupled resolution of RNA-protein crosslinks

Shubo Zhao et al. Mol Cell. .

Abstract

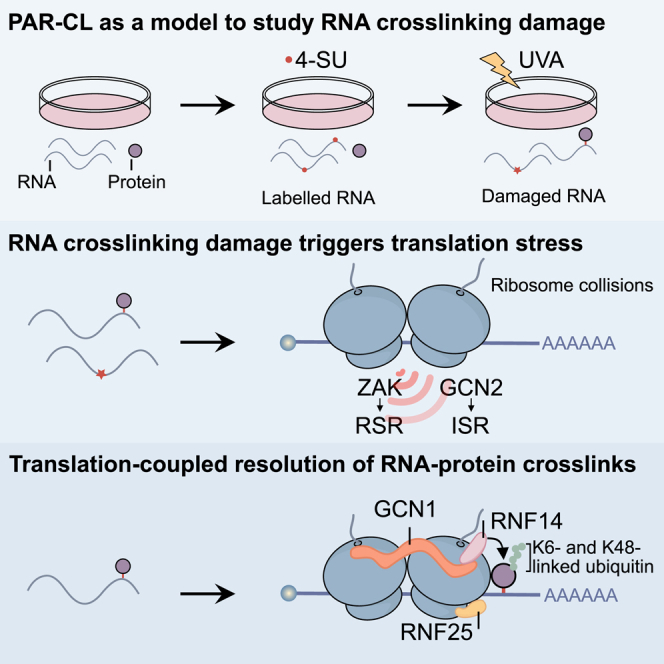
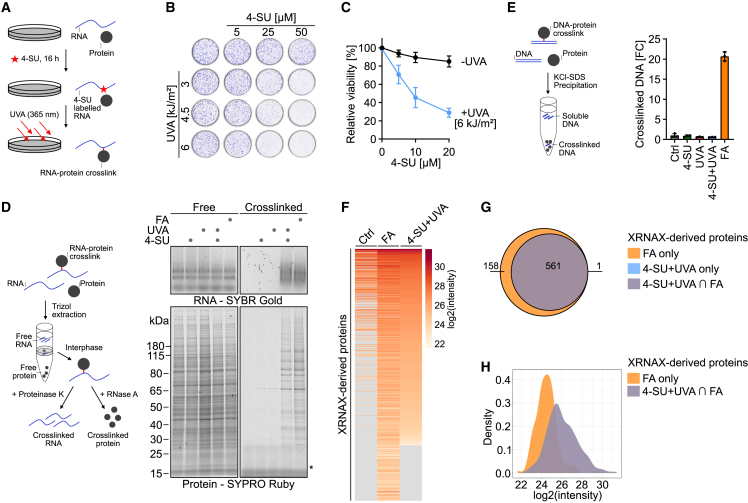
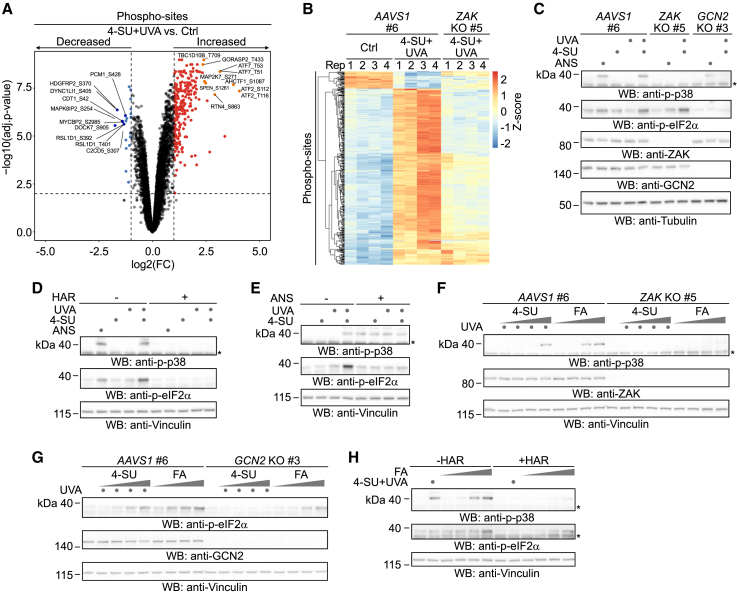
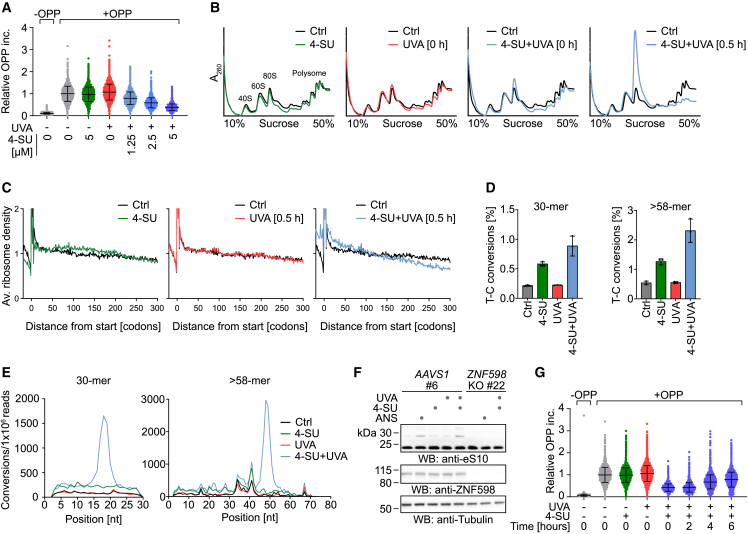
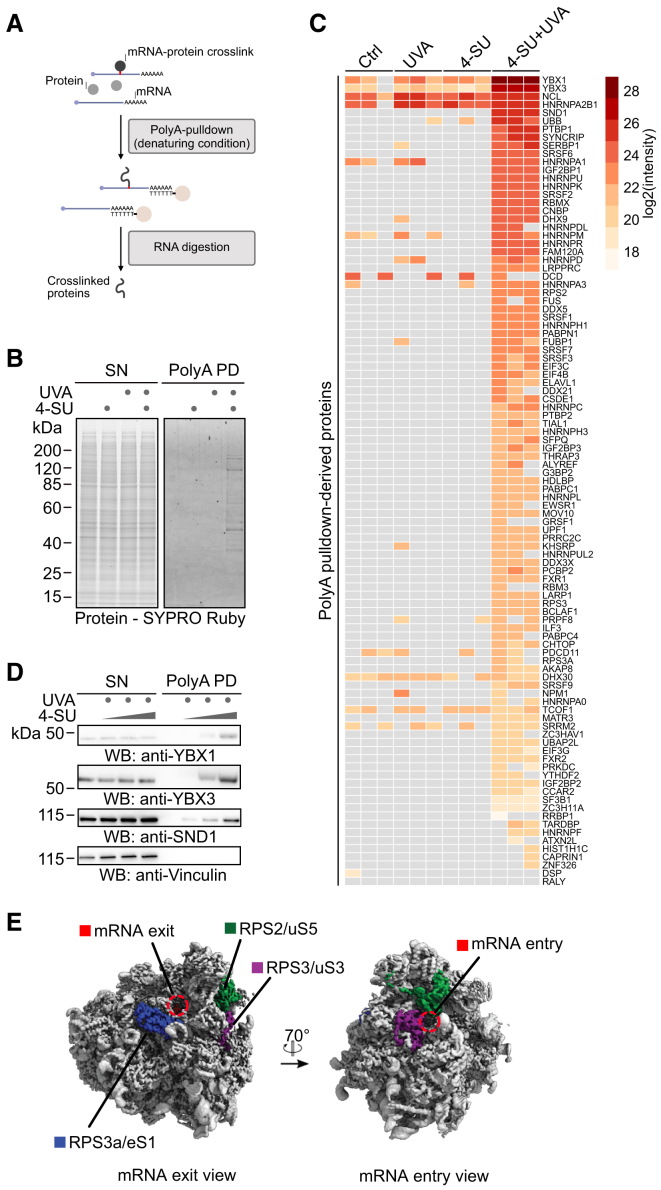
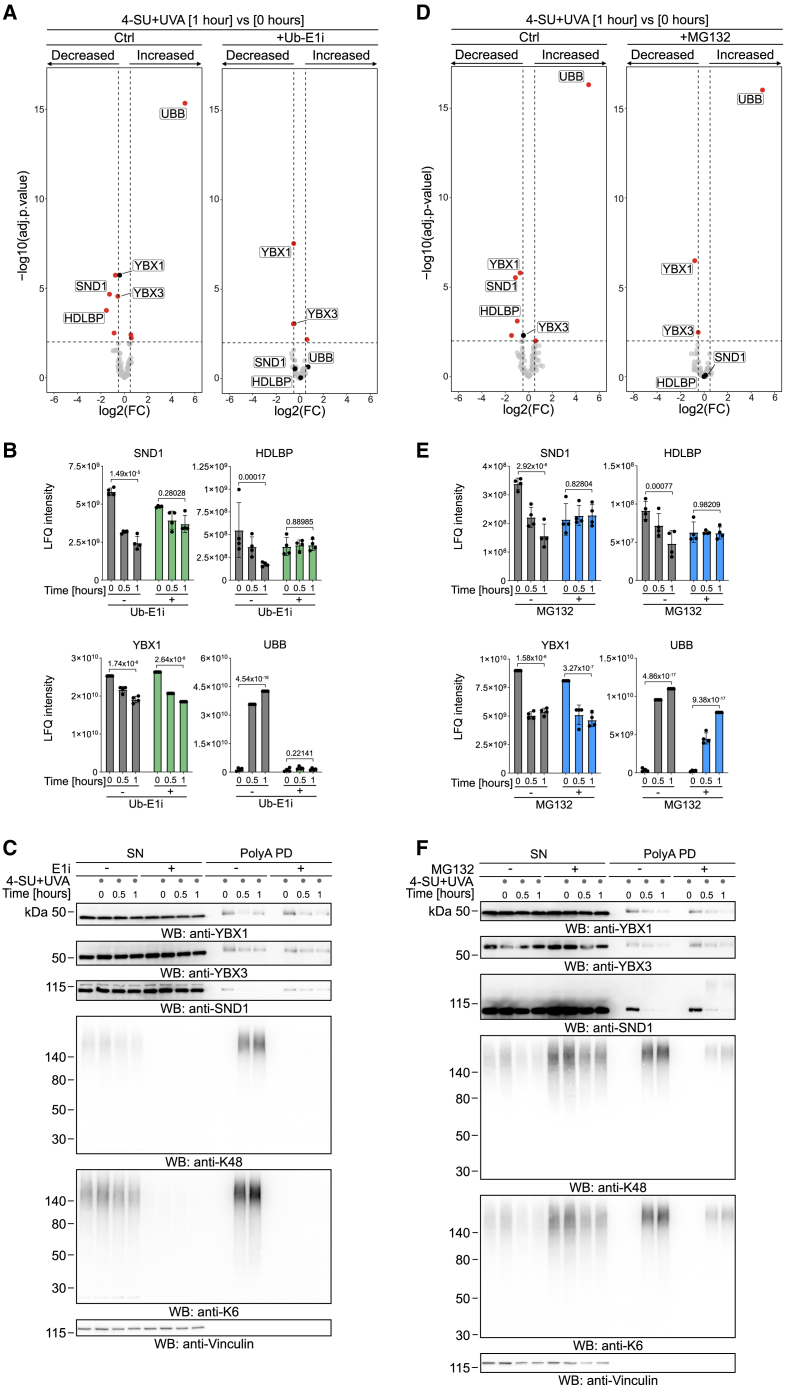
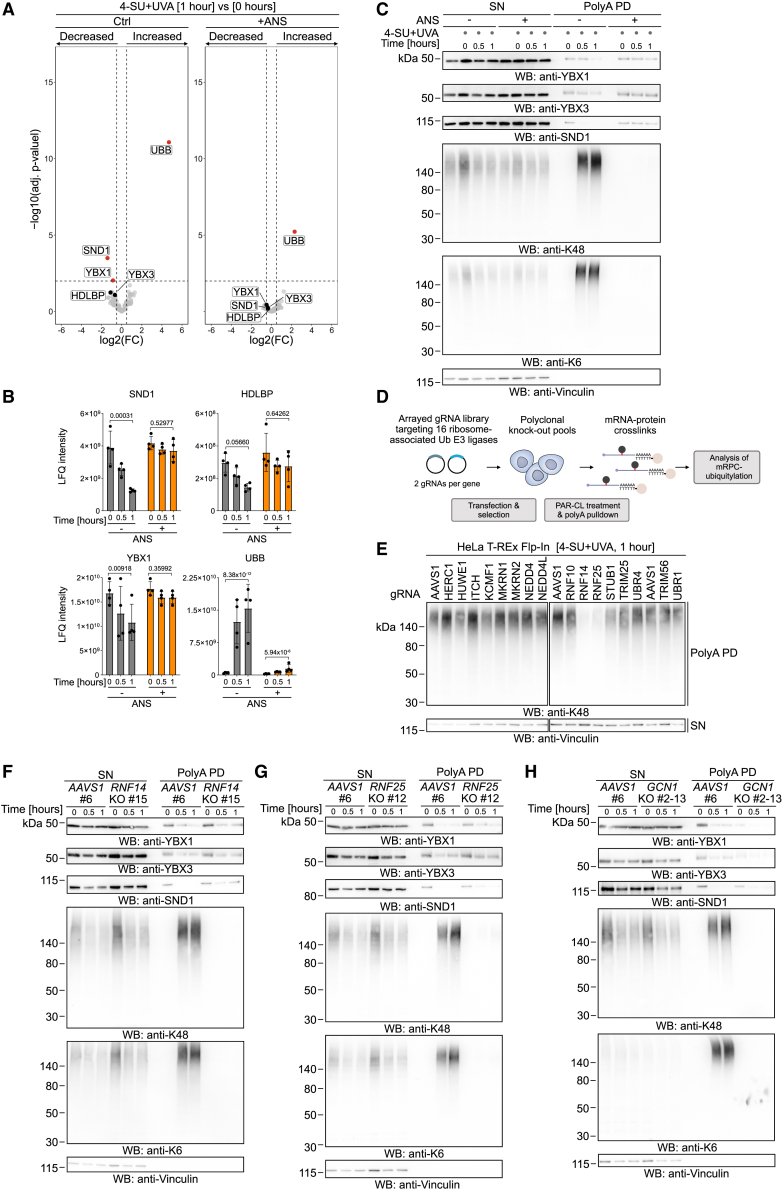
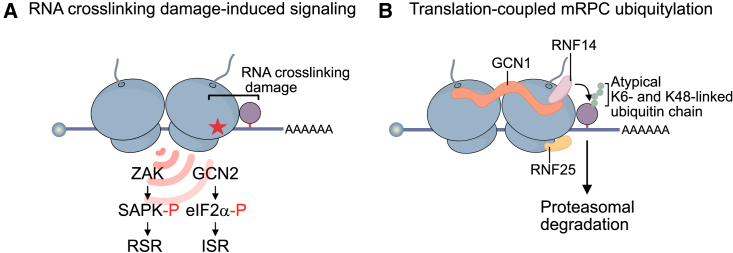
Reactive aldehydes are abundant endogenous metabolites that challenge homeostasis by crosslinking cellular macromolecules. Aldehyde-induced DNA damage requires repair to prevent cancer and premature aging, but it is unknown whether cells also possess mechanisms that resolve aldehyde-induced RNA lesions. Here, we establish photoactivatable ribonucleoside-enhanced crosslinking (PAR-CL) as a model system to study RNA crosslinking damage in the absence of confounding DNA damage in human cells. We find that such RNA damage causes translation stress by stalling elongating ribosomes, which leads to collisions with trailing ribosomes and activation of multiple stress response pathways. Moreover, we discovered a translation-coupled quality control mechanism that resolves covalent RNA-protein crosslinks. Collisions between translating ribosomes and crosslinked mRNA-binding proteins trigger their modification with atypical K6- and K48-linked ubiquitin chains. Ubiquitylation requires the E3 ligase RNF14 and leads to proteasomal degradation of the protein adduct. Our findings identify RNA lesion-induced translational stress as a central component of crosslinking damage.

Keywords: GCN1; K6-linked ubiquitin chains; RNA damage; RNA-protein crosslinks; RNF14; RNF25; atypical ubiquitylation; formaldehyde; ribosome; translation.


Conflict of interest statement

Declaration of interests R.G. is a member of the scientific advisory board at the journal Molecular Cell.

Figures

None
Graphical abstract
Figure 1
Figure 1
Photoactivatable-ribonucleoside-enhanced crosslinking (PAR-CL) recapitulates formaldehyde-induced RNA-protein crosslink formation (A) Schematic depiction of RNA-protein crosslink (RPC) induction. Cellular RNAs are labeled with the photoactivatable ribonucleoside 4-thiouridine (4-SU) and crosslinked by UVA irradiation. (B and C) Colony formation assay (B) and cell viability measurement (C) of HAP1 cells after treatment with indicated doses of 4-SU and UVA. Values in (C) represent the mean ± SD of three biological replicates normalized to the mean of corresponding control of each replicate. (D) PAR-CL (4-SU + UVA) and formaldehyde-induced RPCs analyzed by XRNAX. Left: schematic depiction of RPC purification by XRNAX. Right: RPC purification by XRNAX in HAP1 cells treated with 4-SU (5 μM, 16 h, estimated to result in replacement of 0.125% of uridines by 4-SU, based on previous work41), UVA (6 kJ/m2), or 0.5 mM formaldehyde (FA) for 1 h, as indicated. Purified RPCs were digested with Proteinase K or RNase A prior to running on an agarose gel (RNA) and SDS-PAGE gel (protein), respectively. Asterisk indicates RNase A. (E) DNA-protein-crosslink formation quantified by KCl-SDS precipitation assay. Left: schematic depiction of DNA-protein-crosslink quantification by KCl-SDS assay. Right: KCl-SDS assays of HAP1 cells treated as in (D). Crosslinked DNA was measured using Qubit DNA HS assay. Values represent the mean ± SD of the fold change of crosslinked DNA of three technical replicates normalized to the mean of untreated controls. (F) Heatmap of XRNAX-derived proteins crosslinked to RNA from HAP1 cells treated as in (D). Proteins identified in XRNAX samples, sorted by decreasing log2 intensity in 4-SU + UVA samples. Values represent the mean of the log2 intensity of three biological replicates from untreated (Ctrl) cells or cells treated with 0.5 mM formaldehyde (FA) for 1 h or cells treated with 4-SU (5 μM, 16 h) and UVA (6 kJ/m2) (4-SU + UVA). (G and H) Venn diagram (G) and density plot (H) for XRNAX-derived proteins crosslinked to RNA. Venn diagram: numbers indicate proteins identified in different treatments, formaldehyde (FA, orange) or PAR-CL (4-SU + UVA, blue) or both (4-SU + UVA ∩ FA, purple). Density plot shows the probability distribution of log2 intensities for proteins crosslinked to RNA in formaldehyde (FA, orange) or formaldehyde and PAR-CL (4-SU + UVA ∩ FA, purple).
Figure 2
Figure 2
PAR-CL and formaldehyde induce ZAKα- and GCN2-dependent stress responses (A) Volcano plot indicating differentially modified phospho-sites 0.5 h after treatment with PAR-CL (4-SU [5 μM, 16 h] + UVA [6 kJ/m2]) in HAP1 cells. Statistically significantly changed sites (adj. p ≤ 0.01, −1 ≥ log2 fold change ≥ 1) are highlighted in red for increased and blue for decreased phospho-sites. Top 10 hits for increased and decreased phospho-sites are highlighted in orange and dark blue, respectively. (B) Heatmap depicting Z scored intensities for significantly affected phospho-sites in AAVS1 control and ZAK KO HAP1 cells treated as in (A). (C) Representative western blot analysis of clonal HAP1 ZAK KO, GCN2 KO, and matched AAVS1 control cells treated with 4-SU (5 μM, 16 h), UVA (6 kJ/m2), or anisomycin (ANS, 1 μM, 0.5 h), as indicated. Asterisk indicates unspecific band. (D and E) Representative western blot analysis of HAP1 cells treated with 4-SU (5 μM, 16 h) followed by harringtonine (HAR, 2 μg/mL, 0.5 h) prior to irradiation with UVA (6 kJ/m2) and anisomycin (ANS, 1 μM, 0.5 h) (D) or anisomycin treatment (ANS, 375 μM, 0.5 h) prior to irradiation with UVA (6 kJ/m2) (E), as indicated. Asterisk indicates unspecific band. (F and G) Representative western blot analysis of clonal HAP1 ZAK KO (F) and GCN2 KO (G) cells and matched AAVS1 control cells treated with increasing doses of 4-SU (0.04, 0.2, 1, and 5 μM, 16 h), followed by UVA irradiation (6 kJ/m2) or increasing doses of formaldehyde (FA, 100, 200, 500, and 1,000 μM, 1 h). Asterisk indicates unspecific band. (H) Representative western blot analysis of HAP1 cells treated with 4-SU (5 μM, 16 h) followed by harringtonine (HAR, 2 μg/mL, 0.5 h) pre-treatment prior to irradiation with UVA (6 kJ/m2) or treatment with increasing doses of formaldehyde (FA, 100, 200, 500, and 1,000 μM, 1 h), as indicated. Asterisk indicates unspecific band.
Figure 3
Figure 3
PAR-CL induces translation stress and ribosome collisions (A) Relative levels of O-propargyl-puromycin (OPP) incorporation measured by flow cytometry to determine protein synthesis rate in HAP1 cells, following treatment with indicated doses of 4-SU (16 h) followed by UVA irradiation (6 kJ/m2). Values represent fluorescence intensities of live, single cells normalized to the mean of untreated controls. Error bars represent SD. (B) Polysome profiles of HAP1 cells treated with 4-SU (5 μM, 16 h) and UVA (6 kJ/m2), as indicated. Cells were harvested 0 or 0.5 h after irradiation. Lysates were fractionated over 10%–50% sucrose gradients, followed by UV(A260) absorbance measurement. (C) Ribosome profiles of HAP1 cells treated with 4-SU (5 μM, 18 h) and UVA (6 kJ/m2) harvested 0.5 h after irradiation. Meta-gene analysis of ribosome footprints shows average ribosome density across ORFs in indicated conditions, compared with control. Average ribosome density represents mean of three replicates. (D) Frequency of T-C conversion in the sequencing of 30-mer (left) or >58-mer (right) ribosome footprints from HAP1 cells treated with 4-SU (5 μM, 18 h) and UVA (6 kJ/m²), compared with controls. Values represent the mean ± SD of three replicates. (E) Representative T-C conversion distribution across positions in 30-mer (left) or >58-mer (right) ribosome footprints from HAP1 cells treated with 4-SU (5 μM, 18 h) and UVA (6 kJ/m²), compared with controls. (F) Representative western blot analysis of clonal HAP1 ZNF598 KO cells and matched AAVS1 control cells treated with 4-SU (5 μM, 16 h), UVA (6 kJ/m2), or anisomycin (ANS, 1 μM, 0.5 h), as indicated. (G) O-propargyl-puromycin (OPP) incorporation analyzed by flow cytometry in HAP1 cells treated with 4-SU (5 μM, 16 h) and UVA (6 kJ/m2) at different time points after irradiation. Values represent fluorescence intensities of live, single cells normalized to the mean of controls. Error bars represent SD.
Figure 4
Figure 4
PAR-CL-induced formation of mRNA-protein crosslinks (A) Schematic depiction of mRPC purification by polyA-pull-down. Cells are lysed under denaturing conditions followed by addition of oligo(dT)-conjugated magnetic beads. Crosslinked proteins are eluted by RNA digestion. (B) HAP1 cells were treated with 4-SU (5 μM, 16 h) and UVA (6 kJ/m2), as indicated, followed by polyA-pull-down under denaturing conditions. Crosslinked proteins were visualized by SDS-PAGE followed by SYPRO Ruby staining. Contrast of image was adjusted globally for better visibility. (C) HAP1 cells were treated as indicated in (B), and mRPCs were isolated using polyA-pull-down. The identity of mRPCs was determined by mass spectrometry. Heatmap depicting abundance of mRPCs sorted by average log2 intensity in 4-SU + UVA samples. (D) Representative western blot analysis of mRPCs isolated by polyA-pull-down from HAP1 cells treated with increasing doses of 4-SU (1.25, 2.5, and 5 μM, 16 h) and UVA (6 kJ/m²). (E) mRNA exit and entry channel view of the structure of the human 80S ribosome, with ribosomal subunits RPS2/uS5 (green), RPS3/uS3 (purple), and RPS3A/eS1 (blue) and mRNA exit and entry indicated.
Figure 5
Figure 5
Degradation of mRNA-protein crosslinks is induced by atypical K6- and K48-linked ubiquitin chains (A–C) Volcano plot (A) comparing mRPCs isolated by polyA-pull-down from HAP1 cells treated with 4-SU (2.5 μM, 16 h) and ubiquitin E1 inhibitor (Ub-E1i, TAK-243, 1 μM, 1 h), as indicated, prior to irradiation with UVA (6 kJ/m2) at 1 vs. 0 h after irradiation. Bar graphs depicting normalized label-free quantification (LFQ) intensities (B) and representative western blot analysis (C) showing indicated time points of recovery of mRPCs isolated by polyA-pull-down from HAP1 cells treated as in (A). Statistically significantly changed proteins (adj. p ≤ 0.01, −0.5 ≥ log2 fold change ≥ 0.5) are highlighted in red (A). Bar graphs depict mean ± SD of four biological replicates and FDR-adj. p value of 0 vs. 1 h (B). (D–F) Volcano plot (D) comparing mRPCs isolated by polyA-pull-down from HAP1 cells treated with 4-SU (2.5 μM, 16 h) and proteasome inhibitor (MG132, 5 μM, 1 h), as indicated, prior to irradiation with UVA (6 kJ/m2) at 1 vs. 0 h after irradiation. Bar graphs depicting normalized label-free quantification (LFQ) intensities (E) and representative western blot analysis (F) showing indicated time points of recovery of mRPCs isolated by polyA-pull-down from HAP1 cells treated as in (D). Statistically significantly changed proteins (adj. p ≤ 0.01, −0.5 ≥ log2 fold change ≥ 0.5) in (D) are highlighted in red. Bar graphs depict mean ± SD of four biological replicates and FDR-adj. p value of 0 vs. 1 h (E).
Figure 6
Figure 6
Translation-coupled atypical ubiquitylation of mRNA-protein crosslinks by the E3 ligase RNF14 (A–C) Volcano plot (A) comparing mRPCs isolated by polyA pull-down from HAP1 cells treated with 4-SU (2.5 μM, 16 h) and translation inhibitor anisomycin (ANS, 375 μM, 1 h), as indicated, prior to irradiation with UVA (6 kJ/m2) at 1 vs. 0 h after irradiation. Bar graphs depicting normalized label-free quantification (LFQ) intensities (B) and representative western blot analysis (C) showing indicated time points of recovery of mRPCs isolated by polyA-pull-down from HAP1 cells treated as in (A). Statistically significantly changed proteins (adj. p ≤ 0.01, −0.5 ≥ log2 fold change ≥ 0.5) in (A) are highlighted in red. Bar graphs depict mean ± SD of four biological replicates and FDR-adj. p value of 0 vs. 1 h (B). (D) Schematic depiction of ribosome-associated ubiquitin E3 ligases screen. Two gRNAs per gene were used to generate polyclonal HeLa T-REx Flp-In KO cells, which were then subjected to polyA-pull-downs and western blotting following PAR-CL treatment. (E) Western blot analysis of polyclonal HeLa T-REx Flp-In KO cells treated with 4-SU (2.5 μM, 16 h) and UVA (6 kJ/m2) 1 h prior to polyA-pull-down assay. (F−H) Representative western blot analysis showing indicated time points of recovery of mRPCs isolated by polyA-pull-down from clonal of HAP1 RNF14 (F), RNF25 (G), and GCN1 (H) KO cells and matched AAVS1 control cells treated with 4-SU (2.5 μM, 16 h) and UVA (6 kJ/m2).
Figure 7
Figure 7
Cellular responses to RNA crosslinking damage (A) RNA crosslinking damage causes ribosome stalling and subsequent ribosome collisions, triggering ribosomal stress surveillance mechanisms, including ZAKα-dependent RSR activation and GCN2-dependent ISR activation. (B) A subset of mRPCs is subjected to rapid translation-coupled modification with atypical K6- and K48-linked ubiquitin chains by RNF14 (supported by RNF25 and GCN1), resulting in their proteasomal degradation.

Comment in

References

    1. Sullivan L.B., Gui D.Y., Vander Heiden M.G. Altered metabolite levels in cancer: implications for tumour biology and cancer therapy. Nat. Rev. Cancer. 2016;16:680–693. doi: 10.1038/nrc.2016.85. - DOI - PubMed
    1. Alizadeh E., Orlando T.M., Sanche L. Biomolecular damage induced by ionizing radiation: the direct and indirect effects of low-energy electrons on DNA. Annu. Rev. Phys. Chem. 2015;66:379–398. doi: 10.1146/annurev-physchem-040513-103605. - DOI - PubMed
    1. Ratnaike R.N. Acute and chronic arsenic toxicity. Postgrad. Med. J. 2003;79:391–396. doi: 10.1136/pmj.79.933.391. - DOI - PMC - PubMed
    1. Tretyakova N.Y., Groehler A.t., Ji S. DNA-protein cross-links: formation, structural identities, and biological outcomes. Acc. Chem. Res. 2015;48:1631–1644. doi: 10.1021/acs.accounts.5b00056. - DOI - PMC - PubMed
    1. Yan L.L., Zaher H.S. How do cells cope with RNA damage and its consequences? J. Biol. Chem. 2019;294:15158–15171. doi: 10.1074/jbc.REV119.006513. - DOI - PMC - PubMed