. 2024 Apr 4;147(4):1436-1456.
doi: 10.1093/brain/awad380.

Bi-allelic ACBD6 variants lead to a neurodevelopmental syndrome with progressive and complex movement disorders

Rauan Kaiyrzhanov  1 Aboulfazl Rad  2   3 Sheng-Jia Lin  4 Aida Bertoli-Avella  5 Wouter W Kallemeijn  6   7 Annie Godwin  8 Maha S Zaki  9 Kevin Huang  4 Tracy Lau  1 Cassidy Petree  4 Stephanie Efthymiou  1 Ehsan Ghayoor Karimiani  10   11 Maja Hempel  12   13 Elizabeth A Normand  14 Sabine Rudnik-Schöneborn  15 Ulrich A Schatz  15   16 Marc P Baggelaar  6   17 Muhammad Ilyas  18   19 Tipu Sultan  20 Javeria Raza Alvi  20 Manizha Ganieva  21 Ben Fowler  22 Ruxandra Aanicai  5 Gulsen Akay Tayfun  23 Abdulaziz Al Saman  24 Abdulrahman Alswaid  25 Nafise Amiri  26 Nilufar Asilova  21 Vorasuk Shotelersuk  27 Patra Yeetong  28 Matloob Azam  29 Meisam Babaei  30 Gholamreza Bahrami Monajemi  31 Pouria Mohammadi  32   33 Saeed Samie  31 Selina Husna Banu  34 Jorge Pinto Basto  5 Fanny Kortüm  12 Mislen Bauer  35 Peter Bauer  5 Christian Beetz  5 Masoud Garshasbi  33 Awatif Hameed Issa  36 Wafaa Eyaid  37 Hind Ahmed  37 Narges Hashemi  38 Kazem Hassanpour  39 Isabella Herman  40   41   42   43 Sherozjon Ibrohimov  21 Ban A Abdul-Majeed  44 Maria Imdad  45 Maksudjon Isrofilov  21 Qassem Kaiyal  46 Suliman Khan  5 Brian Kirmse  47 Janet Koster  48 Charles Marques Lourenço  49 Tadahiro Mitani  41 Oana Moldovan  50 David Murphy  51 Maryam Najafi  52   53 Davut Pehlivan  40   41 Maria Eugenia Rocha  5 Vincenzo Salpietro  1 Miriam Schmidts  52   53   54 Adel Shalata  55   56 Mohammad Mahroum  54 Jawabreh Kassem Talbeya  55   57 Robert W Taylor  58   59 Dayana Vazquez  35 Annalisa Vetro  60 Hans R Waterham  48 Mashaya Zaman  34 Tina A Schrader  61 Wendy K Chung  62   63 Renzo Guerrini  60   64 James R Lupski  41   42   65 Joseph Gleeson  66   67 Mohnish Suri  68 Yalda Jamshidi  10   69 Kailash P Bhatia  51 Barbara Vona  3   70   71 Michael Schrader  61 Mariasavina Severino  72 Matthew Guille  8 Edward W Tate  6   7 Gaurav K Varshney  4 Henry Houlden  1 Reza Maroofian  1
Affiliations

Bi-allelic ACBD6 variants lead to a neurodevelopmental syndrome with progressive and complex movement disorders

Rauan Kaiyrzhanov et al. Brain. .

Abstract

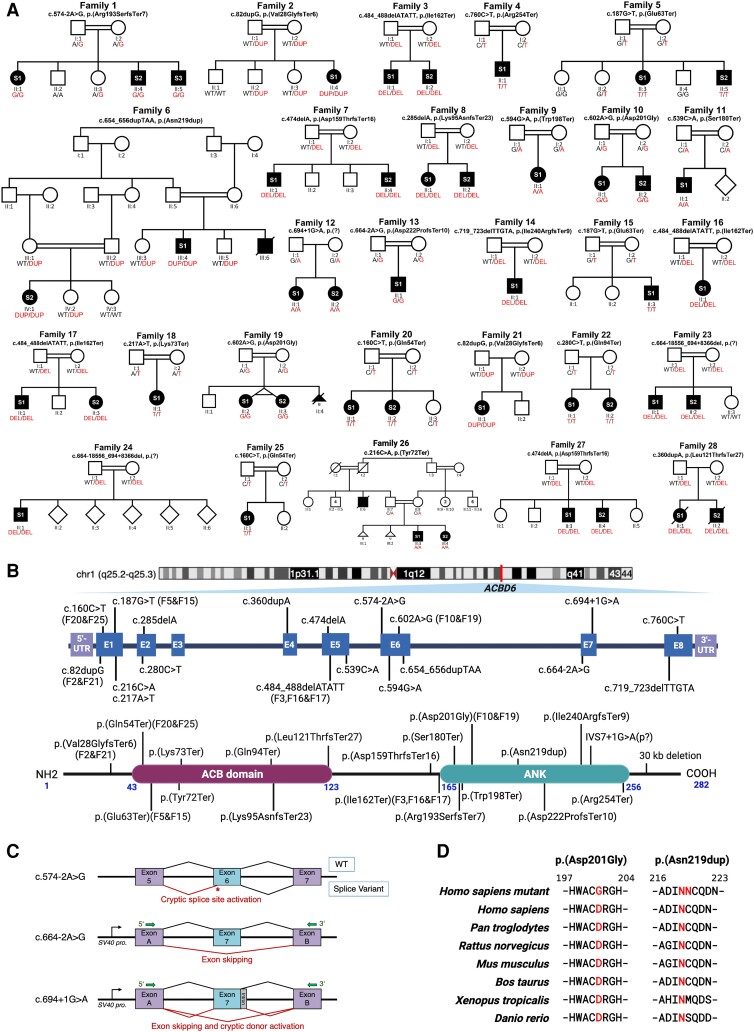
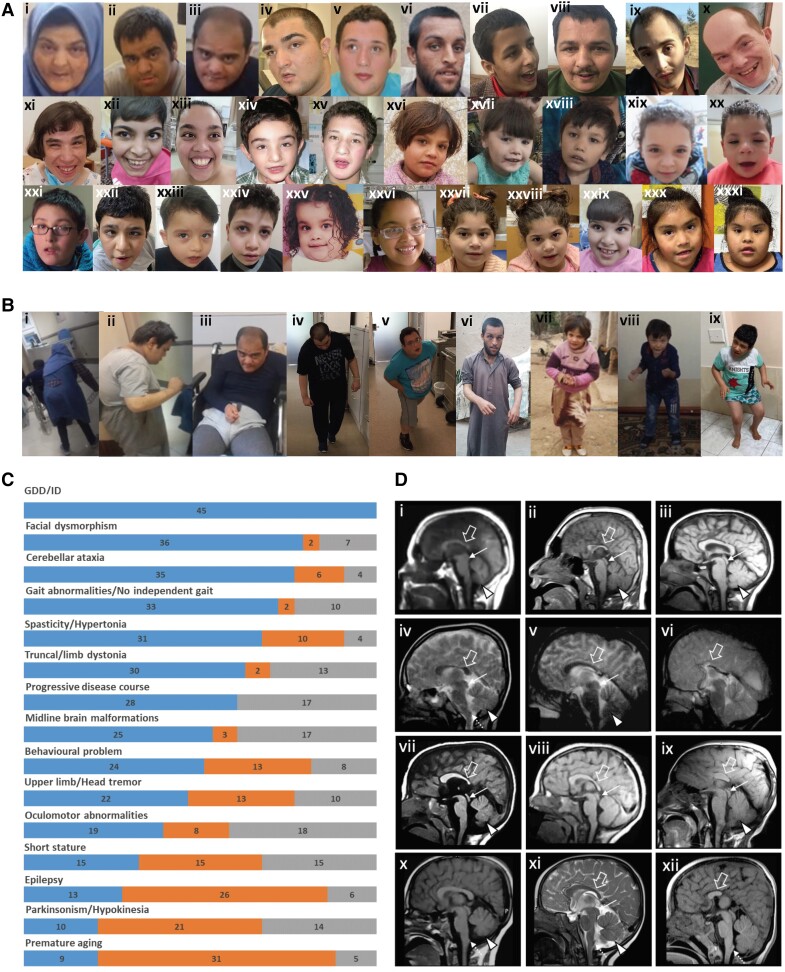
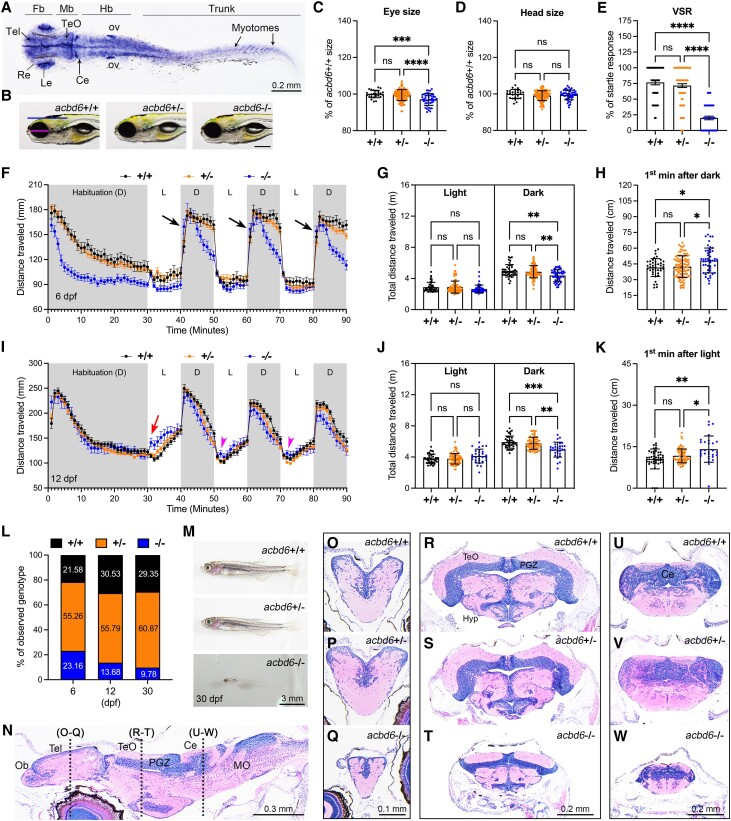
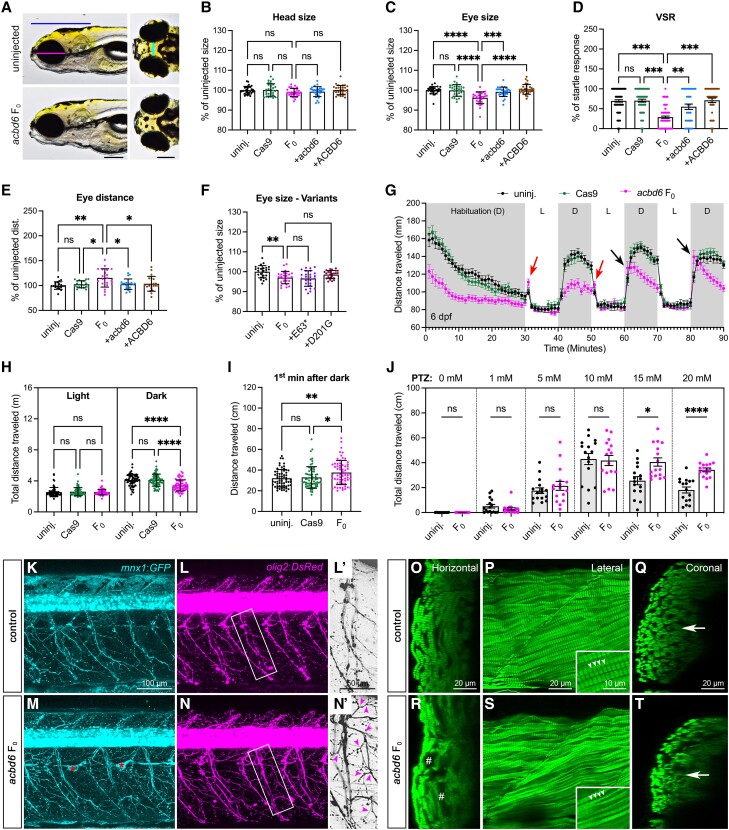
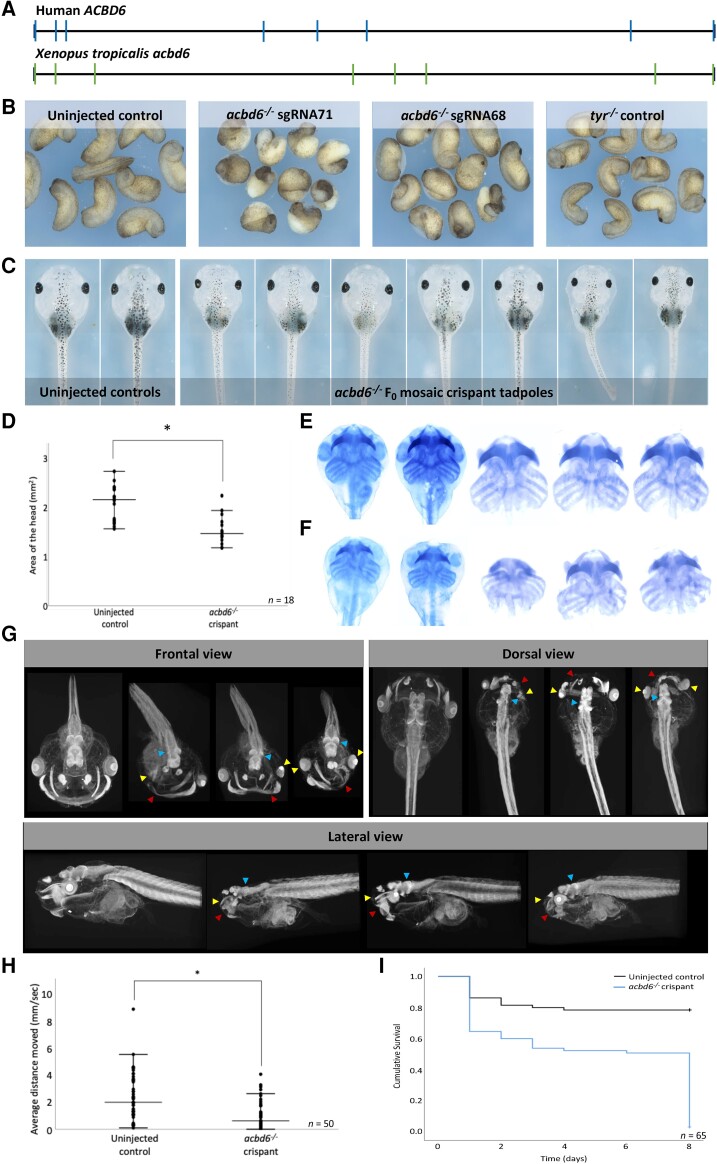
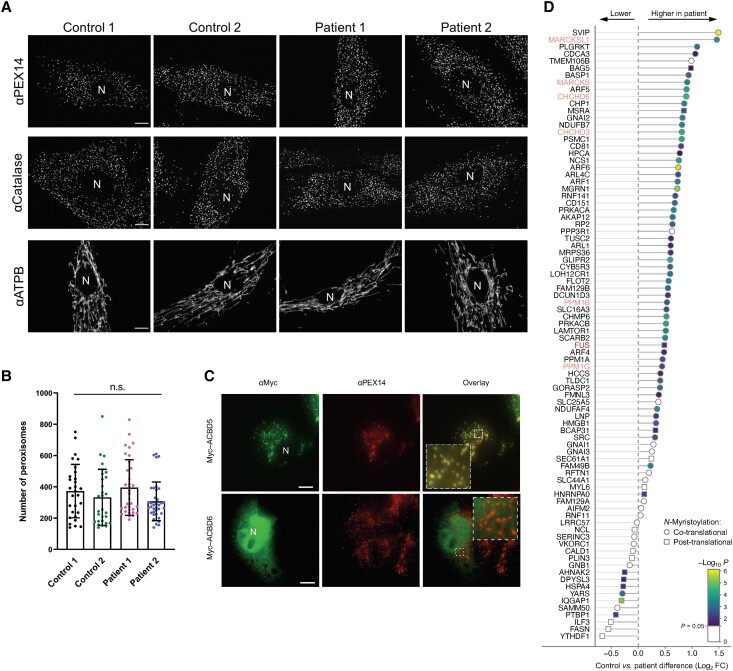
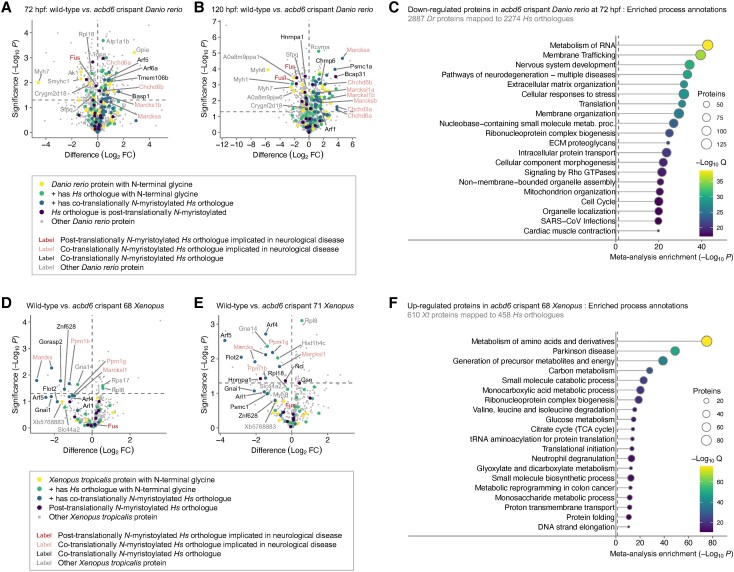
The acyl-CoA-binding domain-containing protein 6 (ACBD6) is ubiquitously expressed, plays a role in the acylation of lipids and proteins and regulates the N-myristoylation of proteins via N-myristoyltransferase enzymes (NMTs). However, its precise function in cells is still unclear, as is the consequence of ACBD6 defects on human pathophysiology. Using exome sequencing and extensive international data sharing efforts, we identified 45 affected individuals from 28 unrelated families (consanguinity 93%) with bi-allelic pathogenic, predominantly loss-of-function (18/20) variants in ACBD6. We generated zebrafish and Xenopus tropicalis acbd6 knockouts by CRISPR/Cas9 and characterized the role of ACBD6 on protein N-myristoylation with myristic acid alkyne (YnMyr) chemical proteomics in the model organisms and human cells, with the latter also being subjected further to ACBD6 peroxisomal localization studies. The affected individuals (23 males and 22 females), aged 1-50 years, typically present with a complex and progressive disease involving moderate-to-severe global developmental delay/intellectual disability (100%) with significant expressive language impairment (98%), movement disorders (97%), facial dysmorphism (95%) and mild cerebellar ataxia (85%) associated with gait impairment (94%), limb spasticity/hypertonia (76%), oculomotor (71%) and behavioural abnormalities (65%), overweight (59%), microcephaly (39%) and epilepsy (33%). The most conspicuous and common movement disorder was dystonia (94%), frequently leading to early-onset progressive postural deformities (97%), limb dystonia (55%) and cervical dystonia (31%). A jerky tremor in the upper limbs (63%), a mild head tremor (59%), parkinsonism/hypokinesia developing with advancing age (32%) and simple motor and vocal tics were among other frequent movement disorders. Midline brain malformations including corpus callosum abnormalities (70%), hypoplasia/agenesis of the anterior commissure (66%), short midbrain and small inferior cerebellar vermis (38% each) as well as hypertrophy of the clava (24%) were common neuroimaging findings. Acbd6-deficient zebrafish and Xenopus models effectively recapitulated many clinical phenotypes reported in patients including movement disorders, progressive neuromotor impairment, seizures, microcephaly, craniofacial dysmorphism and midbrain defects accompanied by developmental delay with increased mortality over time. Unlike ACBD5, ACBD6 did not show a peroxisomal localization and ACBD6-deficiency was not associated with altered peroxisomal parameters in patient fibroblasts. Significant differences in YnMyr-labelling were observed for 68 co- and 18 post-translationally N-myristoylated proteins in patient-derived fibroblasts. N-myristoylation was similarly affected in acbd6-deficient zebrafish and X. tropicalis models, including Fus, Marcks and Chchd-related proteins implicated in neurological diseases. The present study provides evidence that bi-allelic pathogenic variants in ACBD6 lead to a distinct neurodevelopmental syndrome accompanied by complex and progressive cognitive and movement disorders.

Keywords: ACBD6; N-myristoylation; ataxia; dystonia; neurodegeneration; parkinsonism.


Conflict of interest statement

E.W.T. is a director and shareholder of Myricx Pharma Ltd. and an inventor on a patent application describing NMT inhibitors including IMP-1088 [Bell, AS; Tate, EW; Leatherbarrow, RJ; Hutton, JA; Brannigan, JA, ‘Compounds and their use as inhibitors of N-myristoyl transferase’, PCT In Appl (2017) WO 2017001812]. E.A.N. is an employee of GeneDx, LLC. J.R.L. holds stock in 23andMe and is a consultant for Genome International. Y.J. is an employee of Novo Nordisk.

Figures

Figure 1
Figure 1
Family pedigrees, schematic variants’ representation, conserved regions of substitution variants in ACBD6, and splicing effects. (A) Pedigrees and segregation results for the 28 unrelated families. Double lines between individuals represent consanguinity. The 45 affected individuals recruited for the study are shaded and indicated with their respective subject (S) number (S1, S2 or S3). The segregation data for all individuals tested via Sanger sequencing are shown with the presence of the ACBD6 variant (red) and/or the reference allele (black), two red/black texts indicate a homozygous state and one red + one black text indicates a heterozygous state. The genotyping is based on the coding DNA sequence. DEL = deletion; DUP = duplication; WT = wild-type. (B) Top: Schematic representation of the gene and protein positions of detected variants in ACBD6. ACBD6 is located on chromosome 1 at cytogenetic position q25.2q25.3. Middle: The genetic variants mapped to the NM_032360.4 transcript of ACBD6. Bottom: ACBD6 variants mapped on the protein level. Three variants, including p.(Gly22fs), p.(Leu121ThrfsTer27) and a 30 kb deletion in the C-terminus, have been reported previously.,, Recurrent variants are labelled with family codes. (C) Splicing schematic for the c.574-2A>G (top) variant in ACBD6 showing cryptic acceptor splice site activation in exon 6. The c.664-2A>G (middle) and c.694+1G>A (bottom) variants affect splicing of exon 7 both show exon skipping. Additionally, the c.694+1G>A variant activates a cryptic donor splice site. (D) Interspecies alignment performed with Clustal Omega showing the complete conservation down to invertebrates of the amino acid residues affected by a missense variant leading to an amino acid substitution p.(Asp201Gly) and an in-frame duplication p.(Asn219dup).
Figure 2
Figure 2
Clinical features of the affected individuals with bi-allelic ACBD6 variants. [A(ixiii)] Representative photographs demonstrating facial features of the affected individuals in adulthood: F1:S1 (i); F1:S2 (ii); F1:S3 (iii); F3:S2 (iv); F3:S1 (v); F6:S1 (vi); F7:S2 (vii); F7:S1 (viii); F11:S1 (ix); F17:S1 (x); F17:S2 (xi); F20:S1 (xii); and F16:S1 (xiii). [A(xivxxxi)] Representative photographs demonstrating facial features of the affected individuals in childhood: F3:S2 (xiv) at 5 years old; F3:S1 (xv) at 12 years old; F6:S2 (xvi); F8:S1 (xvii); F8:S2 (xviii); F10:S1 (xix); F10:S2 (xx); and F11:S1 (xxi) at younger age; F13:S1 (xxii); F14:S1 (xxiii); F15:S1 (xxiv); F16:S1 (xxv) at 2 years old; F16:S1(xxvi) at 4 years old; F19:S1 (xxvii); F19:S2 (xxviii); F20:S2 (xxix); F12:S1 (xxx); and F12:S2 (xxxi). The most frequently seen facial dysmorphologies in adults are high nasal ridge, full nasal tip, small mouth, thin upper lip and broad chin. The most frequently seen facial dysmorphologies in children are bifrontal/bitemporal narrowing, arched eyebrows, hypertelorism, up-slanting palpebral fissures, depressed nasal bridge, full nasal tip, thin upper lip, full lower lip and broad chin. [B(iix)] Representative photographs demonstrating postural abnormalities seen in the affected individuals. A stooped body posture and lateral flexion of the trunk can be seen in the individuals F1:S1 (i), F1:S2 (ii), F1:S3 (iii), F3:S1 (iv), F3:S2 (v), F6:S1 (vi), F6:S2 (vii), F8:S2 (viii) and F13:S1 (ix). (C) Bar graph summarizing proportions of various clinical findings in the ACBD6 cohort. Blue = affected; orange = unaffected; grey = not ascertained/not applicable. GDD = global developmental delay; ID = intellectual disability. [D(ixii)] Representative neuroimaging features of the affected individuals. Brain MRI, midline sagittal images of the affected individuals F1:S1 (i), F1:S2 (ii), F5:S1(iii), F56:S2 (iv), F7:S1 (v), F7:S2 (vi), F10:S1 (vii), F10:S2 (viii), F11:S1 (ix), F13:S1 (x), F14:S1 (xi) and F19:S1 (xii). Most of the affected individuals have corpus callosum agenesis or hypoplasia with prevalent involvement of the posterior sections (empty arrows), variably associated with short midbrain (thin arrows) and small inferior cerebellar vermis (arrowheads). In addition, mild hypertrophy of the clava was noted in some subjects (dotted arrows). Note that the anterior commissure was markedly hypoplastic or absent in all affected individuals.
Figure 3
Figure 3
CRISPR/Cas9 mutation of zebrafish acbd6 causes smaller eyes, impaired vision, abnormal locomotion, developmental delay and increased mortality. (A) Whole-mount in situ hybridization for detecting acbd6 mRNA expression pattern in zebrafish embryo at 24 hours post-fertilization (hpf). fb = forebrain; mb = midbrain; MHB = midbrain and hindbrain boundary; hb = hindbrain; ov = otic vesicle. Dorsal view to the top, anterior to the left. (B) Representative images of wild-type (acbd6+/+), heterozygous (acbd6+/−) and homozygous (acbd6−/−) mutant larva at 6 days post-fertilization (dpf). Head size and eye size are indicated by blue and red lines, respectively. Anterior to the left and dorsal to the top. Scale bar = 200 μm. (C and D) Quantification of eye and head size as indicated in B. +/+ (n = 26 larvae), +/− (n = 114 larvae) and −/− (n = 47 larvae). Each symbol represents one larva. Values are calculated as a percentage of the mean value of +/+ larvae. Error bars = mean ± standard deviation (SD). (E) The result of visual startle response analysis performed on +/+ (n = 43 larvae), +/− (n = 99 larvae) and −/− (n = 48 larvae) zebrafish larvae at 6 dpf. Each symbol represents one larva. The number of responses for five stimuli of each larva is calculated as a percentage of responses. Error bars = mean ± standard error of the mean (SEM). (F) Locomotor activities of zebrafish larvae in light and dark periods at 6 dpf. +/+ (n = 42 larvae), +/− (n = 99 larvae) and −/− (n = 48 larvae) zebrafish larvae were habituated in the dark for 30 min, followed by three cycles of 10-min time bins of light and dark periods. Black arrows indicate the increased movement of homozygous mutants at the first minute in the dark. Error bars = mean ± SEM. D = dark period; L = light period. (G) Average cumulative distance travelled by each larva from three cycles of either light or dark periods in F. Error bars = mean ± SD. (H) Average cumulative distance travelled by each larva during the first minute of the dark period across three cycles as indicated by black arrows in F. Error bars = mean ± SD. (I) Locomotor activities of zebrafish larvae in light and dark conditions at 12 dpf. +/+ (n = 39 larvae), +/− (n = 71 larvae) and −/− (n = 29 larvae). Error bars = mean ± SEM. Red arrow indicates increased movement of homozygous mutants at the first minute after light on. Red arrowhead indicates increased movement of homozygous mutants at the second minute after light on. (J) Average cumulative distance travelled by each larva during three cycles of either light or dark periods in I. Error bars = mean ± SD. (K) Average cumulative distance travelled by each larva during the first cycle of the first minute of the light period as indicated by red arrow in I. Error bars = mean ± SD. (L) Genotyping results of zebrafish at 6 dpf (n = 191 larvae), 12 dpf (n = 196 larvae) and 30 dpf (n = 118 juveniles) stages from acbd6+/− intercross. (M) Representative images of morphological phenotype from acbd6+/+, acbd6+/− and acbd6−/− at 30 dpf. Anterior to the left and dorsal to the top. (N) Sagittal section of acbd6+/+ brain at 30 dpf. Anterior to the left and dorsal to the top. MO = medulla oblongata; Ob = olfactory bulb; PGZ = periventricular grey zone of optic tectum. (OW) Representative images of transverse sections of telencephalon (OQ), optic tectum (RT) and cerebellum (UW) from acbd6+/+, acbd6+/− and acbd6−/− juvenile as indicated in N. In C and D, one-way ANOVA with Tukey’s multiple comparisons test; in E, G, H, J and K, one-way ANOVA with Dunnett’s T3 multiple comparisons test; ns, not significant; *P < 0.05; **P < 0.01; ***P < 0.001; ****P < 0.0001.
Figure 4
Figure 4
Zebrafish acbd6 F0 knockouts exhibit increased susceptibility to chemical-induced seizures, excessive motor neuron branching and skeletal muscle degeneration. (A) Representative images of uninjected control and acbd6 F0 larvae at 6 days post-fertilization (dpf). Left: Ventral view, anterior to the left. Right: Dorsal view, anterior to the left. Blue line indicates head size; magenta line indicates eye size; and cyan line indicates eye distance. Scale bar = 0.2 mm. (B and C) Quantification of the head and eye size (n = 30 larvae for each group) of uninjected control (uninj.), acbd6 F0 knockout (F0), F0 + zebrafish wild-type acbd6 mRNA (+acbd6) and F0 + human wild-type ACBD6 mRNA (+ACBD6) as indicated in B. (D) The visual startle response (VSR) analysis after mRNA rescue at 6 dpf. n = 36 larvae for each group. Each symbol represents one larva. The number of responses to five stimuli of each larva was calculated as a percentage of responses. Error bars = mean ± standard error of the mean (SEM). (E) Quantification of the eyes distance (n = 20 larvae for each group) as indicated in B. (F) Quantification of the eye size of F0 knockout rescued with mRNA of human p.Glu63Ter (+E63*) or p.Asp201Gly (+D201G) variant. n = 25 larvae for each group. (G) Locomotor activities of zebrafish larvae in light and dark conditions at 6 dpf. n = 64 larvae for each group. The larvae were habituated in the dark for 30 min, followed by three cycles of 10-min periods of light and dark. Error bars represent the mean ± SEM. D = dark period; L = light period. Red arrows indicate increased movement of F0 1 min after light on, and black arrows indicate increased movement 1 min after light off. (H) Average cumulative distance travelled by each larva during three cycles of either light or dark periods in G. Error bars = mean ± standard deviation (SD). (I) The average cumulative distance traveled by each larva during the first minute of the dark period was measured over three cycles, as shown by the black arrow in G. Error bars represent the mean ± SD. (J) The average cumulative distance traveled by the larvae was measured for each group after being treated with different doses of pentylenetetrazole (PTZ) at 5 dpf. n = 16 larvae for each group. (KN) Confocal images of Tg(mnx1:GFP; olig2:DsRed) larva at 12 dpf are shown, with transgenic larvae injected with slc45a2 sgRNA used as a control and those injected with acbd6 + slc45a2 sgRNAs shown as acbd6 F0. (L' and N') Enlarged images from white boxes are shown in L' and N', with red asterisks indicating autofluorescence from remaining pigment cells. GFP and DsRed are displayed in cyan and magenta, respectively, with magenta arrowheads indicating excess axonal arborizations. The images are presented in a lateral view, with anterior to the left and dorsal to the top. Additional motor neuron phenotypes at 6 and 12 dpf can be found in Supplementary Fig. 13. (OT) Confocal images of stained skeletal muscle fibers with phalloidin are presented, including images from slc45a2 sgRNA-injected control (OQ) and acbd6 + slc45a2 sgRNA-injected (R and S) larvae at 12 dpf. Orthogonal views generated from P and S using the Orthogonal views tool in ImageJ are also displayed. #Degenerated muscles. White arrowheads and a white arrow indicate Z-discs and the thickness of the myotube, respectively. Supplementary Fig. 14 provides additional muscle phenotypes at 6 and 12 dpf. In BD and F, one-way ANOVA with Tukey’s multiple comparisons test; E and HJ, one-way ANOVA with Dunnett’s T3 multiple comparisons test; ns, not significant; *P < 0.05; **P < 0.01; ***P < 0.001; ****P < 0.0001.
Figure 5
Figure 5
Xenopus tropicalis (acbd6) crispants have gastrulation, movement, craniofacial, brain and eye defects together with microcephaly. (A) The gene structure of human (ACBD6) and X. tropicalis (acbd6) reveals eight exons. (B) Gastrulation defects, including failure of blastopore closure and anterior posterior defects, were observed in F0X. tropicalis embryos injected with two different CRISPR/Cas9 constructs (sgRNA-68 and sgRNA-71) disrupting exon 1 of acbd6. (C) Those animals surviving to free-feeding stages presented with microcephaly, craniofacial dysmorphism and eye abnormalities. (D) The differences in head size between the uninjected control (2.07 ± 0.36 mm) and acbd6 crispant tadpoles (1.52 ± 0.27 mm, sgRNA-68) were found to be significant, t(34) = 5.183, P < 0.001. (E and F) Alcian blue staining marking the cartilaginous structures in the head and neck show equivalent structures between control (E) and acbd6 crispant tadpoles (F), revealing no gross morphological abnormalities. (G) Detailed structural analysis in higher resolution microCT imaging (1% phosphotungstic acid contrast stain) revealed significant structural abnormalities in the facial musculature (red arrows; G), abnormalities of the eye (microphthalmia, anophthalmia; yellow arrows, G) and structural abnormalities in the brain most pronounced in the midbrain regions (blue arrow, G). (H) Locomotion analysis at NF44/45 revealed that crispants moved significantly less than control tadpoles. (I) The Kaplan–Meier survival analysis of 65 control and crispant tadpoles shows two periods of crispant-specific decline, the first at gastrula stages (Day 0–1) and the second with post-feeding [Day 8, Nieuwkoop and Faber (NF) stage 47].
Figure 6
Figure 6
Morphological characteristics of peroxisomes in ACBD6-deficient patient cells are not altered and chemical proteomic profiling of N-myristoylation in human fibroblasts. (A) Patient fibroblasts and controls were processed for immunofluorescence microscopy using antibodies against the peroxisomal membrane marker PEX14, the matrix marker catalase or mitochondrial ATP synthetase B (ATPB). Peroxisomal localization of PEX14 and catalase indicate that peroxisomal membrane and PTS1-dependent matrix import are normal. Note that the morphology of mitochondria, which are elongated in fibroblasts, was also not altered when compared to controls. (B) Quantification of peroxisome number based on immunofluorescence images (see A for representative images) (n = 29–36 cells). Data are from three independent experiments. ns, not significant; Kruskal–Wallis ANOVA test with Dunn’s multiple comparisons. (C) COS-7 cells were transfected with plasmids encoding Myc-ACBD5 or Myc-ACBD6 and processed for immunofluorescence microscopy using antibodies against Myc and PEX14. Note that Myc-ACBD5 localizes to peroxisomes, whereas Myc-ACBD6 localizes to the nucleus and the cytoplasm in COS-7 cells. Scale bars = 10 µm. (D) Ranked plot of myristic acid alkyne (YnMyr)-labelled, known co- and post-translationally N-myristoylated proteins, as identified in Supplementary Fig. 18E. Position on the left equals lower abundance in ACBD6 deficient fibroblasts, position on the right equals higher abundance in ACBD6 deficient fibroblasts.
Figure 7
Figure 7
Chemical and whole proteome analysis of acbd6 wild-type and crispant zebrafish and Xenopus tropicalis model systems. (A) Volcano plot comparing myristic acid alkyne (YnMyr) labelling of proteins in wild-type and acbd6 crispant zebrafish at 72 h post-fertilization (hpf). (B) Comparing YnMyr labelling of proteins in wild-type and acbd6 crispant zebrafish at 120 hpf. Further description as in A. (C) Top 20 biological processes most significantly enriched in proteins downregulated in acbd6 crispant zebrafish at 72 hpf. (D) Volcano plot comparing YnMyr labelling of proteins in wild-type and acbd6 crispant 68 X. tropicalis. (E) Comparing YnMyr labelling of proteins in wild-type and acbd6 crispant 71 X. tropicalis. Further description as in D. (F) Top 20 biological processes most significantly enriched in proteins upregulated in acbd6 crispant 68 X. tropicalis. Most significantly enriched processes are at the top. In A and D, position on the left equals reduced in crispant; position on the right equals increased in crispant. Horizontal dotted line indicates significance threshold (P = 0.05). FC = fold-change. In C and F, the most significantly enriched process is at the top. Colour indicates Q-value as secondary significance indicator. Size of circle indicates a number of proteins enriched in the depicted process. Dr = Danio rerio; Hs = Homo sapiens; Xt = X. tropicalis.

References

    1. Neess D, Bek S, Engelsby H, Gallego SF, Færgeman NJ. Long-chain acyl-CoA esters in metabolism and signaling: Role of acyl-CoA binding proteins. Prog Lipid Res. 2015;59:1–25. - PubMed
    1. Islinger M, Costello JL, Kors S, et al. The diversity of ACBD proteins—From lipid binding to protein modulators and organelle tethers. Biochim Biophys Acta Mol Cell Res. 2020;1867:118675. - PMC - PubMed
    1. Bi J, Mischel PS. Acyl-CoA-Binding protein fuels gliomagenesis. Cell Metab. 2019;30:229–230. - PubMed
    1. Abu-Safieh L, Alrashed M, Anazi S, et al. Autozygome-guided exome sequencing in retinal dystrophy patients reveals pathogenetic mutations and novel candidate disease genes. Genome Res. 2013;23:236–247. - PMC - PubMed
    1. Bartlett M, Nasiri N, Pressman R, Bademci G, Forghani I. First reported adult patient with retinal dystrophy and leukodystrophy caused by a novel ACBD5 variant: A case report and review of literature. Am J Med Genet A. 2021;185:1236–1241. - PubMed

Publication types

Substances