. 2023 Nov 11;42(1):298.
doi: 10.1186/s13046-023-02869-w.

Anti-tumor activity of all-trans retinoic acid in gastric-cancer: gene-networks and molecular mechanisms

Affiliations

Anti-tumor activity of all-trans retinoic acid in gastric-cancer: gene-networks and molecular mechanisms

Luca Guarrera et al. J Exp Clin Cancer Res. .

Abstract

Background: Gastric-cancer is a heterogeneous type of neoplastic disease and it lacks appropriate therapeutic options. There is an urgent need for the development of innovative pharmacological strategies, particularly in consideration of the potential stratified/personalized treatment of this tumor. All-Trans Retinoic-acid (ATRA) is one of the active metabolites of vitamin-A. This natural compound is the first example of clinically approved cyto-differentiating agent, being used in the treatment of acute promyelocytic leukemia. ATRA may have significant therapeutic potential also in the context of solid tumors, including gastric-cancer. The present study provides pre-clinical evidence supporting the use of ATRA in the treatment of gastric-cancer using high-throughput approaches.

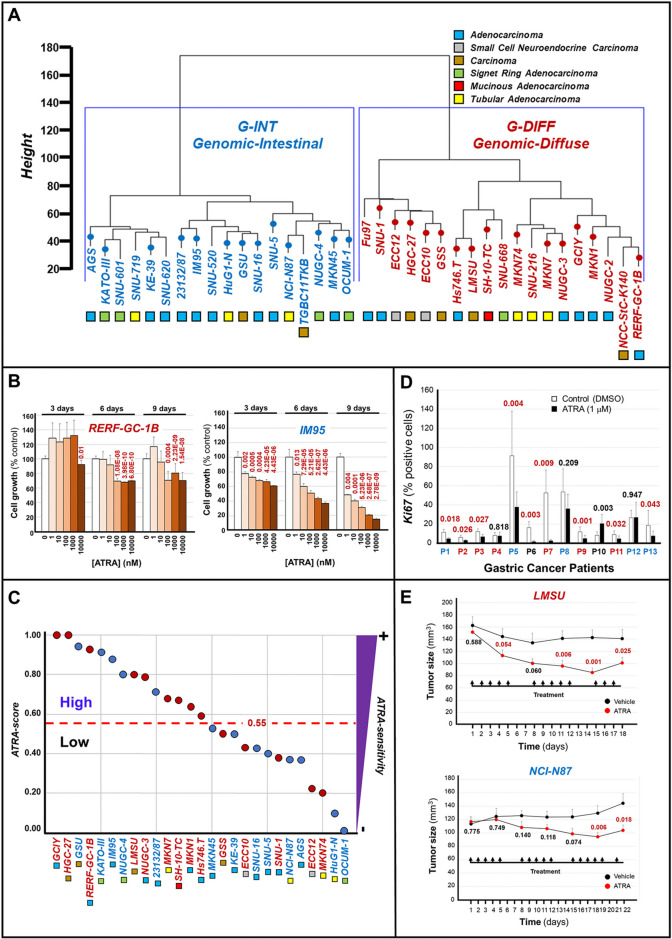
Methods: We evaluated the anti-proliferative action of ATRA in 27 gastric-cancer cell-lines and tissue-slice cultures from 13 gastric-cancer patients. We performed RNA-sequencing studies in 13 cell-lines exposed to ATRA. We used these and the gastric-cancer RNA-sequencing data of the TCGA/CCLE datasets to conduct multiple computational analyses.

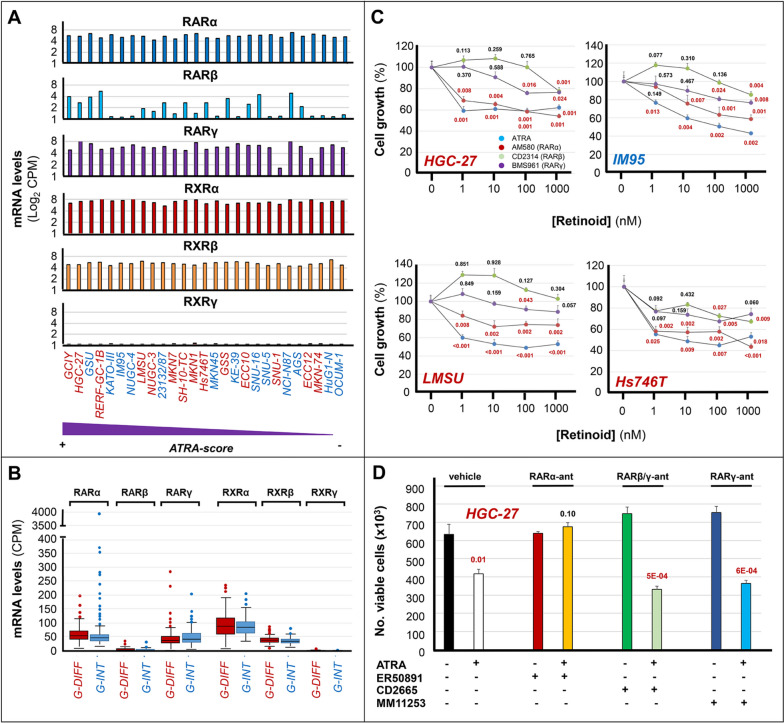
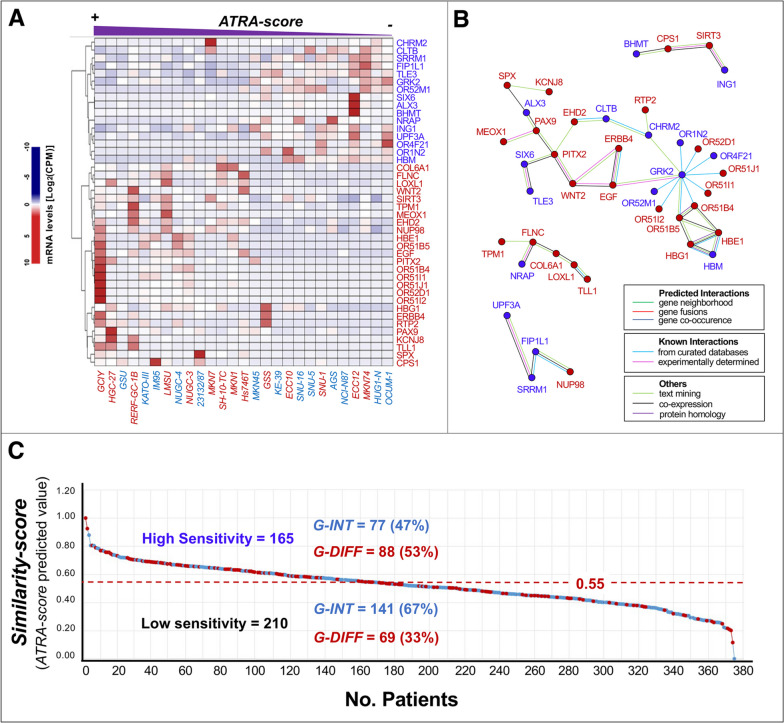
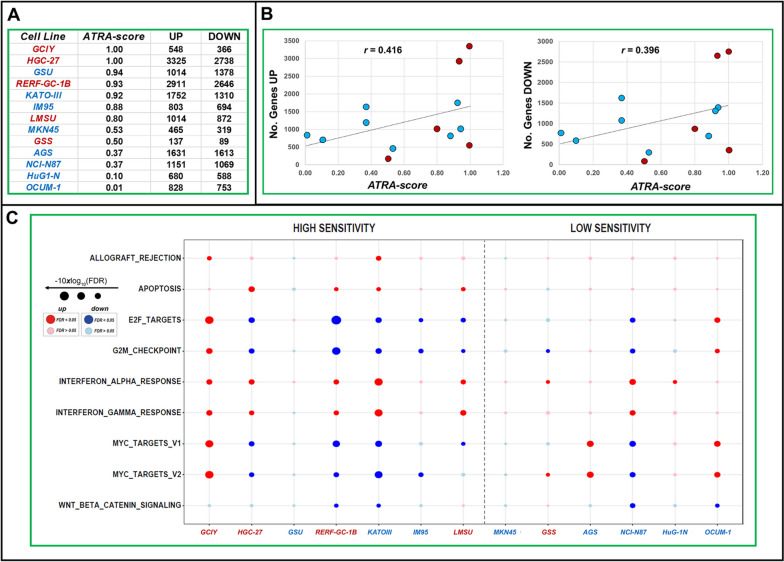
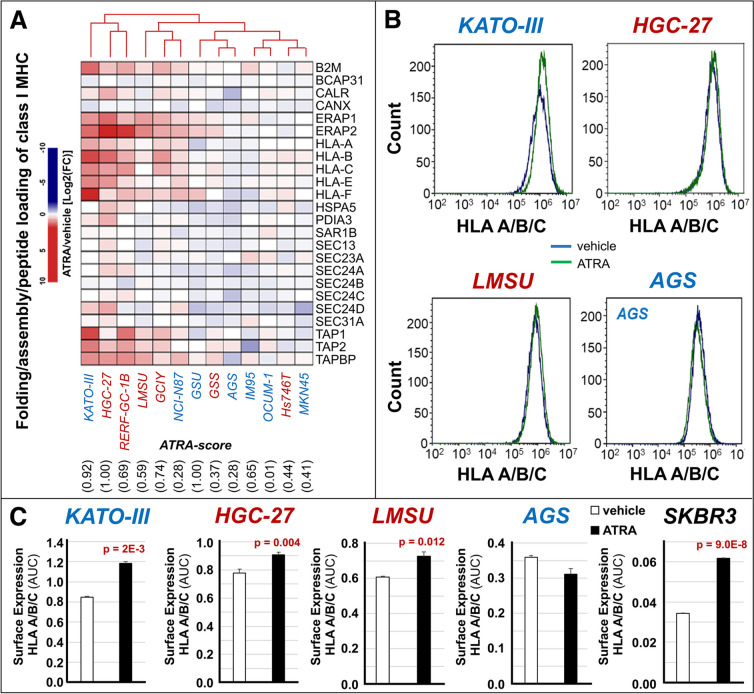
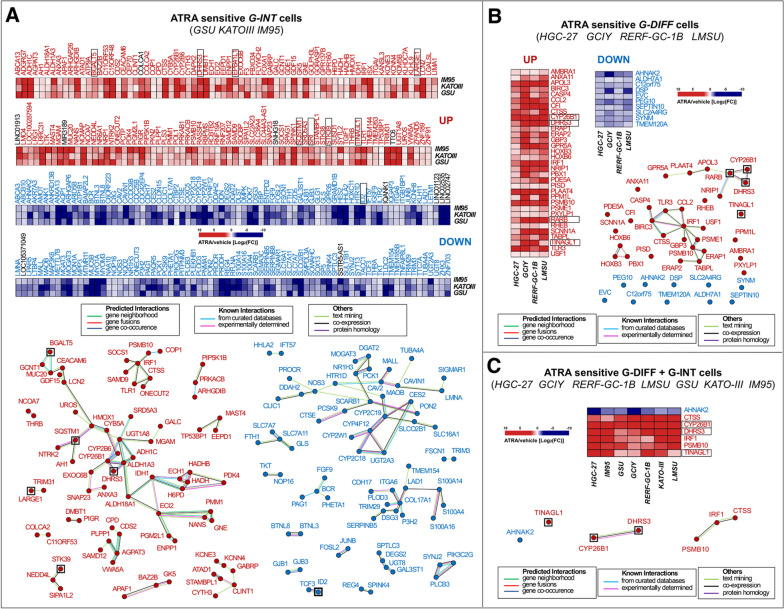
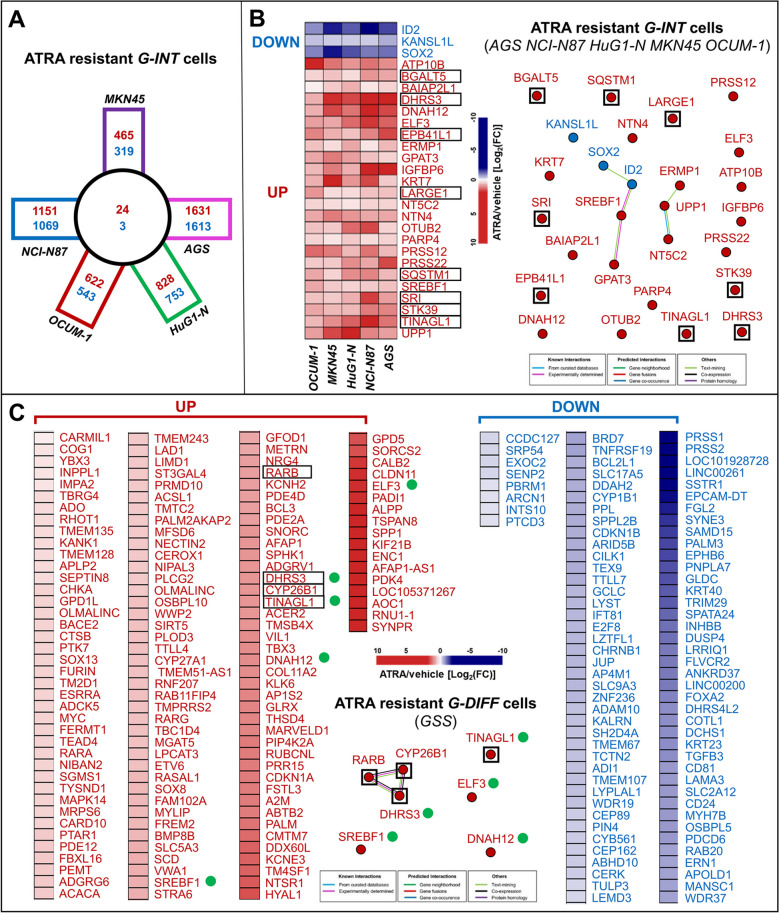
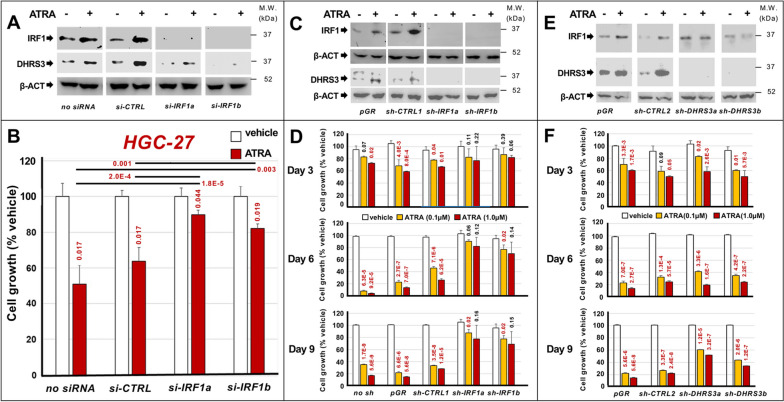
Results: Profiling of our large panel of gastric-cancer cell-lines for their quantitative response to the anti-proliferative effects of ATRA indicate that approximately half of the cell-lines are characterized by sensitivity to the retinoid. The constitutive transcriptomic profiles of these cell-lines permitted the construction of a model consisting of 42 genes, whose expression correlates with ATRA-sensitivity. The model predicts that 45% of the TCGA gastric-cancers are sensitive to ATRA. RNA-sequencing studies performed in retinoid-treated gastric-cancer cell-lines provide insights into the gene-networks underlying ATRA anti-tumor activity. In addition, our data demonstrate that ATRA exerts significant immune-modulatory effects, which seem to be largely controlled by IRF1 up-regulation. Finally, we provide evidence of a feed-back loop between IRF1 and DHRS3, another gene which is up-regulated by ATRA.

Conclusions: ATRA is endowed with significant therapeutic potential in the stratified/personalized treatment gastric-cancer. Our data represent the fundaments for the design of clinical trials focusing on the use of ATRA in the personalized treatment of this heterogeneous tumor. Our gene-expression model will permit the development of a predictive tool for the selection of ATRA-sensitive gastric-cancer patients. The immune-regulatory responses activated by ATRA suggest that the retinoid and immune-checkpoint inhibitors constitute rational combinations for the management of gastric-cancer.

Keywords: All-trans-retinoic-acid; Gastric-cancer; IRF1; Immune-responses; RNA-sequencing.


Conflict of interest statement

All the authors declare that they have no conflict of interest as to the content of the present manuscript.

Figures

Fig. 1
Fig. 1
ATRA-dependent anti-tumor activity in gastric-cancer cell-lines, tissue-slice cultures of gastric-cancer specimens and LMSU/NCI-N87 mouse xenografts. A Unsupervised-hierarchical-clustering of the indicated gastric-cancer cell-lines based on the gene-expression profiles determined with the RNA-seq results (TCGA-dataset): cell-lines are classified according to transcriptomic-profile (G-DIFF=red; G-INT=blue) and histochemical-characteristics (colored-boxes). B ATRA growth-inhibitory effects in RERF-GC-1B (G-DIFF, red) and IM95 (G-INT, blue) cell-lines: the values are normalized for the vehicle-treated controls, which are taken as 100%. Each point is the mean±SD of 10 cultures. When the cell-growth results observed in ATRA-treated specimens are significantly lower than those of the vehicle-treated counterparts, p-values (two-tailed Student’s t-test) are shown in red. C Gastric-cancer cell-lines are ranked according to the ATRA-score values: the bimodal and arbitrary threshold-value of 0.55 separates the cell-lines characterized by high ATRA-sensitivity (ATRA-score >0.55) from the cell-lines showing low ATRA-sensitivity (ATRA-score <0.55). Each calculated value is representative of at least 2 independent experiments. D Surgical specimens of 13 patients (P1-P13) were challenged with vehicle (DMSO) or ATRA (1.0 μM) for 48 hours: P3-P6-P9=female-patients; P1-P2-P4-P5-P7-P8-P10-P11-P12-P13= male-patients; G-INT-cases=blue; G-DIFF-cases=red; not-determined=black. Each value = Mean ± SE of 5 histological-fields/experimental-sample. The p-values (two-tailed Student's t-test) of the comparisons between the ATRA and corresponding vehicle-treated samples are shown. When the Ki67 amounts observed in ATRA-treated specimens are lower than those of the vehicle-treated counterparts, the p-values are marked in red. E Mice were xenografted subcutaneously with 1×10⁷ LMSU or NCI-N87 cells on both flanks. One week after transplantation, 10 animals/experimental group were treated with vehicle (DMSO) or ATRA (15.0 mg/kg) intra-peritoneally once/day, 5-days/week, as indicated (arrows). The calculated volumes of the tumors are plotted. As for LMSU, each point is the Mean ± SE of 15 and 19 tumors in the case of DMSO- and ATRA-treated animals, respectively. As for NCI-N87, each point is the Mean ± SE of 19 and 22 tumors. We compared the vehicle and ATRA-treated values at each time-point and the p-values (two-tailed Student’s t-test) of each comparison are shown
Fig. 2
Fig. 2
RAR and RXR mRNAs expression and RAR agonists anti-proliferative effects in gastric-cancer. A The panel shows the constitutive expression levels of the mRNAs coding for the indicated RAR and RXR isoforms in our panel of 27 gastric-cancer cell-lines. The cell-lines are ranked according to their decreasing sensitivity to the anti-proliferative effects of ATRA from left to right, as indicated. The expression values of the RAR and RXR mRNAs in gastric-cancer cell-lines are calculated using the RNA-seq results of the CCLE database. The values are expressed as Log 2 [CPM (Counts Per Million)]. G-DIFF and G-INT cell-lines are marked in red and blue, respectively. B The box plots indicate the constitutive expression levels of the mRNAs coding for the indicated RAR and RXR isoforms in gastric-cancer tissues characterized by a G-DIFF (red) or a G-INT (blue) phenotype. The values are calculated with the RNA-seq results of the TCGA database. The results are expressed as the Median [CPM] values  ±  SD. C The indicated G-DIFF (HGC-27; LMSU; Hs746T) and G-INT (IM95) cell-lines were exposed to vehicle (DMSO; [Retinoid] = 0 nM) or the indicated concentrations of the pan-RAR agonist, ATRA, the RARα agonist, AM580, the RARβ agonist, CD2314, and the RARγ agonist, BMS961, for 6 days. At the end of the treatment, the growth of each cell line was evaluated with the MTS assay. Each value is the Mean  ±  SD of 5 independent cultures and the data are normalized for the growth value of vehicle-treated cells (100%). We compare each compound-treated sample with the corresponding vehicle-treated counterparts at the different concentrations of the compounds. In case of statistical significance (two-tailed Student’s t-test), the p-values are shown in red. When the p-values lack statistical significance, they are marked in black. D Three independent cultures of HGC-27 cells were exposed to vehicle (DMSO) the RARα antagonist, ER50891 (0.1 µM), the RARβ /γ antagonist, CD2665 (0.1 µM), or the RARγ antagonist, MM11253 (0.1 µM), in the absence and presence of ATRA (0.01 µM) for 9 days. At the end of the treatment, the number of viable cells was counted automatically. In all samples, cell viability was always  ≥  85%. The values indicated by the columns are the Mean  ±  SD of the 3 independent cultures considered. We compare each ATRA, ATRA + ER50891, ATRA + CD2665 and ATRA + MM11253 treated sample with the corresponding vehicle, ER50891, CD2665 and MM11253 treated counterparts. In case of statistical significance (two-tailed Student’s t-test), the p-values shown above the corresponding columns are marked in red
Fig. 3
Fig. 3
Transcriptomic model based on genes whose basal expression is associated with gastric-cancer cell-lines ATRA-scores. A The panel shows a heat-map illustrating the levels of the 42 genes whose constitutive expression is quantitatively associated with the ATRA-score values of the gastric-cancer cell-lines profiled for their sensitivity to ATRA. The mRNAs directly (high-Basal-Expression-Levels/high-ATRA-scores) and inversely (low-Basal-Expression-Levels/high-ATRA-scores) correlated with ATRA-sensitivity are marked in red and blue respectively. The expression values of the 42 mRNAs in gastric-cancer cell-lines are calculated with the use of the RNA-seq results available in the CCLE (Cancer Cell Line Encyclopedia) database. The values are expressed as Log 2 [CPM (Counts Per Million)]. The G-DIFF and G-INT cell-lines are marked in red and light-blue, respectively. B The panel illustrates the results of a STRING (Search-Tool-for-the-Retrieval-of-Interacting-Genes/Proteins) analysis performed on the 42 gene-products directly or inversely associated with ATRA-sensitivity. The genes directly and inversely associated with ATRA-sensitivity are marked by red and blue dots, respectively. C The panel shows the level of ATRA-sensitivity predicted in the 375 gastric-cancer samples of the TCGA dataset for which RNA-seq results are available. The predictions rest on the 42-gene model shown in panels (A) and (B) and they were generated with the use of a quantitative Similarity-score applied to the RNA-seq data. The ATRA-score threshold value of 0.55 is used to separate the cases predicted to be characterized by high ATRA-sensitivity (≥  0.55) and low ATRA-sensitivity (< 0.55). The G-DIFF and G-INT cases are marked in red and blue, respectively. The number and percentage of G-DIFF and G-INT cases observed in the high ATRA-sensitivity and low ATRA-sensitivity groups are indicated
Fig. 4
Fig. 4
Effects of ATRA on the gene-expression profiles of gastric cancer cells: RNA-seq pathway analysis. Exponentially growing triplicate cultures of the indicated cell lines were exposed to ATRA (1.0 µM) for 48 hours. At the end of the treatment cells were subjected to RNA-seq analysis (processed data in Table S4). A The panel shows the ATRA-sensitivity scores (ATRA-scores) of the 13 gastric cell-lines considered along with the number of genes significantly (FDR<0.1) up-regulated (UP) and down-regulated (DOWN) by ATRA (1.0µM) following 48 hours of exposure. B The diagram illustrates the correlations between the ATRA-score values and the number of genes up-regulated by the retinoid in our experimental conditions. The r-correlation values are indicated. C The RNA-seq data were subjected to pathway analysis using the HALLMARK data set. The Figure illustrates a Dot-Plot of the most significant HALLMARK pathways which are up-regulated (red dots) and down-regulated (blue dots) by ATRA in the indicated cell-lines. The size of the dots is inversely proportional to the FDR (False-Discovery-Rate) values calculated. When the FDR values are <0.1, they are considered to be statistically significant. The dots shown in dark color are statistically significant, while those shown in light color lack significance. Only the most relevant up- (red) or downregulated (blue) pathways are illustrated. The full results of the analysis are available in Fig. S4
Fig. 5
Fig. 5
Effects of ATRA on the process of antigen-presentation in gastric-cancer cell-lines. The indicated cell-lines were exposed to vehicle (DMSO) or ATRA (1µM) for 48 hours. At the end of the treatment, each cell-line was subjected to RNA-seq analysis. A The panel shows a heat-map illustrating the effects of ATRA on the expression levels of the 24 genes constituting the “Folding-Assembly-and-Peptide-Loading-of-Class-I-MHC” REACTOME gene-network in the indicated gastric-cancer cell-lines. The results are expressed as the ATRA-vehicle ratio [Log2FC (Fold-Change)]. The G-INT cell-lines are marked in blue and the G-DIFF cell-lines are marked in red. The cell-lines ATRA-score values are shown below the heat-map, as indicated. B and C The indicated gastric-cancer and the control SKBR3 breast cancer cell-lines were exposed to vehicle (DMSO) or ATRA (1µM) for 48 hours. At the end of the treatment, the cell-lines were subjected to FACS (Fluorescence-Activated-Cell-Sorter) analysis with an anti-HLA/B/C antibody. Panel B shows representative FACS graphs obtained with the indicated gastric-cancer cell-lines. Panel C shows the calculated FACS quantitative data. The data are expressed as the Mean+SD (N=3) of the AUC (Area Under the Curve) values determined from the FACS graphs. The surface expression of HLA/B/C was compared in each of the indicated vehicle-treated and ATRA-treated cell-lines. In case of significance (two-tailed Student’s t-test), the p-values of the comparisons are shown
Fig. 6
Fig. 6
Gene-networks modulated by ATRA in retinoid-sensitive G-INT and G-DIFF gastric-cancer cell-lines. The G-INT/ATRA-sensitive GSU/KATO-III/IM95 and the G-DIFF/ATRA-sensitive HGC-27/GCIY/RERF-GC-1B/LMSU cell-lines were exposed to vehicle (DMSO) or ATRA (1µM) for 48 hours and subjected to RNA-seq analysis. A Upper: heat-maps illustrating the effects of ATRA on the expression of the 297 genes commonly up-regulated (143 genes; UP) and down-regulated (154 genes; DOWN) in the 3 G-INT cell-lines (FDR < 0.1). The results (Mean of 3 independent vehicle-treated and ATRA-treated cultures) are expressed as the ATRA-vehicle ratio [Log2 FC (Fold Change)]. Up-regulated/genes=red; Down-regulated/genes=blue; Non-protein-coding/genes=black. Lower: STRING (Search-Tool-for-the-Retrieval-of-Interacting-Genes/Proteins) analysis of the 143 up-regulated gene-products (left diagram; red dots) and the 154 down-regulated gene-products (right diagram; blue dots). The proteins in black squares are encoded by genes up-regulated and down-regulated in the retinoid-resistant G-DIFF cell-lines, AGS, NCI-N87, HuG1-N, MKN45, OCUM-1. B Upper: 2 heat-maps illustrating the effects of ATRA on the expression levels of the 43 genes commonly (FDR < 0.1) up-regulated (33 genes; UP) and down-regulated (10 genes; DOWN) in the in the 4 G-DIFF gastric-cancer cell-lines. The results are expressed as the ATRA-vehicle ratio [Log2 FC (Fold Change)] and they represent the mean of 3 independent vehicle-treated and ATRA-treated cultures. Lower: STRING-analysis of the 33 up-regulated gene-products (red-dots) and the 10 down-regulated gene products (blue-dots). The proteins in black squares are encoded by genes up-regulated in the retinoid-resistant G-DIFF cell-line, GSS. C Upper: heat-map illustrating the effects of ATRA on the expression of the genes commonly up-regulated (6 genes; UP) and down-regulated (1 gene; DOWN) in ATRA-sensitive G-INT/G-DIFF cell-lines (FDR < 0.1). The results (mean of 3 vehicle-treated and ATRA-treated cultures) are expressed as the ATRA-vehicle ratio [Log2 FC (Fold Change)]. Lower: STRING-analysis of the 6 up-regulated gene products (upper diagram; red dots) and the single down-regulated gene product (lower diagram; blue dots) which are common to the 7 ATRA-sensitive G-DIFF and G-INT cell-lines shown in panels A and B. The type of protein interactions available in the literature are shown in the rectangular boxes
Fig. 7
Fig. 7
Gene-networks modulated by ATRA in retinoid-resistant G-INT and G-DIFF gastric cancer cell-lines. The G-INT/retinoid-resistant MKN45/NCI-N87/AGS/OCUM-1/HuG1-N cell-lines and the G-DIFF/retinoid-resistant GSS cell-line were exposed to vehicle (DMSO) or ATRA (1.0 µM) for 48 hours and subjected to RNA-seq analysis. A The panel illustrates the number of genes selectively up-regulated (red) or down-regulated (blue) in each G-INT cell-line (squares) and commonly up-regulated (red) or down-regulated (blue) in the 5 cell-lines (circle). B The left side of the panel shows a heat-map illustrating the effects of ATRA on the expression levels of the 27 genes commonly and significantly (FDR < 0.1) up-regulated (24 genes; UP) and down-regulated (3 genes; DOWN) in the 5 retinoid-resistant G-INT gastric-cancer cell-lines. The results are expressed as the ATRA-vehicle ratio [Log2 FC (Fold-Change)] and they represent the mean of 3 independent vehicle-treated and ATRA-treated cultures. The right side of the panel illustrates the results of a STRING (Search-Tool-for-the-Retrieval-of-Interacting-Genes/Proteins) analysis performed on the 24 up-regulated gene-products (red dots) and the 3 down-regulated gene products (blue dots). The proteins included in black squares are encoded by genes which are commonly up-regulated or down-regulated also in the 3 retinoid-sensitive G-INT cell-lines, GSU, KATO-III and IM95. C The panel shows two heat-maps illustrating the effects of ATRA on the expression levels of the 225 genes significantly (FDR < 0.1) up-regulated (137 genes; UP) and down-regulated (88 genes; DOWN) in the retinoid-resistant G-DIFF cell-line, GSS. In addition, the panel illustrates the results of a STRING analysis performed on the 7 gene products which are commonly up-regulated by ATRA in the GSS and the retinoid-sensitive G-DIFF cell-lines, HGC-27, LMSU, GCIY and RERF-GC-1B (black squares) or the retinoid-resistant G-INT cell-lines, MKN45, NCI-N87, AGS, OCUM-1 and HuG1-N (green dots). The results are expressed as the ATRA-vehicle ratio [Log2 FC (Fold-Change)] and they represent the mean of 3 independent vehicle-treated and ATRA-treated cultures.
Fig. 8
Fig. 8
IRF1 and DHRS3 involvement in the anti-proliferative effects exerted by ATRA in HGC-27 cells. HGC-27 cells were transfected with two IRF1-targeting (si-IRF1a/si-IRF1b) and a control siRNA (si-CTRL). Twenty-four hours later, cells were treated with vehicle (DMSO) or ATRA (1µM) for 48 hours. A Western-blot analysis using anti-IRF1, anti-DHRS3 and anti-βactin antibodies: the lanes marked as “no-siRNA” indicate parental HGC-27 cells. B Cell-growth of transfected HGC-27 cells (MTS-assay): Mean+SD of 3 replicate cultures; values normalized for vehicle-treated cells (100%). The p-values (two-tailed Student's t-test) of the comparisons between ATRA-treated and vehicle-treated cells and the comparisons between the indicated groups are shown above each red column and above the diagram, respectively. C HGC-27 cells were infected with lentiviral particles containing 2 IRF1-targeting-shRNAs (sh-IRF1a/sh-IRF1b), one control-shRNA (sh-CTRL1) or the pGreenPuro-vector (pGR). Following puromycin-selection, we isolated 4 green-fluorescent cell-populations characterized by pGR­-, sh-CTRL-, sh-IRF1a- and sh-IRF1b­-integration. The cell-populations were treated with vehicle or ATRA (1µM) for 48 hours and subjected to Western-blot analysis using anti-IRF1, anti-DHRS3 and anti-βactin antibodies as in (A). D The pGR-, sh-CTRL-, sh-IRF1a­- and sh-IRF1b-infected cell-populations were treated with vehicle or ATRA (0.1µM/1.0µM) for 3/6/9 days: “no-sh”=parental-HGC-27 cells. Cell-growth (MTS-assay): each value is the Mean+SD of 3 cultures; values are normalized as in (B). The p-values (two-tailed-Student's-t-test) of the comparisons between ATRA-treated and corresponding vehicle-treated cells are shown above each column. E HGC-27 cells were infected with lentiviral-particles containing two DHRS3-targeting pGreenPuro-constructs (sh-DHRS3a/sh-DHRS3b), the pGreenPuro-vector (pGR) and a control shRNA (sh-CTRL2). Following infection/puromycin-selection, we isolated 4 populations of green-fluorescent HGC-27 cells characterized by stable pGR/sh-CTRL/sh-DHRS3a/sh-DHRS3b-integration. The cell-populations were treated with vehicle or ATRA (1.0µM) for 48 hours and subjected to Western-blot analysis using anti-IRF1/anti-DHRS3/anti-βactin antibodies as in (A). F pGR/sh-CTRL/sh-DHRS3a/sh-DHRS3b-infected cell-populations were treated with vehicle or ATRA as in (D). Cell-growth (MTS-assay): Mean+SD of 3 cultures; values normalized as in (D). The p-values (two-tailed-Student’s-t-test) of the ATRA-treated/vehicle-treated cells comparison are shown above each column

Similar articles

Cited by

References

    1. Hartgrink HH, Jansen EP, van Grieken NC, van de Velde CJ. Gastric cancer. Lancet. 2009;374(9688):477–490. doi: 10.1016/S0140-6736(09)60617-6. - DOI - PMC - PubMed
    1. Kamangar F, Dores GM, Anderson WF. Patterns of Cancer Incidence, Mortality, and Prevalence Across Five Continents: defining priorities to reduce Cancer disparities in different Geographic regions of the World. JCO. 2006;24(14):2137–50. doi: 10.1200/JCO.2005.05.2308. - DOI - PubMed
    1. Laurén P. The two histological main types of gastric carcinoma: diffuse and so-called intestinal-type carcinoma: an attempt at a histo-clinical classification. Acta Pathol Microbiol Scand. 1965;64(1):31–49. doi: 10.1111/apm.1965.64.1.31. - DOI - PubMed
    1. Lim HJ, Zhuang L, Fitzgerald RC. Current advances in understanding the molecular profile of hereditary diffuse gastric cancer and its clinical implications. J Exp Clin Cancer Res. 2023;42(1):57. doi: 10.1186/s13046-023-02622-3. - DOI - PMC - PubMed
    1. Hu B, El Hajj N, Sittler S, Lammert N, Barnes R, Meloni-Ehrig A. Gastric cancer: classification, histology and application of molecular pathology. J Gastrointest Oncol. 2012;3(3):251–261. - PMC - PubMed