. 2023 Nov 28;42(11):113436.
doi: 10.1016/j.celrep.2023.113436. Epub 2023 Nov 11.

Skeletal muscle TFEB signaling promotes central nervous system function and reduces neuroinflammation during aging and neurodegenerative disease

Affiliations

Skeletal muscle TFEB signaling promotes central nervous system function and reduces neuroinflammation during aging and neurodegenerative disease

Ian Matthews et al. Cell Rep. .

Abstract

Skeletal muscle has recently arisen as a regulator of central nervous system (CNS) function and aging, secreting bioactive molecules known as myokines with metabolism-modifying functions in targeted tissues, including the CNS. Here, we report the generation of a transgenic mouse with enhanced skeletal muscle lysosomal and mitochondrial function via targeted overexpression of transcription factor E-B (TFEB). We discovered that the resulting geroprotective effects in skeletal muscle reduce neuroinflammation and the accumulation of tau-associated pathological hallmarks in a mouse model of tauopathy. Muscle-specific TFEB overexpression significantly ameliorates proteotoxicity, reduces neuroinflammation, and promotes transcriptional remodeling of the aged CNS, preserving cognition and memory in aged mice. Our results implicate the maintenance of skeletal muscle function throughout aging in direct regulation of CNS health and disease and suggest that skeletal muscle originating factors may act as therapeutic targets against age-associated neurodegenerative disorders.

Keywords: CP: Neuroscience; TFEB; aging; brain; exercise; muscle; neurodegeneration; tau.


Conflict of interest statement

Declaration of interests The authors declare no competing interests.

Figures
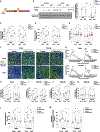
Figure 1.
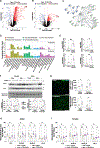
Figure 1.. Skeletal muscle overexpression of TFEB preserves muscle size, fiber type composition, and increases exercise endurance during aging
(A) Schematic depicting 3x-FLAG human TFEB transgene. Cassettes are arranged from 5ʹ (left) to 3ʹ (right). The 3x-FLAG-EGFP-STOP cassette (flanked by loxP sites) prevents expression of the 3x-FLAG human TFEB transgene unless in the presence of Cre recombinase. (B) Immunoblot of control and cTFEB;HSACre quadriceps confirming 3x-FLAG-TFEB protein expression in young (5–6 months) and aged (22–24 months) mice of both sexes. C, control; T, cTFEB;HSACre individuals. Transgenic 3x-FLAG-TFEB protein weighs ~75 kDa. Total protein stain-free lanes are shown below as a loading control. Densitometry quantification relative to average of young male control individuals. (C‒E) Skeletal muscle (quadriceps, C, and gastrocnemius, D) wet weight and body weight (E) in young (6 months) and aged (22–24 months) control and cTFEB;HSACre mice of both sexes. (F) Gastrocnemius cross-sections in young (7–9 months) and aged (22–24 months) control and cTFEB;HSACre transgenic mice of both sexes. MyHC1 (fiber type 1) in red, MyHC2A (fiber type 2A) in green, MyHC2B (fiber type 2B) in blue, MyHC2X (fiber type 2x) unstained, and laminin in white. Scale bars, 500 μm. (G‒K) Fiber cross-sectional area distribution curves (G) and quantifications of each fiber type percentage (H–K) from (F). *Statistical difference between control and cTFEB;HSACre. #Statistical difference between young and aged controls. Each data point represents the average of three separate images collected from three sections/individual. (L and M) High-intensity exhaustive treadmill exercise of young (6 months) and aged (18 months) control and cTFEB;HSACre transgenic mice of both sexes showing maximum distance run until exhaustion (L) and total work (body weight/distance run) (M). Controls are age-matched littermates. Unless otherwise stated, data are presented as mean ± SEM. */#p < 0.05, **/##p < 0.01, ****/####p < 0.0001 ANOVA and post-hoc multiple comparisons for each sex. Lack of annotation indicates comparisons were not significant.
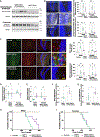
Figure 2.
Figure 2.. Muscle TFEB overexpression increases lysosomal network size and preserves mitochondrial function during aging
(A and B) Volcano plot of differentially expressed proteins in young (A) (6 months old) and aged (B) (18 months old) cTFEB;HSACre quadriceps relative to controls. Upregulated proteins in red, downregulated proteins in blue. (C) STRING-predicted protein-protein interactions of overexpressed proteins from (A) showing interacting networks converging on TFEB (blue) and mTOR (green). (D) KEGG enrichment analysis clusters overexpressed proteins from (A and B) into categories associated with proteostasis and autophagy (orange), mitochondrial metabolism (gold), fatty acid metabolism (green), age-associated signaling (blue), and amino acid metabolism (purple). (E) qRT-PCR for Lamp1, Atg5, Ctsd, and CtsB expression in quadriceps mRNA lysates from young (6 months old) male cTFEB;HSACre mice and controls. (F) Immunoblot analysis for LAMP1 and cathepsin D from young (5–6 months) and aged (22–24 months) control and cTFEB;HSACre quadriceps lysates from mice of both sexes. Total protein stain-free lanes are shown as a loading control. Marker densitometry quantification relative to protein stain-free densitometry shown below. (G) Gastrocnemius cross-sections from young (6–7 months old) control and cTFEB;HSACre female mice stained for LAMP1 (green), Hoechst (blue). Quantification of LAMP1+ puncta and LAMP1+ area/muscle section for both sexes (right). Scale bars, 100 μm. (H and I) Mitochondrial function measured by oxygen flux normalized to citrate synthase activity in soleus muscle from young (6 months old) and aged (18 months old) male (H) and female (I) control and cTFEB;HSACre semi-permeabilized soleus muscle. CI_P is complex I and CI + CII_P is complex I and II linked respiration coupled to ATP production. CI + CII_E is uncoupled complex I and II respiration or maximum respiration. CII_E is complex II respiration in the uncoupled state. Each point represents the average of all data collected from an individual. Controls are age-matched littermates. All data were analyzed by two-way between-subject (age × genotype) ANOVA with post hoc multiple comparisons, or one-way ANOVA and multiple comparisons post hoc for each sex. Data are presented as mean ± SEM. *p < 0.05, **p < 0.01. Lack of annotation indicates that comparisons were not significant.
Figure 3.
Figure 3.. Increased levels of known CNS-targeting myokines in TFEB-expressing skeletal muscle
(A) Vertebrate Secretome Database (VerSeDa)-predicted secreted proteins identified as upregulated or downregulated in young (green) and aged (blue) cTFEB;HSACre muscle, from Figures 2A and 2B. (B) Immunoblot for cathepsin B in quadriceps protein lysates from young (5–6 months) and aged (22–24 months) cTFEB;HSACre and controls of both sexes. Total protein stain-free lanes are shown as a loading control, quantification relative to protein stain-free densitometry (below). (C) Levels of cathepsin B in serum from young (5–6 months) and aged (22–24 months) control and cTFEB;HSACre mice of both sexes. Each point represents the average of technical replicates from an individual. Controls are age-matched littermates. All data were analyzed by two-way between-subject (age × genotype) ANOVA with post hoc multiple comparisons, data are presented as mean ± SEM. *p < 0.05, **p < 0.01. Lack of annotation indicates that comparisons were not significant.
Figure 4.
Figure 4.. Skeletal muscle TFEB overexpression reduces accumulation of hyperphosphorylated tau and microglial activation in a mouse model of tau pathology
(A) Immunoblot of 3x-FLAG TFEB protein in quadriceps muscle lysates from 9-month-old MAPT P301S;cTFEB;HSACre and MAPT P301S mice (top). Immunoblot for total tau protein (T6 antibody) in hippocampal lysates from same individuals (bottom). GAPDH is shown below as a loading control. (B) Representative merged images of the hippocampus dentate gyrus stained for phosphorylated tau (AT8, white) and nuclei/Hoechst (blue) in 9-month-old control (top, in gold), MAPT P301S (middle, in teal), and MAPT P301S;cTFEB;HSACre mice (bottom, in purple). Quantification of total phosphotau staining/section (right, top) and for intracellular phosphotau staining (right, bottom). Scale bars, 100 μm. (C) Representative merged images of the dentate gyrus stained for astrocytes (GFAP, green), microglia (IBA1, red) and nuclei (Hoechst, blue) in same groups as above. Quantification of IBA1+ microglia volume (top, right) and GFAP+ astrocyte staining amounts per section (bottom, right). Insets are 5× zooms of areas demarcated by yellow squares. Representative images are from male mice. Each point represents the average of all sections containing the dentate gyrus (two to three sections) for an individual animal. Scale bars, 100 μm. (D and E) NanoString nCounter AD panel of differentially expressed gene clusters associated with microglial activation (D) or with trophic factors (E) in P301S MAPT hippocampi (teal) compared with MAPT P301S;cTFEB;HSACre (purple) age-matched littermates of both sexes relative to controls. Analysis done via nSolver (NanoString) differential gene expression analysis software. Each point represents cluster scoring for a single individual hippocampal mRNA lysate. (F and G) qRT-PCR for Bdnf (F) and Fndc5 (G) expression in hippocampal RNA lysates from 9-month-old male MAPT P301S (teal) and MAPT P301S;cTFEB;HSACre mice (purple) relative to controls. (H and I) Survival curves for male (H) and female (I) control (gold), MAPT P301S (teal), and MAPT P301S;cTFEB;HSACre mice (purple). Controls are littermates. Unless otherwise noted, data are represented as mean ± SEM. *p < 0.05, **p < 0.01, ***p < 0.001, one-way ANOVA, post hoc multiple comparisons (B and C), t test (D and G), and log rank (Mantel-Cox) test (H and I). Lack of annotation indicates comparisons were not significant.
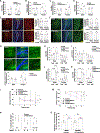
Figure 5.
Figure 5.. Skeletal muscle TFEB overexpression decreases neuroinflammation and lipofuscin accumulation and improves cognitive performance in aged mice
(A‒D) qRT-PCR for Ccl2 (A), Nfkb (B), Il6 (C), and Bdnf (D) expression in hippocampal mRNA lysates from 18-month-old cTFEB;HSACre mice and controls. (E and F) Representative images of the dentate gyrus of the hippocampus stained for Hoechst (blue), IBA1 (E) (red, representative images are from females), and GFAP (F) (green, representative images are from males) in 18- to 22-month-old control (top) and cTFEB;HSACre (bottom) mice. Scale bars, 100 μm. (G) Representative merged images of the same animals as above stained for Hoechst (blue), and lipofuscin puncta (autofluorescence, green, representative images are from females). Insets depicting glia morphology are 5× zooms of areas demarcated by yellow squares. Each point represents the average of all sections containing the dentate gyrus from an individual. Scale bars, 100 μm. (H‒K) qRT-PCR for Atg8 (H), Lamp1 (I), Sqstm1 (J), and Ctsd (K) expression in hippocampal lysates from young (6 months old, closed diamonds) and aged (21 months old, open diamonds) cTFEB;HSACre mice (purple) and controls (gold). (L‒O) Neurocognitive phenotyping of aged (18 months old) cTFEB;HSACre and control animals. Barnes maze (L and M), novel object recognition (N and O). Controls are age-matched littermates. Each point represents the average of all data collected from an individual. Data are represented as mean ± SEM. *p < 0.05, **p < 0.01, one-way ANOVA or two-way RMANOVA, post hoc tests. Lack of annotation indicates comparisons were not significant.
Figure 6.
Figure 6.. Transcriptome changes in the hippocampi of female cTFEB;HSACre transgenic mice suggest synaptic remodeling and improved synaptic function
(A and B) Volcano plot of differentially expressed genes in hippocampal lysates from female young (A) (6 months old) and aged (B) (24 months old) cTFEB;HSACre mice relative to controls. (C and D) GO term analysis of differentially expressed genes from (A and B) including gene counts and adjusted p values. Boxes highlight neurotrophic signaling pathways. (E and F) KEGG analysis of differentially expressed genes from (A and B). Number of differentially expressed (DE) genes are shown above each category. Boxes highlight categories associated with neural function.
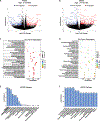
Figure 7.
Figure 7.. Transcriptome changes in the hippocampi of male cTFEB;HSACre transgenic mice suggest activation of mitochondrial and ribosomal signaling
(A and B) Volcano plot of differentially expressed genes in hippocampal lysates from male young (A) (6 months old, 2-fold change) and aged (B) (24 months old, 1.25-fold change) cTFEB;HSACre mice relative to controls. (C and D) GO term analysis of differentially expressed genes from (A and B) including gene counts and adjusted p values. Boxes highlight ribosomal and mitochondrial pathways. (E and F) KEGG analysis of differentially expressed genes from (A and B). Number of differentially expressed (DE) genes are shown above each category. Boxes highlight ribosomal and mitochondrial pathways.

References

    1. López-Otín C, Blasco MA, Partridge L, Serrano M, and Kroemer G (2023). Hallmarks of aging: An expanding universe. Cell 186, 243–278. 10.1016/j.cell.2022.11.001. - DOI - PubMed
    1. Mattson MP, and Arumugam TV (2018). Hallmarks of Brain Aging: Adaptive and Pathological Modification by Metabolic States. Cell Metab. 27, 1176–1199. 10.1016/j.cmet.2018.05.011. - DOI - PMC - PubMed
    1. Ham S, and Lee SJV (2020). Advances in transcriptome analysis of human brain aging. Exp. Mol. Med. 52, 1787–1797. 10.1038/s12276-020-00522-6. - DOI - PMC - PubMed
    1. Demontis F, Patel VK, Swindell WR, and Perrimon N (2014). Intertissue control of the nucleolus via a myokine-dependent longevity pathway. Cell Rep. 7, 1481–1494. 10.1016/j.celrep.2014.05.001. - DOI - PMC - PubMed
    1. Rai M, Coleman Z, Curley M, Nityanandam A, Platt A, Robles-Murguia M, Jiao J, Finkelstein D, Wang YD, Xu B, et al. (2021). Proteasome stress in skeletal muscle mounts a long-range protective response that delays retinal and brain aging. Cell Metab. 33, 1137–1154.e9. 10.1016/j.cmet.2021.03.005. - DOI - PMC - PubMed

Publication types

Substances