. 2023 Nov 13;6(1):1151.
doi: 10.1038/s42003-023-05483-w.

A Cre-dependent massively parallel reporter assay allows for cell-type specific assessment of the functional effects of non-coding elements in vivo

Affiliations

A Cre-dependent massively parallel reporter assay allows for cell-type specific assessment of the functional effects of non-coding elements in vivo

Tomas Lagunas Jr et al. Commun Biol. .

Abstract

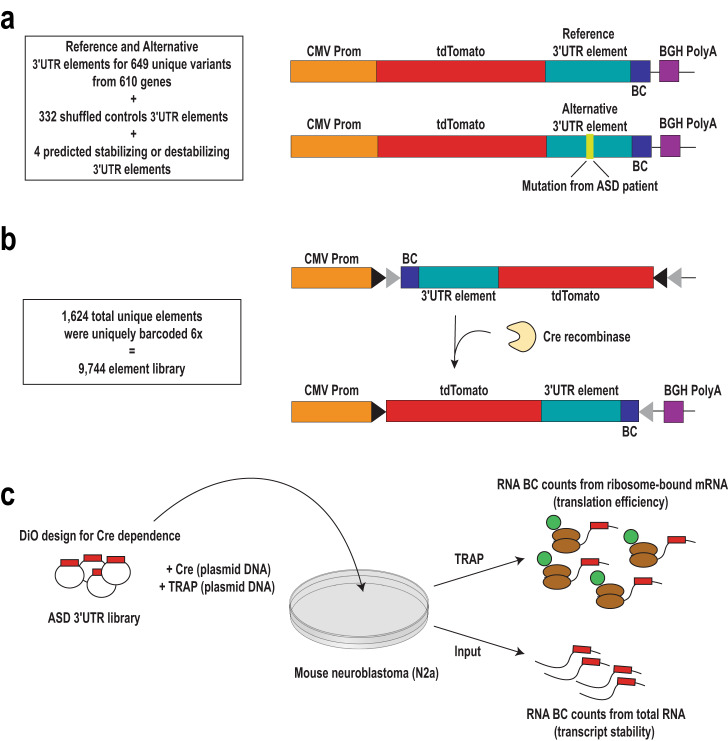
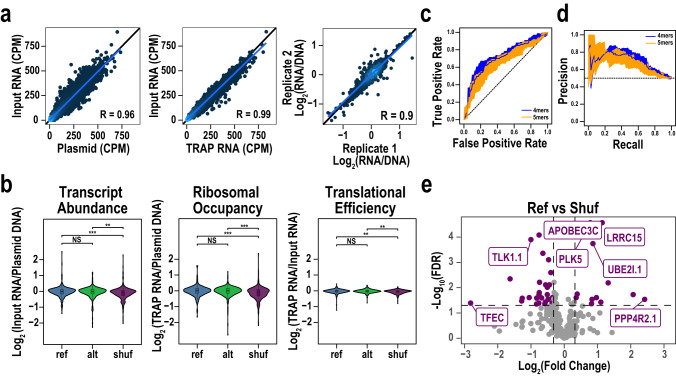
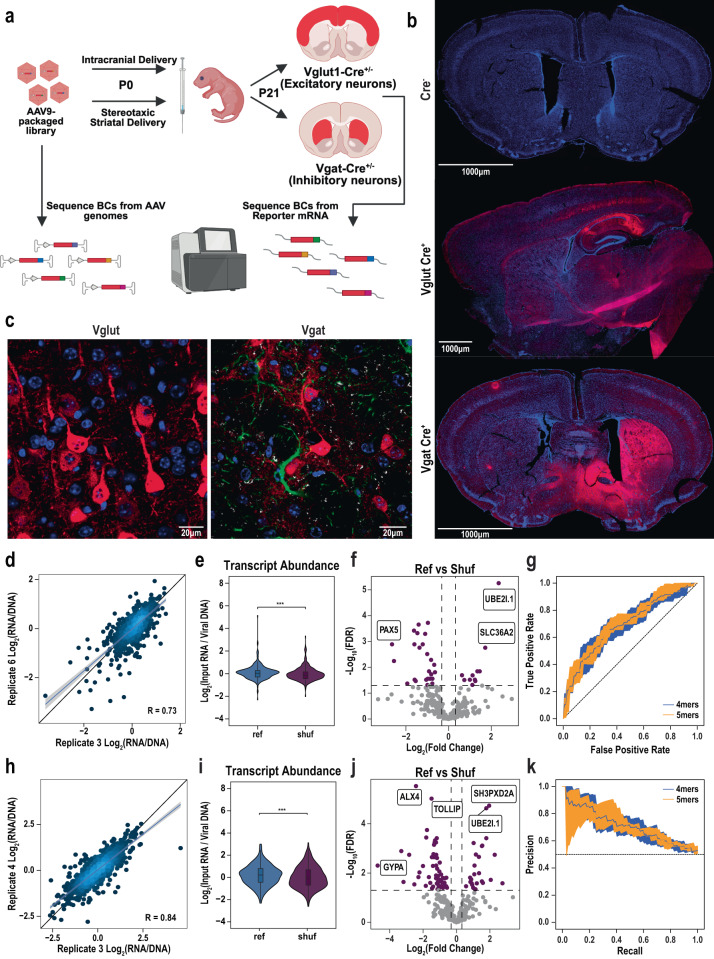
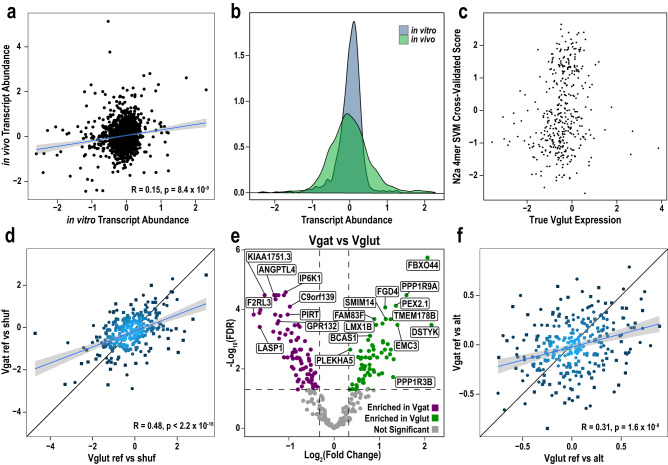
The function of regulatory elements is highly dependent on the cellular context, and thus for understanding the function of elements associated with psychiatric diseases these would ideally be studied in neurons in a living brain. Massively Parallel Reporter Assays (MPRAs) are molecular genetic tools that enable functional screening of hundreds of predefined sequences in a single experiment. These assays have not yet been adapted to query specific cell types in vivo in a complex tissue like the mouse brain. Here, using a test-case 3'UTR MPRA library with genomic elements containing variants from autism patients, we developed a method to achieve reproducible measurements of element effects in vivo in a cell type-specific manner, using excitatory cortical neurons and striatal medium spiny neurons as test cases. This targeted technique should enable robust, functional annotation of genetic elements in the cellular contexts most relevant to psychiatric disease.


Conflict of interest statement

The authors declare no competing interests.

Figures

Fig. 1
Fig. 1. 3′UTR library design and delivery.
a MPRA library constructs were designed with a CMV promoter (prom) driving the TdTomato reporter, followed by the 3′UTR oligo reference or alternative sequence (with or without variant, respectively) that is uniquely barcoded (BC). b All elements were uniquely barcoded 6 times. Cloning of this library was completed in the Double-floxed inverse Orientation (DiO) design for Cre-dependent expression. c MPRA library, Cre recombinase and TRAP components were delivered via plasmid transfection into N2a cells. Following incubation, total RNA and TRAP RNA were isolated to prepare sequencing libraries to then count BCs to calculate expression per element.
Fig. 2
Fig. 2. Screen in mouse neuroblastoma cell line identifies variants that alter steady state transcript abundance.
a Scatter plots showing correlation between replicates of Input RNA vs plasmid DNA, Input RNA vs TRAP RNA, and Expression in Biological Replicate 1 vs. Replicate 2 (Log2 Input RNA/DNA). b Pairwise comparison of expression value distribution among Ref, Alt, and Shuf sequences in Transcript Abundance, Ribosomal Occupancy, and Translation Efficiency data sets. **p < 0.01, ***p < 0.001 for Wilcoxon signed-rank test. Boxes on boxplots represent first quartile, median, and third quartile, whiskers represent minimum and maximum (Q1 – 1.5 * interquartile range and Q3 + 1.5 * interquartile range, respectively). c Receiver/operator and (d) precision recall curves for k-mer SVMs to classify high and low expressing elements. Shaded area represents 1 standard deviation based on five-fold cross-validation. e Volcano plot for Ref vs Shuf elements (purple) in library showing significance (y-axis) vs log2 FC (x-axis). Horizontal dashed line corresponds to FDR 0.05 and vertical dashed lines correspond to log2 FC equivalent to 25% change in expression. Figure based on n = 6 replicates. Full results list can be found in Supplementary Data 3, worksheet 1, and QC in Supplementary Data 2.
Fig. 3
Fig. 3. Screen in excitatory neurons in the mouse brain identifies elements that alter steady state transcript abundance.
a MPRA library was packaged into AAV9 and delivered into perinatal mouse cortices via intracranial injection or bilaterally into striatum via stereotaxic injection and later harvested at P21 for RNA extraction. Libraries were prepared from AAV genomes and reporter mRNA, and barcodes (BC) were counted. Panel was created with Biorender.com. b Immunofluorescence of P21 brain showing localization of tdTomato expression (from MPRA library) in Cre lines and wildtype control (Cre-). Nuclei counterstained with DAPI(blue). Scale bars represent a distance of 1000 µm. c Immunofluorescence demonstrating expression of MPRA library in morphological pyramidal neurons (Vglut) and medium spiny neurons (Vgat). There is no overlap with markers of astrocytes (GFAP) or oligodendrocytes (CNPase). Scale bars represent a distance of 20 µm. d Scatter plot showing correlation between replicates for mean-normalized expression in excitatory pyramidal neurons (Log2 RNA/DNA, barcode averaged). Shaded region indicates 95% confidence interval around linear regression line. e Pairwise comparison of Ref, and Shuf sequence expression in excitatory neurons. ***p < 0.001 for Wilcoxon signed-rank test. Boxes on boxplots represent first quartile, median, and third quartile, whiskers represent minimum and maximum (Q1 – 1.5 * interquartile range and Q3 + 1.5 * interquartile range, respectively). f Volcano plot for Ref vs Shuf element expression in excitatory neurons in library showing significance (y-axis) vs log2 FC (x-axis). Horizontal dashed line corresponds to FDR 0.05 and vertical dashed lines correspond to log2 FC equivalent to 25% change in expression. Full results list can be found in Supplementary Data 4 and 5, worksheet 3. g Receiver/operator (upper panel) and precision/recall (lower panel) curves for k-mer SVMs to classify high and low expressing elements in excitatory neurons. Shaded area represents 1 standard deviation based on five-fold cross-validation. h Scatter plot showing correlation between replicates for mean-normalized expression in inhibitory neurons (Log2 RNA/DNA, barcode averaged). Shaded region indicates 95% confidence interval around linear regression line. i Pairwise comparison of Ref, and Shuf sequence expression in medium spiney neurons, ***p < 0.001 for Wilcoxon signed-rank test. Boxes on boxplots represent first quartile, median, and third quartile, whiskers represent minimum and maximum (Q1 – 1.5 * interquartile range and Q3 + 1.5 * interquartile range, respectively). j Volcano plot for Ref vs Shuf element expression in medium spiney neurons. Full results list can be found in Supplementary Data 4 and 5, worksheet 4. n = 6 Vgat, 11 Vglut animals. k Precision/recall curves for k-mer SVMs to classify high and low expressing elements in excitatory neurons.
Fig. 4
Fig. 4. Cell type specific influences on regulatory element expression.
a Scatter plot of in vitro N2a vs. in vivo pyramidal neuron (Vglut) expression values show poor correlation indicate importance of cell type. b Comparison of in vitro and in vivo expression distributions, Brown-Forsythe Levene-type test for difference in variance p < 2.2e-16. c N2a SVM score vs true Vglut expression show lack of correlation - indicating in vitro data cannot predict in vivo values. d Scatterplot comparing pyramidal neurons and medium spiny neuron(Vgat) expression values. e Volcano plot identifies elements that have differential activity between pyramidal and medium spiny neurons. f Scatterplot shows weaker correlation and smaller effect sizes for allelic effects when compared to element effects (d). Case and control variants are labeled as circles and squares, respectively. For all statistical reporting, n = 6 for Vgat animals and n = 11 for Vglut animals. Shaded regions on (a, d, f) indicates 95% confidence interval around linear regression line.
Fig. 5
Fig. 5. Simulated tests sampling control data to model barcode effects.
Simulations drawing sets of barcodes for ‘allelic’ comparison using a barcode count of three through fifty for each allele (1,000,000 iterations, drawing from ~100 Barcodes tagging the same control element from a previous study of ours). Red data points indicate six barcodes. a Violin plots showing the range and frequency of log(2) fold-changes for randomly sampled data for the range of barcodes. Boxes on boxplots represent first quartile, median, and third quartile, whiskers represent minimum and maximum (Q1 – 1.5 * interquartile range and Q3 + 1.5 * interquartile range, respectively). b Plot detailing the probability of obtaining a log(2) fold change less than or greater than 0.25 for randomly samples data for the range of barcodes. c Plot detailing the Type I Error Rate of a linear mixed model for randomly sampled data for the range of barcode numbers.

References

    1. Trubetskoy, V. et al. Mapping genomic loci implicates genes and synaptic biology in schizophrenia. Nature604, 502–508 (2022) - PMC - PubMed
    1. Grove J, et al. Identification of common genetic risk variants for autism spectrum disorder. Nat. Genet. 2019;51:431–444. - PMC - PubMed
    1. Matoba N, et al. Common genetic risk variants identified in the SPARK cohort support DDHD2 as a candidate risk gene for autism. Transl. Psychiatry. 2020;10:1–14. - PMC - PubMed
    1. Mulvey B, Lagunas T, Dougherty JD. Massively Parallel Reporter Assays: Defining Functional Psychiatric Genetic Variants Across Biological Contexts. Biol. Psychiatry. 2020;89:76–89. - PMC - PubMed
    1. Hevner RF, Hodge RD, Daza RAM, Englund C. Transcription factors in glutamatergic neurogenesis: Conserved programs in neocortex, cerebellum, and adult hippocampus. Neurosci. Res. 2006;55:223–233. - PubMed

Publication types