. 2023 Oct 19;5(6):fcad279.
doi: 10.1093/braincomms/fcad279. eCollection 2023.

Assessment of white matter hyperintensity severity using multimodal magnetic resonance imaging

Collaborators, Affiliations

Assessment of white matter hyperintensity severity using multimodal magnetic resonance imaging

Olivier Parent et al. Brain Commun. .

Abstract

White matter hyperintensities are radiological abnormalities reflecting cerebrovascular dysfunction detectable using MRI. White matter hyperintensities are often present in individuals at the later stages of the lifespan and in prodromal stages in the Alzheimer's disease spectrum. Tissue alterations underlying white matter hyperintensities may include demyelination, inflammation and oedema, but these are highly variable by neuroanatomical location and between individuals. There is a crucial need to characterize these white matter hyperintensity tissue alterations in vivo to improve prognosis and, potentially, treatment outcomes. How different MRI measure(s) of tissue microstructure capture clinically-relevant white matter hyperintensity tissue damage is currently unknown. Here, we compared six MRI signal measures sampled within white matter hyperintensities and their associations with multiple clinically-relevant outcomes, consisting of global and cortical brain morphometry, cognitive function, diagnostic and demographic differences and cardiovascular risk factors. We used cross-sectional data from 118 participants: healthy controls (n = 30), individuals at high risk for Alzheimer's disease due to familial history (n = 47), mild cognitive impairment (n = 32) and clinical Alzheimer's disease dementia (n = 9). We sampled the median signal within white matter hyperintensities on weighted MRI images [T1-weighted (T1w), T2-weighted (T2w), T1w/T2w ratio, fluid-attenuated inversion recovery (FLAIR)] as well as the relaxation times from quantitative T1 (qT1) and T2* (qT2*) images. qT2* and fluid-attenuated inversion recovery signals within white matter hyperintensities displayed different age- and disease-related trends compared to normal-appearing white matter signals, suggesting sensitivity to white matter hyperintensity-specific tissue deterioration. Further, white matter hyperintensity qT2*, particularly in periventricular and occipital white matter regions, was consistently associated with all types of clinically-relevant outcomes in both univariate and multivariate analyses and across two parcellation schemes. qT1 and fluid-attenuated inversion recovery measures showed consistent clinical relationships in multivariate but not univariate analyses, while T1w, T2w and T1w/T2w ratio measures were not consistently associated with clinical variables. We observed that the qT2* signal was sensitive to clinically-relevant microstructural tissue alterations specific to white matter hyperintensities. Our results suggest that combining volumetric and signal measures of white matter hyperintensity should be considered to fully characterize the severity of white matter hyperintensities in vivo. These findings may have implications in determining the reversibility of white matter hyperintensities and the potential efficacy of cardio- and cerebrovascular treatments.

Keywords: cerebrovascular disease; dementia; microstructure; relaxometry; small vessel disease.


Conflict of interest statement

The authors report no competing interests.

Figures
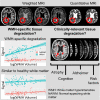
Graphical Abstract
Graphical Abstract
Figure 1
Figure 1
Workflow of MRI acquisitions, processing and analyses. (A) Six types of MR images were acquired and processed. Figures are from a 74-year-old female participant with Alzheimer’s disease and high WMH volume. (B) Top: white matter tissue was separated into WMH and NAWM. Bottom: both tissue types were parcellated with a periventricular (PV)/deep/superficial white matter (SWM) and lobar parcellation. Subject-wise median signal was sampled within each subregion and MRI image. (C) Atrophy measures included global [total brain volume (TBV), intracranial brain volume (ICV), TBV/ICV ratio] (top) and cortical thickness measures (bottom). The dimensionality of the vertex-wise cortical thickness data was reduced by deriving a data-driven parcellation using non-negative matrix factorization (decomposition process is shown). (D) Three types of analyses were performed: (i) correlations of WMH signal measures between themselves; (ii) comparing WMH and NAWM signal age- and disease-related trends; and (iii) assessing the relationships of WMH measures with clinically-relevant variables (atrophy, cognition, clinical group, cardiovascular risk factors) using univariate and multivariate analyses.
Figure 2
Figure 2
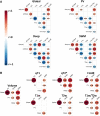
Correlations of WMH measures. (A) Within-region between-measure correlations of all WMH characteristics (volume and signal measures). (B) Between-region within-measure correlations. Circles are proportional to the amplitude of the Pearson’s correlation coefficients, which are also indicated. Warmer colours indicate positive correlations, and colder colours indicate negative correlations. Only significant correlations at P < 0.01 are displayed (n = 118).
Figure 3
Figure 3
Comparing signal trends between WMH and NAWM. (A) On the y-axis, all WMH signal measures (global and parcellated) are grouped by image type. P-values for the interaction term (modelled with linear regression) between either age (left) and WMH volume (right) with white matter type thresholded at P < 0.01 are colour coded, and non-significant associations are in grey. Yellow colours indicate lower P-values, and blue colours indicate higher P-values. Blue squares indicate relationships for the age term that are visualized, and black squares indicate relationships for the WMH volume term that are visualized. (B) Graphical visualization of NAWM (red) and WMH (blue) signal trends in global white matter with age (top) and WMH volume (bottom) for each signal type. Significantly different white matter trends at the P < 0.01 level are indicated with a black star (n = 118).
Figure 4
Figure 4
Univariate analyses relating WMH characteristics to clinical variables (PV/deep/SWM parcellation). (A) For each number of components of the NMF reconstruction, the stability (red) and the gradient of the reconstruction error (blue) are shown. The selected number of components is indicated by the black box. (B) Result of the winner-take-all NMF cortical thickness parcellation. Component 1 (purple) represents posterior temporo-parietal regions. Component 2 (blue) represents orbitofrontal, medial-frontal and anterior cingulate regions. Component 3 (turquoise) includes the medial temporal lobe and part of the temporal pole. Component 4 (dark green) represents posterior frontal regions. Component 5 (light green) represents the superior temporal gyrus and inferior parieto-frontal regions. Component 6 (yellow) represents the occipital lobes. Component 7 (red) represents the inferior and middle temporal gyri. Component 8 (orange) represents the sensorimotor cortex. (C) On the y-axis, all WMH measures (global and parcellated) are grouped by type of image. On the x-axis, all clinical variables are grouped by category. Associations between WMH signal measures and clinical variables were modelled with multiple linear regression for continuous measures and ANCOVAs for categorical measures. P-values of relationships between each WMH measure and each clinical variable (correcting for age, sex and education) are shown thresholded at P < 0.01, with non-significant associations in grey. Yellow colours indicate lower P-values, and purple colours indicate higher P-values. Relationships that survived FDR correction at the 0.1 level are indicated with a black star (n = 118).
Figure 5
Figure 5
Partial least squares correlation analysis relating brain variables to cognition and demographics (PV/deep/SWM parcellation). Demographic and cognitive variables are shown in purple, atrophy variables in red, WMH variables in blue and non-significant variables in grey. Top: For each demographic and cognitive variable, the loading on LV1 is proportional to the correlation coefficient on the x-axis. 95% confidence intervals are shown, and variables contribute significantly to the LV (green) if the confidence interval does not cross 0. Bottom: For each brain variable, the bootstrap ratio (BSR) is proportional to the width of the bar on the x-axis. The variables are ordered from top to bottom by BSR value magnitude. Vertical lines at BSR ± 3.29 (equivalent to P < 0.001) indicate the significance thresholds (n = 118).

References

    1. Kapasi A, DeCarli C, Schneider JA. Impact of multiple pathologies on the threshold for clinically overt dementia. Acta Neuropathol. 2017;134(2):171–186. - PMC - PubMed
    1. Bos D, Wolters FJ, Darweesh SKL, et al. Cerebral small vessel disease and the risk of dementia: A systematic review and meta-analysis of population-based evidence. Alzheimers Dement. 2018;14(11):1482–1492. - PubMed
    1. Iturria-Medina Y, Sotero RC, Toussaint PJ, et al. Early role of vascular dysregulation on late-onset Alzheimer’s disease based on multifactorial data-driven analysis. Nat Commun. 2016;7(1):11934. - PMC - PubMed
    1. Lee S, Viqar F, Zimmerman ME, et al. White matter hyperintensities are a core feature of Alzheimer’s disease: Evidence from the dominantly inherited Alzheimer network. Ann Neurol. 2016;79(6):929–939. - PMC - PubMed
    1. Debette S, Markus HS. The clinical importance of white matter hyperintensities on brain magnetic resonance imaging: Systematic review and meta-analysis. BMJ. 2010;341:c3666. - PMC - PubMed

LinkOut - more resources