. 2023 Oct 25;5(6):fcad292.
doi: 10.1093/braincomms/fcad292. eCollection 2023.

Interictal magnetoencephalography abnormalities to guide intracranial electrode implantation and predict surgical outcome

Affiliations

Interictal magnetoencephalography abnormalities to guide intracranial electrode implantation and predict surgical outcome

Thomas W Owen et al. Brain Commun. .

Abstract

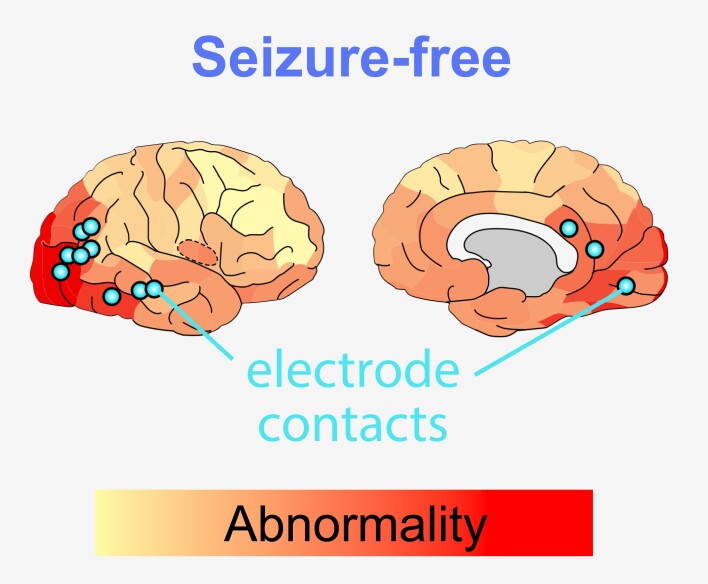
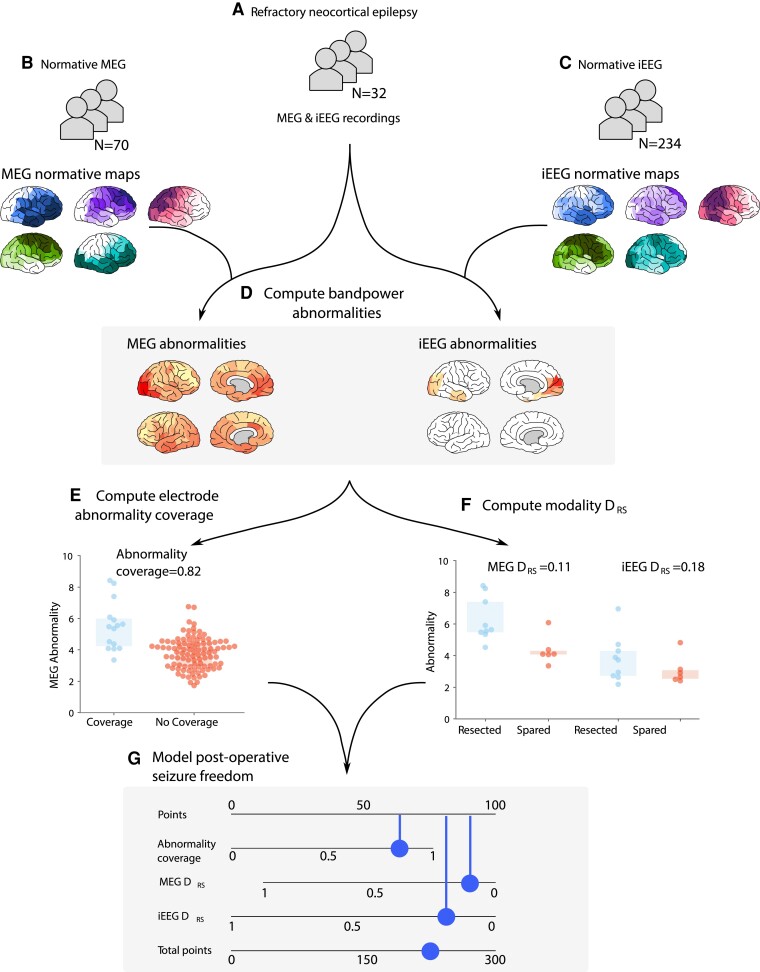
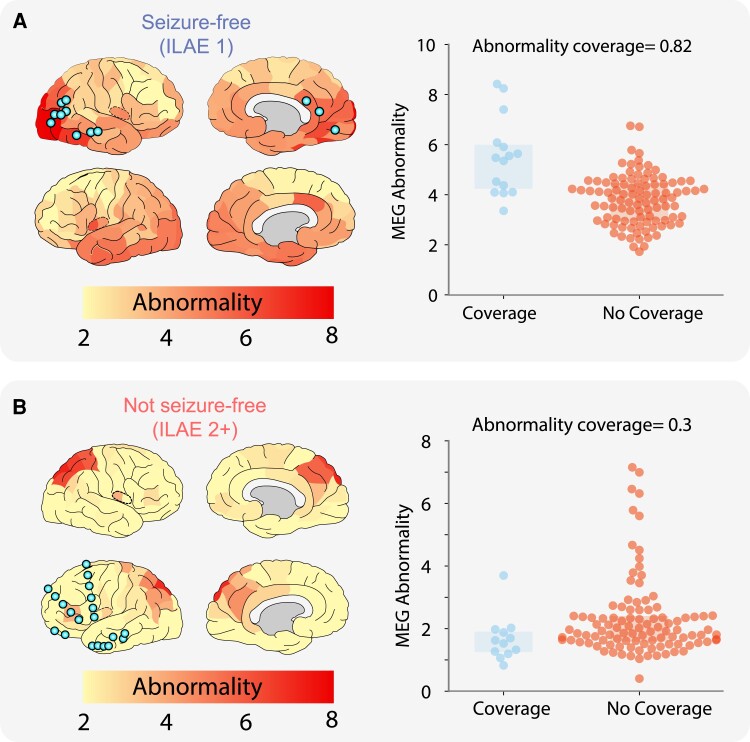
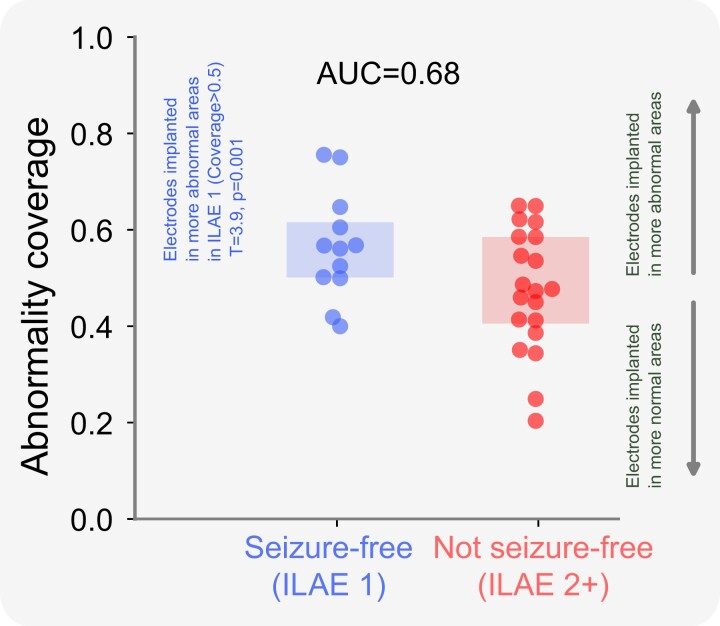
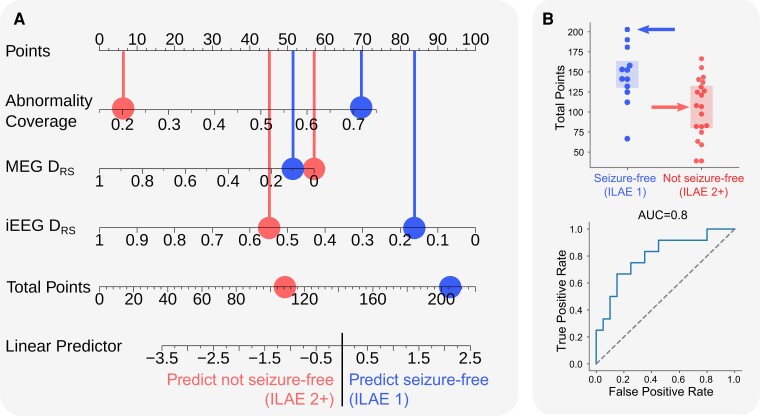
Intracranial EEG is the gold standard technique for epileptogenic zone localization but requires a preconceived hypothesis of the location of the epileptogenic tissue. This placement is guided by qualitative interpretations of seizure semiology, MRI, EEG and other imaging modalities, such as magnetoencephalography. Quantitative abnormality mapping using magnetoencephalography has recently been shown to have potential clinical value. We hypothesized that if quantifiable magnetoencephalography abnormalities were sampled by intracranial EEG, then patients' post-resection seizure outcome may be better. Thirty-two individuals with refractory neocortical epilepsy underwent magnetoencephalography and subsequent intracranial EEG recordings as part of presurgical evaluation. Eyes-closed resting-state interictal magnetoencephalography band power abnormality maps were derived from 70 healthy controls as a normative baseline. Magnetoencephalography abnormality maps were compared to intracranial EEG electrode implantation, with the spatial overlap of intracranial EEG electrode placement and cerebral magnetoencephalography abnormalities recorded. Finally, we assessed if the implantation of electrodes in abnormal tissue and subsequent resection of the strongest abnormalities determined by magnetoencephalography and intracranial EEG corresponded to surgical success. We used the area under the receiver operating characteristic curve as a measure of effect size. Intracranial electrodes were implanted in brain tissue with the most abnormal magnetoencephalography findings-in individuals that were seizure-free postoperatively (T = 3.9, P = 0.001) but not in those who did not become seizure-free. The overlap between magnetoencephalography abnormalities and electrode placement distinguished surgical outcome groups moderately well (area under the receiver operating characteristic curve = 0.68). In isolation, the resection of the strongest abnormalities as defined by magnetoencephalography and intracranial EEG separated surgical outcome groups well, area under the receiver operating characteristic curve = 0.71 and area under the receiver operating characteristic curve = 0.74, respectively. A model incorporating all three features separated surgical outcome groups best (area under the receiver operating characteristic curve = 0.80). Intracranial EEG is a key tool to delineate the epileptogenic zone and help render individuals seizure-free postoperatively. We showed that data-driven abnormality maps derived from resting-state magnetoencephalography recordings demonstrate clinical value and may help guide electrode placement in individuals with neocortical epilepsy. Additionally, our predictive model of postoperative seizure freedom, which leverages both magnetoencephalography and intracranial EEG recordings, could aid patient counselling of expected outcome.

Keywords: MEG; epilepsy; iEEG; normative; surgery.


Conflict of interest statement

The authors report no competing interests.

Figures

Graphical Abstract
Graphical Abstract
Figure 1
Figure 1
Processing pipeline to assess the clinical utility of MEG band power abnormalities to guide iEEG implantation. (A–C) MEG and iEEG recordings were collected for healthy and patient cohorts. Recordings for 70 healthy controls and 234 individuals with epilepsy were used as a normative baseline for MEG and iEEG, respectively. MEG and iEEG recordings were collected for an independent cohort of 32 individuals with refractory neocortical epilepsy. Regional relative band power was averaged across individuals and frequency bands to create normative maps. Patient maps of band power were derived using normative data as baselines by retaining the maximum absolute Z-score across frequencies within each region (D). The overlap between the strongest MEG abnormalities and electrode placement was quantified, defined as the abnormality coverage, with values closer to 1 corresponding to the implantation in the most abnormal tissue (E). The resection of the strongest abnormalities defined by MEG and iEEG was quantified using the distinguishability between resected and spared tissue (DRS) (F). DRS values closer to 0 correspond to the resection of the strongest abnormalities. The DRS was only computed using neocortical tissue with MEG and iEEG coverage. The abnormality coverage and DRS values per individual were used to classify postoperative seizure freedom using a logistic regression model. Model output is visualized using a nomogram (G), with each measure accruing points depending on the feature weight. The more points a subject accrues, the more likely they are to be classified as seizure-free.
Figure 2
Figure 2
Overlapping MEG band power abnormalities and intracranial EEG electrode implantation. Neocortical interictal resting-state MEG band power abnormalities and iEEG electrode implantation in an example seizure-free patient (A). High overlap is present between MEG-derived abnormalities and iEEG electrode placement, quantified with an abnormality coverage of 0.82. In this scenario, we would expect postoperative seizure freedom as iEEG electrodes have targeted abnormal tissue presumed to contain the epileptogenic zone. (B) Conversely, this example subject with poor surgical outcome (ILAE 2+) has minimal overlap between MEG abnormalities and electrode placement (abnormality coverage = 0.3). As such, we would expect poor surgical outcome as the presumed epileptogenic tissue was not targeted by intracranial electrodes for further monitoring. Spatial heatmaps correspond to MEG-derived band power abnormalities, with blue points corresponding to the approximate localization of iEEG electrodes. Boxplots (right panels) illustrate the abnormality of regions with and without iEEG coverage (blue and orange, respectively). Each data point corresponds to a single neocortical region of interest. The abnormality coverage (0.82 for patient A) reflects if the most abnormal regions had iEEG coverage. Values closer to 1 correspond to implantation exclusively in the most abnormal tissue and values of 0 to an implantation exclusively in the least abnormal tissue.
Figure 3
Figure 3
Surgical outcome separability of the abnormality coverage at a group level. The boxplot shows the abnormality coverage measure for seizure-free (ILAE 1) and non–seizure-free subjects (ILAE 2+). Each data point corresponds to an individual subject. Seizure-free subjects are significantly >0.5 indicating coverage in regions with high MEG abnormality (T =3.9, P = 0.001). This effect was not present for ILAE 2+ patients. Differences between each group of individuals relative to 0.5 were estimated using a one-tailed one sample t-test. One-tailed tests were used as clear preconceived hypotheses were provided. AUC = area under the receiver operating characteristic curve.
Figure 4
Figure 4
Modelling post-surgical seizure freedom using multimodal measures. (A) Nomogram illustrating the output of a logistic regression model trained using the abnormality coverage, MEG DRS and iEEG DRS. Here, DRS represents the distinguishability between resected and spared tissue in the respective modality. Each feature accrues points towards a final score. The points for an individual subject based on their measures are totalled and subsequently compared across surgical outcome groups. Each blue point corresponds to the results for a single seizure-free patient, whereas red points correspond to the results for a single non–seizure-free subject. We hypothesized that the more points a subject accrued, the more likely they would be seizure-free postoperatively as the abnormality coverage indicates that potentially epileptogenic tissue had been targeted for iEEG monitoring and that MEG and iEEG are in agreement that most abnormal tissue was resected. (B) For each individual, the total points calculated using the nomogram were compared across surgical outcome groups. The model results are presented as a boxplot and ROC curve. Each point corresponds to a single individual (ILAE 1, blue; ILAE 2+, red). The significance of our result was quantified using an AUC score derived from a one-tailed Mann–Whitney U test (AUC = 0.8, P = 0.003). A one-tailed test was performed as a clear hypothesis of direction was provided.

Update of

References

    1. Kim DW, Kim HK, Lee SK, Chu K, Chung CK. Extent of neocortical resection and surgical outcome of epilepsy: Intracranial EEG analysis. Epilepsia 2010;51(6):1010–1017. - PubMed
    1. Megevand P, Spinelli L, Genetti M, et al. Electric source imaging of interictal activity accurately localises the seizure onset zone. J Neurol Neurosurg Psychiatry. 2014;85(1):38–43. - PubMed
    1. Kim DW, Lee SK, Moon HJ, Jung KY, Chu K, Chung CK. Surgical treatment of nonlesional neocortical epilepsy: Long-term longitudinal study. JAMA Neurol. 2017;74(3):324–331. - PubMed
    1. Azeem A, von Ellenrieder N, Hall J, Dubeau F, Frauscher B, Gotman J. Interictal spike networks predict surgical outcome in patients with drug-resistant focal epilepsy. Ann Clin Transl Neurol. 2021;8(6):1212–1223. - PMC - PubMed
    1. Foley E, Quitadamo LR, Walsh AR, Bill P, Hillebrand A, Seri S. MEG detection of high frequency oscillations and intracranial-EEG validation in pediatric epilepsy surgery. Clin Neurophysiol. 2021;132(9):2136–2145. - PubMed

LinkOut - more resources