. 2023 Oct 26:13:1286861.
doi: 10.3389/fonc.2023.1286861. eCollection 2023.

Loss of Cadherin-11 in pancreatic ductal adenocarcinoma alters tumor-immune microenvironment

Affiliations

Loss of Cadherin-11 in pancreatic ductal adenocarcinoma alters tumor-immune microenvironment

Aimy Sebastian et al. Front Oncol. .

Abstract

Pancreatic ductal adenocarcinoma (PDAC) is one of the top five deadliest forms of cancer with very few treatment options. The 5-year survival rate for PDAC is 10% following diagnosis. Cadherin 11 (Cdh11), a cell-to-cell adhesion molecule, has been suggested to promote tumor growth and immunosuppression in PDAC, and Cdh11 inhibition significantly extended survival in mice with PDAC. However, the mechanisms by which Cdh11 deficiency influences PDAC progression and anti-tumor immune responses have yet to be fully elucidated. To investigate Cdh11-deficiency induced changes in PDAC tumor microenvironment (TME), we crossed p48-Cre; LSL-KrasG12D/+; LSL-Trp53R172H/+ (KPC) mice with Cdh11+/- mice and performed single-cell RNA sequencing (scRNA-seq) of the non-immune (CD45-) and immune (CD45+) compartment of KPC tumor-bearing Cdh11 proficient (KPC-Cdh11+/+) and Cdh11 deficient (KPC-Cdh11+/-) mice. Our analysis showed that Cdh11 is expressed primarily in cancer-associated fibroblasts (CAFs) and at low levels in epithelial cells undergoing epithelial-to-mesenchymal transition (EMT). Cdh11 deficiency altered the molecular profile of CAFs, leading to a decrease in the expression of myofibroblast markers such as Acta2 and Tagln and cytokines such as Il6, Il33 and Midkine (Mdk). We also observed a significant decrease in the presence of monocytes/macrophages and neutrophils in KPC-Cdh11+/- tumors while the proportion of T cells was increased. Additionally, myeloid lineage cells from Cdh11-deficient tumors had reduced expression of immunosuppressive cytokines that have previously been shown to play a role in immune suppression. In summary, our data suggests that Cdh11 deficiency significantly alters the fibroblast and immune microenvironments and contributes to the reduction of immunosuppressive cytokines, leading to an increase in anti-tumor immunity and enhanced survival.

Keywords: CAF; CDH11; IL33; MDSC; PDAC; T cells.


Conflict of interest statement

The authors declare that the research was conducted in the absence of any commercial or financial relationships that could be construed as a potential conflict of interest.

Figures

Figure 1
Figure 1
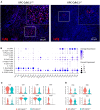
Single-cell level analysis of Cdh11 deficiency-induced changes in stromal cells. (A) Experimental design. CD45+ (immune) and CD45- (non-immune) cells from pancreases of KPC-Cdh11+/+ and KPC-Cdh11+/- mice were isolated and both fractions were analyzed separately using scRNA-seq. (B) Non-immune cell clusters from both KPC-Cdh11+/+ and KPC-Cdh11+/- mice visualized by Uniform Manifold Approximation and Projection (UMAP). Each color represents a cell type/subtype with distinct transcriptomic profiles. (C) Dot plot showing the expression of cell type markers corresponding to the cell clusters shown in panel (A). Dot size represents the fraction of cells expressing a gene in a cluster and intensity of color indicates the average expression level in that cluster. (D) UMAP plot colored by experimental condition. (E) Graph showing the proportion of various cell types in each experimental group, calculated using scRNA-seq data. (F) Feature plot showing the enrichment of Pdgfra, Cdh11 and myofibroblast marker Acta2 in CAF clusters. (G) IHC showing co-expression of Cdh11 and Pdgfra in KPC-Cdh11+/+ mice. The dotted boxed area is shown on the bottom with higher magnification.
Figure 2
Figure 2
Comparative analysis of KPC-Cdh11+/+ and KPC-Cdh11+/- derived CAFs. (A) UMAP plot showing various CAF subtypes identified in KPC-Cdh11+/+ and KPC-Cdh11+/- mice. (B) Violin plot showing the expression of selected CAF subtype markers in scRNA-seq data from both KPC-Cdh11+/+ and KPC-Cdh11+/- tumors. (C) Feature plot showing the expression of myofibroblast marker Acta2 in each experimental group. (D) Dot plot showing a subset of CAF genes differentially expressed between KPC-Cdh11+/- and KPC-Cdh11+/+ mice. (E) Cytokine array analysis showing fold increase in the expression of various cytokines in serum and tumor samples from KPC-Cdh11+/+ mice compared to KPC-Cdh11+/- mice. (F) CDH11 protein expression in human pancreatic cancer (CPTAC data from UALCAN). Z-values (Y-axis) represent standard deviations from the median protein expression across samples. (G) Correlation between the expression of CDH11 and ACTA2 genes in human PDAC.
Figure 3
Figure 3
Il33 expression in CAFs. (A) IHC analysis showed an increased number of Il33-expressing CAFs (Pdgfra+ cells) in KPC-Cdh11+/+ pancreas compared to KPC-Cdh11+/- pancreas. (B) IHC quantification of Il33 in CAFs (Pdgfra+ cells) from KPC-Cdh11+/+ and KPC-Cdh11+/- pancreases. *P value <0.05.
Figure 4
Figure 4
Characterization of pancreas-derived immune cells. (A) Immune cell clusters from KPC-Cdh11+/+ and KPC-Cdh11+/- mice visualized by UMAP. (B) Dot plot showing the expression of immune cell markers in scRNA-seq data from both KPC-Cdh11+/+ and KPC-Cdh11+/- mice. Dot size signifies the percentage of cells in that cluster that express a particular gene, while strength of color denotes average expression in that cluster. (C) Bar graph showing the proportion of each cell type in both experimental groups, calculated from the scRNA-seq data. (D) IHC showing CD8 T cell infiltration in tumors. (E) Violin plot showing the differential expression of selected T cell genes in various T cell clusters.
Figure 5
Figure 5
Monocytes and macrophages from pancreases of KPC-Cdh11+/- and KPC-Cdh11+/+ mice. (A) UMAP plot showing subtypes of Mono-Mac cells across mice of different Cdh11 status. (B) Feature plots denoting expression of Mrc1 and Plac8. (C) Heatmap showing expression of selected immune signaling molecules enriched in clusters 0-4. (D) Dot plot showing differential expression of cytokines and other selected genes in Mono-Macs from KPC-Cdh11+/- and KPC-Cdh11+/+ mice. (E) IHC showing F4/80 expressing macrophages in KPC-Cdh11+/- and KPC-Cdh11+/+ mice.
Figure 6
Figure 6
Neutrophils from pancreases of KPC-Cdh11+/- and KPC-Cdh11+/+ mice. (A) IHC analysis showing increased neutrophil infiltration in KPC-Cdh11+/+ mice. The dotted boxed area is shown on the right with higher magnification. (B) Dot plot showing cytokine expression in various immune cell clusters from both KPC-Cdh11+/- and KPC-Cdh11+/+ tumors. Dot size signifies the percentage of cells in each immune cluster that express a particular gene, while strength of color denotes average expression in that cluster. (C) Violin plots showing a subset of immune modulatory cytokine genes differentially expressed between neutrophils from KPC-Cdh11+/- and KPC-Cdh11+/+ mice. (D) Increased expression of cathepsins in neutrophils from KPC-Cdh11+/+ mice compared to KPC-Cdh11+/+ mice.

References

    1. Siegel RL, Miller KD, Fuchs HE, Jemal A. Cancer statistics 2021. CA Cancer J Clin (2021) 71:7–33. doi: 10.3322/caac.21654 - DOI - PubMed
    1. Singhi AD, Koay EJ, Chari ST, Maitra A. Early detection of pancreatic cancer: opportunities and challenges. Gastroenterology (2019) 156:2024–40. doi: 10.1053/j.gastro.2019.01.259 - DOI - PMC - PubMed
    1. Raufi AG, Manji GA, Chabot JA, Bates SE. Neoadjuvant treatment for pancreatic cancer. Semin Oncol (2019) 46:19–27. doi: 10.1053/j.seminoncol.2018.12.002 - DOI - PubMed
    1. Dumauthioz N, Labiano S, Romero P. Tumor resident memory T cells: new players in immune surveillance and therapy. Front Immunol (2018) 9:2076. doi: 10.3389/fimmu.2018.02076 - DOI - PMC - PubMed
    1. Park SY, Kim IS. Harnessing immune checkpoints in myeloid lineage cells for cancer immunotherapy. Cancer Lett (2019) 452:51–8. doi: 10.1016/j.canlet.2019.03.018 - DOI - PubMed