

Molecular dynamics analysis of superoxide dismutase 1 mutations suggests decoupling between mechanisms underlying ALS onset and progression
- PMID: 37954145
- PMCID: PMC10637862
- DOI: 10.1016/j.csbj.2023.09.016
Molecular dynamics analysis of superoxide dismutase 1 mutations suggests decoupling between mechanisms underlying ALS onset and progression
Abstract
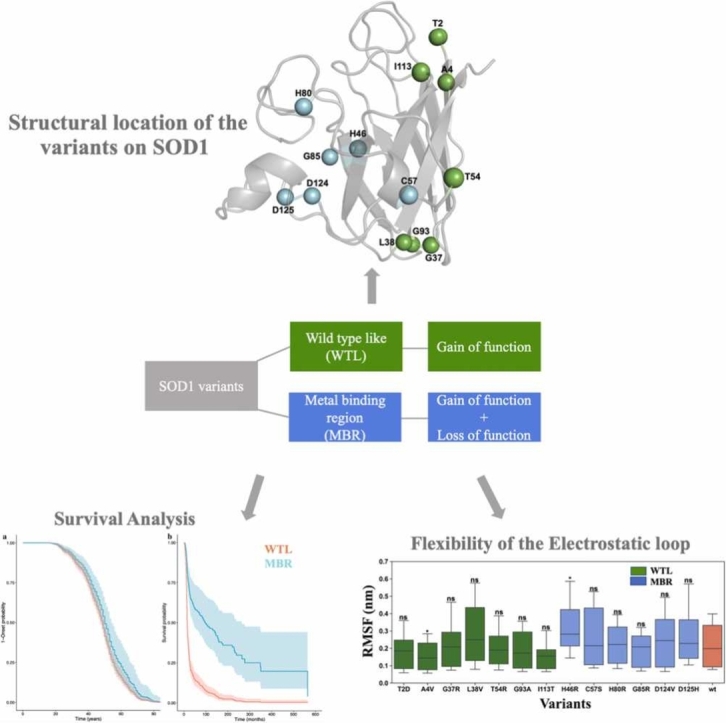
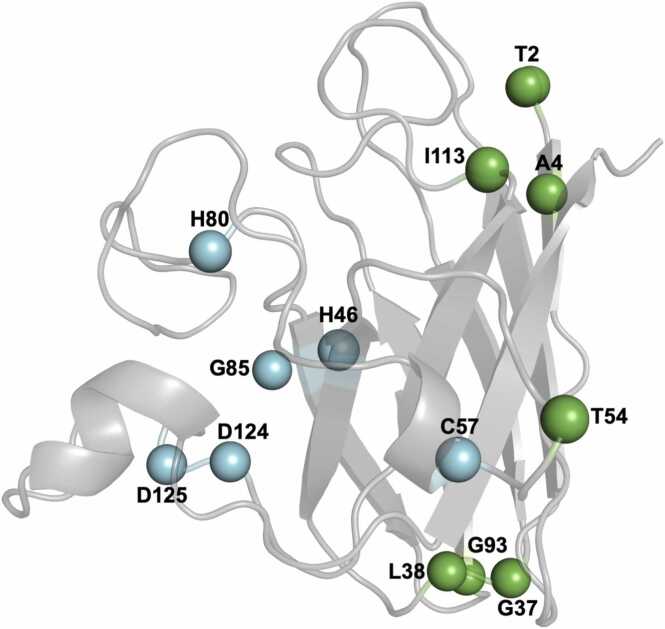
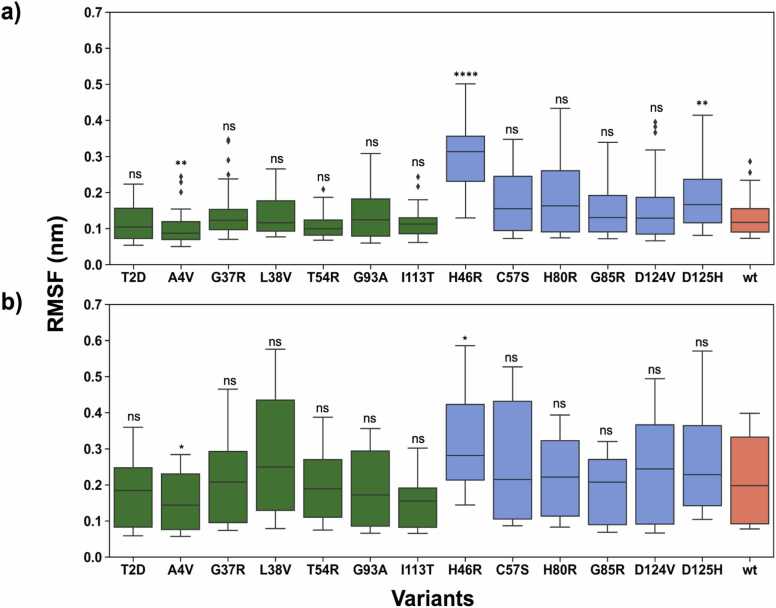
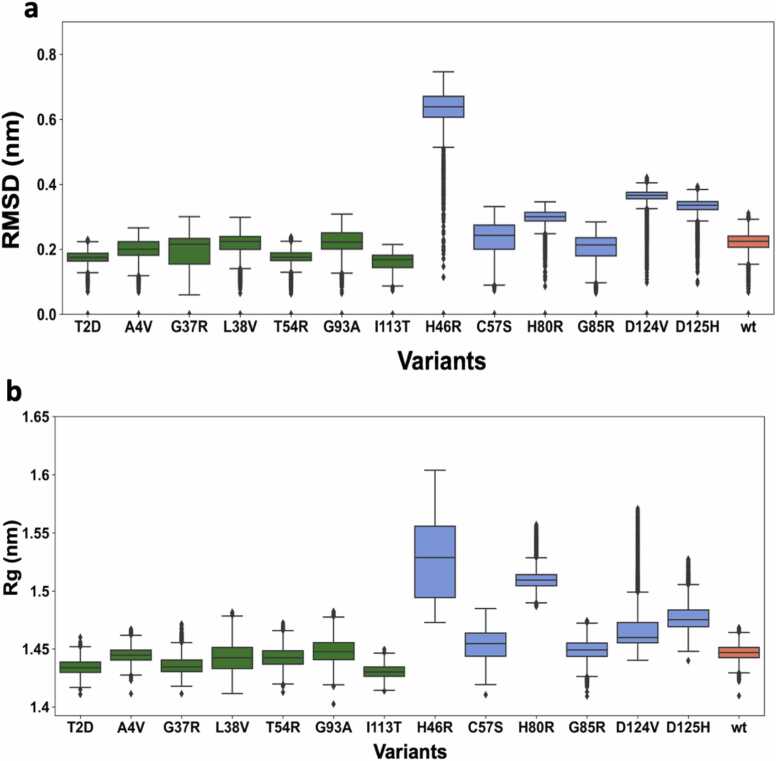
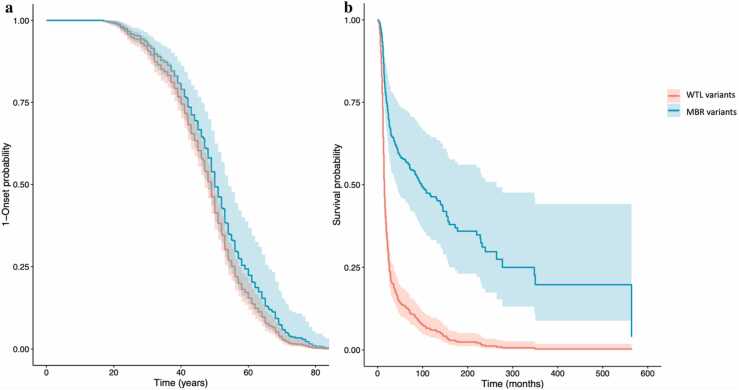
Mutations in the superoxide dismutase 1 (SOD1) gene are the second most common known cause of ALS. SOD1 variants express high phenotypic variability and over 200 have been reported in people with ALS. It was previously proposed that variants can be broadly classified in two groups, 'wild-type like' (WTL) and 'metal binding region' (MBR) variants, based on their structural location and biophysical properties. MBR variants, but not WTL variants, were associated with a reduction of SOD1 enzymatic activity. In this study we used molecular dynamics and large clinical datasets to characterise the differences in the structural and dynamic behaviour of WTL and MBR variants with respect to the wild-type SOD1, and how such differences influence the ALS clinical phenotype. Our study identified marked structural differences, some of which are observed in both variant groups, while others are group specific. Moreover, collecting clinical data of approximately 500 SOD1 ALS patients carrying variants, we showed that the survival time of patients carrying an MBR variant is generally longer (∼6 years median difference, p < 0.001) with respect to patients with a WTL variant. In conclusion, our study highlighted key differences in the dynamic behaviour between WTL and MBR SOD1 variants, and between variants and wild-type SOD1 at an atomic and molecular level, that could be further investigated to explain the associated phenotypic variability. Our results support the hypothesis of a decoupling between mechanisms of onset and progression of SOD1 ALS, and an involvement of loss-of-function of SOD1 with the disease progression.
Keywords: Amyotrophic lateral sclerosis; Diseaseassociated SOD1 mutations; Molecular dynamics (MD) simulations; Performed principal component analysis; Superoxide Dismutase type 1 (SOD1); Survival analysis.
© 2023 Published by Elsevier B.V. on behalf of Research Network of Computational and Structural Biotechnology.
Conflict of interest statement
None.
Figures
Similar articles
-
Mutant SOD1 instability: implications for toxicity in amyotrophic lateral sclerosis.Neurodegener Dis. 2005;2(3-4):115-27. doi: 10.1159/000089616. Neurodegener Dis. 2005. PMID: 16909016 Review.
-
The SOD1-mediated ALS phenotype shows a decoupling between age of symptom onset and disease duration.Nat Commun. 2022 Nov 12;13(1):6901. doi: 10.1038/s41467-022-34620-y. Nat Commun. 2022. PMID: 36371497 Free PMC article.
-
Comprehensive in silico analysis and molecular dynamics of the superoxide dismutase 1 (SOD1) variants related to amyotrophic lateral sclerosis.PLoS One. 2021 Feb 25;16(2):e0247841. doi: 10.1371/journal.pone.0247841. eCollection 2021. PLoS One. 2021. PMID: 33630959 Free PMC article.
-
Mutant superoxide dismutase-1 indistinguishable from wild-type causes ALS.Hum Mol Genet. 2012 Aug 15;21(16):3568-74. doi: 10.1093/hmg/dds188. Epub 2012 May 16. Hum Mol Genet. 2012. PMID: 22595972
-
Does wild-type Cu/Zn-superoxide dismutase have pathogenic roles in amyotrophic lateral sclerosis?Transl Neurodegener. 2020 Aug 19;9(1):33. doi: 10.1186/s40035-020-00209-y. Transl Neurodegener. 2020. PMID: 32811540 Free PMC article. Review.
Cited by
-
Uncovering the protein aggregation process through effect of G41D mutant SOD1 charge variation in ALS disease.Sci Rep. 2025 Aug 27;15(1):31661. doi: 10.1038/s41598-025-16910-9. Sci Rep. 2025. PMID: 40866479 Free PMC article.
-
Mutation/metal deficiency in the "electrostatic loop" enhanced aggregation process in apo/holo SOD1 variants: implications for ALS diseases.BMC Chem. 2024 Sep 19;18(1):177. doi: 10.1186/s13065-024-01289-x. BMC Chem. 2024. PMID: 39300574 Free PMC article.
-
Computational Approaches to Predict Protein-Protein Interactions in Crowded Cellular Environments.Chem Rev. 2024 Apr 10;124(7):3932-3977. doi: 10.1021/acs.chemrev.3c00550. Epub 2024 Mar 27. Chem Rev. 2024. PMID: 38535831 Free PMC article. Review.
-
Unsupervised machine learning identifies distinct ALS molecular subtypes in post-mortem motor cortex and blood expression data.Acta Neuropathol Commun. 2023 Dec 21;11(1):208. doi: 10.1186/s40478-023-01686-8. Acta Neuropathol Commun. 2023. PMID: 38129934 Free PMC article.
-
Osmolyte-induced protein stability changes explained by graph theory.Comput Struct Biotechnol J. 2024 Oct 28;23:4077-4087. doi: 10.1016/j.csbj.2024.10.014. eCollection 2024 Dec. Comput Struct Biotechnol J. 2024. PMID: 39660214 Free PMC article.
References
-
- Cleveland D.W., Rothstein J.D. From Charcot to Lou Gehrig: deciphering selective motor neuron death in ALS. Nat Rev Neurosci. 2001;2(11):806–819. - PubMed
-
- Boillée S., Velde C.V., Cleveland D.W. ALS: a disease of motor neurons and their nonneuronal neighbors. Neuron. 2006;52(1):39–59. - PubMed
-
- Perrone B., Conforti F.L. Common mutations of interest in the diagnosis of amyotrophic lateral sclerosis: how common are common mutations in ALS genes? Expert Rev. Mol. Diagn. 2020;20(7):703–714. - PubMed
-
- Stathopulos P.B., et al. Calorimetric analysis of thermodynamic stability and aggregation for apo and holo amyotrophic lateral sclerosis-associated Gly-93 mutants of superoxide dismutase. J Biol Chem. 2006;281(10):6184–6193. - PubMed
LinkOut - more resources
Full Text Sources
Miscellaneous