

Consistent analysis of differentially expressed genes across 7 cell types in papillary thyroid carcinoma
- PMID: 37954148
- PMCID: PMC10637855
- DOI: 10.1016/j.csbj.2023.10.045
Consistent analysis of differentially expressed genes across 7 cell types in papillary thyroid carcinoma
Abstract
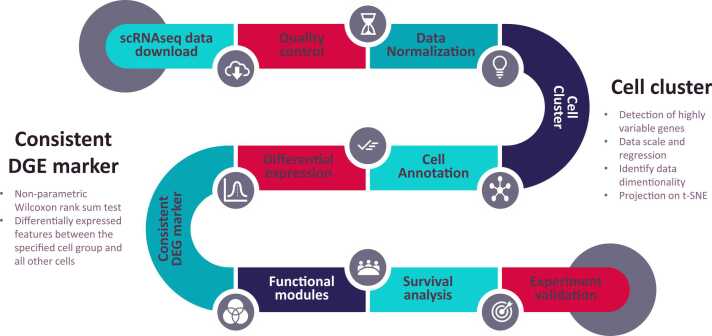
Single-cell transcriptome sequencing (scRNA-seq) provides a higher resolution of cellular differences than bulk RNA-seq, enabling the dissection of cell-type-specific responses to perturbations in papillary thyroid carcinoma (PTC). However, cellular genomic features are highly heterogeneous and have a large number of genes without any expression signals, which hinders the statistical power to identify differentially expressed genes and may generate many false-positive results. To overcome this challenge, we conducted an integrative analysis on two PTC scRNA-seq datasets and cross-validated consistent differential expression. By combining results from 32 common cell types in the two studies, we identified 31 consistently differentially expressed genes (DEGs) across seven cell types, including B cells, endothelial cells, epithelial cells, monocytes, NK cells, smooth muscle cells, and T cells. Functional enrichment analysis revealed that these genes are important for the adaptive immune response and autoimmune thyroid diseases. The additional disease-free survival analysis also confirmed that these 31 genes significantly affected patient survival time in large scale thyroid cancer cohort. Furthermore, we experimentally validated one of the top consistent DEGs as a potential biomarker gene of PTC epithelial cells, KRT7, which may be a upstream gene for the NF-κB signaling pathway. The result shows that KRT7 may promote thyroid cancer metastasis through the epithelial-mesenchymal transition and NF-κB signaling pathway. In summary, our single-cell transcriptome integration-based approach may provide insights into the important role of NF-κB in the underlying biology of the PTC.
Keywords: EMT; KRT7; NF-κB; Papillary thyroid carcinoma; ScRNA-seq.
© 2023 The Authors.
Conflict of interest statement
The authors have declared no competing interests.
Figures


Similar articles
-
Integrative transcriptomics and single-cell transcriptomics analyses reveal potential biomarkers and mechanisms of action in papillary thyroid carcinoma.Front Genet. 2025 May 30;16:1536198. doi: 10.3389/fgene.2025.1536198. eCollection 2025. Front Genet. 2025. PMID: 40520228 Free PMC article.
-
Gene expression profile analyze the molecular mechanism of CXCR7 regulating papillary thyroid carcinoma growth and metastasis.J Exp Clin Cancer Res. 2015 Feb 12;34(1):16. doi: 10.1186/s13046-015-0132-y. J Exp Clin Cancer Res. 2015. PMID: 25887589 Free PMC article.
-
Single-Cell RNA Sequencing Revealed a 3-Gene Panel Predicted the Diagnosis and Prognosis of Thyroid Papillary Carcinoma and Associated With Tumor Immune Microenvironment.Front Oncol. 2022 Mar 11;12:862313. doi: 10.3389/fonc.2022.862313. eCollection 2022. Front Oncol. 2022. PMID: 35359404 Free PMC article.
-
Integrated transcriptome sequencing and weighted gene co-expression network analysis reveals key genes of papillary thyroid carcinomas.Heliyon. 2024 Mar 15;10(7):e27928. doi: 10.1016/j.heliyon.2024.e27928. eCollection 2024 Apr 15. Heliyon. 2024. PMID: 38560266 Free PMC article.
-
Identification of key genes of papillary thyroid carcinoma by integrated bioinformatics analysis.Biosci Rep. 2020 Aug 28;40(8):BSR20201555. doi: 10.1042/BSR20201555. Biosci Rep. 2020. PMID: 32766727 Free PMC article.
Cited by
-
Integrative transcriptomics and single-cell transcriptomics analyses reveal potential biomarkers and mechanisms of action in papillary thyroid carcinoma.Front Genet. 2025 May 30;16:1536198. doi: 10.3389/fgene.2025.1536198. eCollection 2025. Front Genet. 2025. PMID: 40520228 Free PMC article.
-
Intelligent biology and medicine: Accelerating innovative computational approaches.Comput Struct Biotechnol J. 2024 Nov 28;27:32-34. doi: 10.1016/j.csbj.2024.11.044. eCollection 2025. Comput Struct Biotechnol J. 2024. PMID: 39790120 Free PMC article.
References
-
- Greco A., et al. In: Cancer Genomics. Dellaire G., Berman J.N., Arceci R.J., editors. Academic Press; Boston: 2014. Chapter 16 - thyroid cancer; pp. 265–280.
-
- Andrews T.S., et al. Tutorial: guidelines for the computational analysis of single-cell RNA sequencing data. Nat Protoc. 2021;16(1):1–9. - PubMed
LinkOut - more resources
Full Text Sources
Research Materials
Miscellaneous