. 2023 Nov 6:15:785-799.
doi: 10.2147/BCTT.S430513. eCollection 2023.

Therapeutic Advantage of Targeting PRMT5 in Combination with Chemotherapies or EGFR/HER2 Inhibitors in Triple-Negative Breast Cancers

Affiliations

Therapeutic Advantage of Targeting PRMT5 in Combination with Chemotherapies or EGFR/HER2 Inhibitors in Triple-Negative Breast Cancers

Rayan Dakroub et al. Breast Cancer (Dove Med Press). .

Abstract

Purpose: Triple-negative breast cancer (TNBC) is the most aggressive breast cancer subgroup characterized by a high risk of resistance to chemotherapies and high relapse potential. TNBC shows inter-and intra-tumoral heterogeneity; more than half expresses high EGFR levels and about 30% are classified as HER2-low breast cancers. High PRMT5 mRNA levels are associated with poor prognosis in TNBC and inhibiting PRMT5 impairs the viability of subsets of TNBC cell lines and delays tumor growth in TNBC mice models. TNBC patients may therefore benefit from a treatment targeting PRMT5. The aim of this study was to assess the therapeutic benefit of combining a PRMT5 inhibitor with different chemotherapies used in the clinics to treat TNBC patients, or with FDA-approved inhibitors targeting the HER family members.

Methods: The drug combinations were performed using proliferation and colony formation assays on TNBC cell lines that were sensitive or resistant to EPZ015938, a PRMT5 inhibitor that has been evaluated in clinical trials. The chemotherapies analyzed were cisplatin, doxorubicin, camptothecin, and paclitaxel. The targeted therapies tested were erlotinib (EGFR inhibitor), neratinib (EGFR/HER2/HER4 inhibitor) and tucatinib (HER2 inhibitor).

Results: We found that PRMT5 inhibition synergized mostly with cisplatin, and to a lesser extent with doxorubicin or camptothecin, but not with paclitaxel, to impair TNBC cell proliferation. PRMT5 inhibition also synergized with erlotinib and neratinib in TNBC cell lines, especially in those overexpressing EGFR. Additionally, a synergistic interaction was observed with neratinib and tucatinib in a HER2-low TNBC cell line as well as in a HER2-positive breast cancer cell line. We noticed that synergy can be obtained in TNBC cell lines that were resistant to PRMT5 inhibition alone.

Conclusion: Altogether, our data highlight the therapeutic potential of targeting PRMT5 using combinatorial strategies for the treatment of subsets of TNBC patients.

Keywords: TNBC; cisplatin; drug combination; erlotinib; neratinib.


Conflict of interest statement

The authors declare that they have no competing interests in this work.

Figures

Figure 1
Figure 1
Evaluation of the sensitivity of various breast cell lines to PRMT5 inhibition (EPZ015938). Six TNBC (red), two HER2-positive (blue), two luminal (green) breast cancer cell lines, and one non-tumorigenic breast cell line (black) were treated with nanomolar doses (3.9 nM – 1000 nM) of EPZ015938 (PRMT5i). Cell proliferation was determined after four mitotic cycles. The percentage of viable cells was normalized to DMSO-treated cells. The mean of at least three independent experiments is presented for each cell line (error bars are not shown to better visualize the different cell lines but IC50 ± SD are indicated in Table S2).
Figure 2
Figure 2
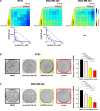
Effect of the inhibition of PRMT5 in combination with cisplatin on the proliferation (A) and colony formation (B and C) of TNBC cell lines. (A) BT20, MDA-MB-468, and MDA-MB-453 TNBC cells were seeded in 96-well plates and treated with varying concentrations of EPZ015938 (PRMT5i) and/or cisplatin, then cell proliferation was measured after four mitotic cycles (7 days). The percentage of viable cells was normalized to (DMSO + H2O)-treated cells. Each drug was used at a maximal concentration of 2xIC50 for sensitive cell lines (5 µM maximum for resistant cells), followed by two-fold serial dilutions. The nature of drug interaction between EPZ015938 and cisplatin was assessed using the Loewe model on the Combenefit software. The synergy matrix (upper panel) and isobologram (bottom panel) for each cell line are shown. Isobolograms represent the IC50 (BT20, MDA-MB-468) or IC60 (MDA-MB-453) of cisplatin (X-axis) obtained at various EPZ015938 concentrations (Y-axis). CI were calculated at the different EPZ015938 concentrations used and are shown on the isobolograms. Data are representative of at least three independent experiments. (B and C) BT20 (B) and MDA-MB-468 (C) cells were seeded at low densities and then treated with DMSO + H2O, EPZ015938 (PRMT5i), cisplatin, or a combination (combo) of the two drugs. The colony number was quantified using ImageJ software. An image for each condition is shown and is representative of three independent experiments. Quantification of colony number is expressed as a percentage relative to (DMSO + H2O)-treated cells and represented as the mean ± SD from at least three independent experiments (right panels). P values were calculated using a Student’s t-test and presented as: *p<0.05, **p<0.01, ***p<0.001, ****p<0.0001.
Figure 3
Figure 3
Effect of the inhibition of PRMT5 in combination with doxorubicin (A) or camptothecin (B) on TNBC cell proliferation. BT20, MDA-MB-468, and MDA-MB-453 TNBC cells were seeded in 96-well plates and treated with varying concentrations of EPZ015938 (PRMT5i) and/or doxorubicin (A) or camptothecin (B), then cell proliferation was measured after four mitotic cycles (7 days). The percentage of viable cells was normalized to DMSO-treated cells. Each drug was used at a maximal concentration of 2xIC50 for sensitive cell lines (5 µM maximum for resistant cells), followed by two-fold serial dilutions. The nature of drug interaction between EPZ015938 and doxorubicin (A) or camptothecin (B) was assessed using the Loewe model on the Combenefit software. The synergy matrix (upper panel) and isobologram (bottom panel) for each cell line are shown. Isobolograms represent the IC50 of doxorubicin (A) or camptothecin (B) (X-axis) obtained at various EPZ015938 concentrations (Y-axis). CI were calculated at the different EPZ015938 concentrations used and are shown on the isobolograms. Data are representative of at least three independent experiments.
Figure 4
Figure 4
Effect of PRMT5i/erlotinib combination on the proliferation (A) and colony formation (B and C) of TNBC cell lines. (A) BT20, MDA-MB-453, and MDA-MB-468 cells were seeded in 96-well plates and treated with varying concentrations of EPZ015938 (PRMT5i) and/or erlotinib, then cell proliferation was measured after four mitotic cycles (7 days). The percentage of viable cells was normalized to DMSO-treated cells. Cells were treated with a 5 µM maximal concentration of erlotinib, and EPZ015938 was used at a maximal concentration of 2xIC50 for sensitive cell lines (5 µM for resistant cells). Both drugs were then two-fold serially diluted. The nature of drug interaction between EPZ015938 and erlotinib was assessed using the Loewe model on the Combenefit software. The synergy matrix (upper panel) and isobologram (bottom panel) for each cell line are shown. Isobolograms represent the IC50 of erlotinib (X-axis) obtained at various EPZ015938 concentrations (Y-axis). CI were calculated at the different EPZ015938 concentrations used and are shown on the isobolograms. Isobologram for MDA-MB-453 cells (A) was not plotted as erlotinib alone did not impair cell viability by more than 20% and is indicated as NA (not applicable). Data are representative of at least three independent experiments. (B and C) BT20 (B) and MDA-MB-468 (C) cells were seeded at low densities and then treated with DMSO, EPZ015938 (PRMT5i), erlotinib, or a combination (combo) of the two inhibitors. Colonies were quantified using ImageJ software. An image for each condition is shown and is representative of three independent experiments (left panel). Quantification of colony number is expressed as a percentage relative to DMSO-treated cells and represented as mean ± SD of three independent experiments (right panel). P values were calculated using a Student’s t-test and presented as: *p<0.05, **p<0.01, ***p<0.001, ****p<0.0001.
Figure 5
Figure 5
Effect of PRMT5/neratinib and PRMT5/tucatinib combinations on the proliferation of TNBC and HER2-positive breast cancer cell lines. BT20, MDA-MB-468, MDA-MB-453, and HCC1954 cells were seeded in 96-well plates and treated with varying concentrations of EPZ015938 (PRMT5i) and/or neratinib or tucatinib as indicated, then cell proliferation was measured after four mitotic cycles (7 days). The percentage of viable cells was normalized to DMSO-treated cells. Each drug was used at a maximal concentration of 2xIC50 for sensitive cell lines (5 µM maximum for resistant cells), followed by two-fold serial dilutions. The nature of drug interaction between EPZ015938 and neratinib or tucatinib was assessed using the Loewe model on the Combenefit software. The synergy matrix (upper panel) and isobologram (bottom panel) for each cell line are shown. Isobolograms represent the IC50 (BT20, MDA-MB-453, and HCC1954) or IC65 (MDA-MB-468) of neratinib or the IC50 of tucatinib (X-axis) obtained at various EPZ015938 concentrations (Y-axis). CI were calculated at the different EPZ015938 concentrations used and are shown on the isobolograms. Data are representative of at least three independent experiments.

Similar articles

Cited by

References

    1. Loibl S, Poortmans P, Morrow M, Denkert C, Curigliano G. Breast cancer. Lancet. 2021;397(10286):1750–1769. doi:10.1016/S0140-6736(20)32381-3 - DOI - PubMed
    1. Denkert C, Liedtke C, Tutt A, von Minckwitz G. Molecular alterations in triple-negative breast cancer—the road to new treatment strategies. Lancet. 2017;389(10087):2430–2442. doi:10.1016/S0140-6736(16)32454-0 - DOI - PubMed
    1. Li Y, Tsang JY, Tam F, Loong T, Tse GM. Comprehensive characterization of HER2-low breast cancers: implications in prognosis and treatment. EBioMedicine. 2023;91:104571. doi:10.1016/j.ebiom.2023.104571 - DOI - PMC - PubMed
    1. Popović M, Silovski T, Križić M, Dedić Plavetić N. HER2 low breast cancer: a new subtype or a trojan for cytotoxic drug delivery? Int J Mol Sci. 2023;24(9):8206. doi:10.3390/IJMS24098206 - DOI - PMC - PubMed
    1. Zagami P, Carey LA. Triple negative breast cancer: pitfalls and progress. NPJ Breast Cancer. 2022;8(1):95. doi:10.1038/s41523-022-00468-0 - DOI - PMC - PubMed