. 2023 Nov 13:12:RP86655.
doi: 10.7554/eLife.86655.

Molecular portraits of colorectal cancer morphological regions

Affiliations

Molecular portraits of colorectal cancer morphological regions

Eva Budinská et al. Elife. .

Abstract

Heterogeneity of colorectal carcinoma (CRC) represents a major hurdle towards personalized medicine. Efforts based on whole tumor profiling demonstrated that the CRC molecular subtypes were associated with specific tumor morphological patterns representing tumor subregions. We hypothesize that whole-tumor molecular descriptors depend on the morphological heterogeneity with significant impact on current molecular predictors. We investigated intra-tumor heterogeneity by morphology-guided transcriptomics to better understand the links between gene expression and tumor morphology represented by six morphological patterns (morphotypes): complex tubular, desmoplastic, mucinous, papillary, serrated, and solid/trabecular. Whole-transcriptome profiling by microarrays of 202 tumor regions (morphotypes, tumor-adjacent normal tissue, supportive stroma, and matched whole tumors) from 111 stage II-IV CRCs identified morphotype-specific gene expression profiles and molecular programs and differences in their cellular buildup. The proportion of cell types (fibroblasts, epithelial and immune cells) and differentiation of epithelial cells were the main drivers of the observed disparities with activation of EMT and TNF-α signaling in contrast to MYC and E2F targets signaling, defining major gradients of changes at molecular level. Several gene expression-based (including single-cell) classifiers, prognostic and predictive signatures were examined to study their behavior across morphotypes. Most exhibited important morphotype-dependent variability within same tumor sections, with regional predictions often contradicting the whole-tumor classification. The results show that morphotype-based tumor sampling allows the detection of molecular features that would otherwise be distilled in whole tumor profile, while maintaining histopathology context for their interpretation. This represents a practical approach at improving the reproducibility of expression profiling and, by consequence, of gene-based classifiers.

Keywords: cancer biology; colorectal cancer; human; intra-tumor heterogeneity; morphology; transcriptomics.


Conflict of interest statement

EB, MH, TI, MM, RN, BB, DA, MR, LZ, OS, JF, MD, PB, ST, VP No competing interests declared

Figures

Figure 1.
Figure 1.. Morphological patterns and their distribution in the dataset.
(A) The six CRC morphological patterns of interest (morphotypes). Left: example of an original annotation used for macrodissection and RNA extraction. Note that the original annotations in the image are not identical to the ones used in the main text. Here, A-SE stands for serrated (SE) in the text, B-DE for desmoplastic (DE) in the text, C-MUC for mucinous (MU) in the text, and D-ST for solid/trabecular (TB) in the text, respectively. Also, N indicates a tumor-adjacent normal epithelial region and S a supportive stroma region, respectively. Right: examples of morphotypes – complex tubular (CT), desmoplastic (DE), mucinous (MU), papillary (PP), serrated (SE), and solid/trabecular (TB). (B) Morphotype distribution per case (unique tumor) and intersections thereof: some cases had several morphotypes profiled.
Figure 2.
Figure 2.. CRC morphotypes: in silico decomposition of the cellular admixture.
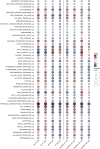
(A) Boxplots of the tumor purity (epithelial content – ESTIMATE method) in each tumor morphotype and the two non-tumor regions, ordered by increasing median values. (B) Signatures specific to colon crypt compartments and major cell types estimated from gene expression data in terms of normalized enrichment scores (NES): only statistically significant scores are shown. (C) Immune cell fractions (and unassigned fractions) inferred from gene expression data using quanTIseq method. (D) Types of cancer-associated fibroblasts (CAFs) as estimated from gene expression using the signatures from Khaliq et al., 2022; Kieffer et al., 2020.
Figure 2—figure supplement 1.
Figure 2—figure supplement 1.. Epithelial signatures from Pelka et al., 2021.
Only statistically significant scores (NES) are shown.
Figure 2—figure supplement 2.
Figure 2—figure supplement 2.. Immune signatures from Pelka et al., 2021.
Only statistically significant scores (NES) are shown.
Figure 2—figure supplement 3.
Figure 2—figure supplement 3.. Stromal signatures from Pelka et al., 2021.
Only statistically significant scores (NES) are shown.
Figure 3.
Figure 3.. Top differentially expressed genes and hallmark pathways.
(A) GSEA scores for hallmark pathways in the six morphotypes and two non-tumoral regions. Only pathways with statistically significant scores are shown. (B) Principal component analysis of hallmark pathways: the median profiles of the six morphotypes (CT: complex tubular, DE: desmoplastic, MU: mucinous, PP: papillary, SE: serrated, and TB: solid/trabecular) and the two non-tumoral regions (NR: tumor-adjacent normal and ST: supportive stroma) are projected onto the space defined by first two principal components (74% of the total variance). The top pathways contributing to the principal axes are shown as well. See also Figure 3—figure supplement 1. (C) Heatmap of top 5 up- and down-regulated genes for each of the six morphotypes.
Figure 3—figure supplement 1.
Figure 3—figure supplement 1.. Principal component analysis of hallmark pathways GSEA scores: loadings for the first two principal components, i.e., contribution of pathways to the first two axes.
Figure 3—figure supplement 2.
Figure 3—figure supplement 2.. Hallmark pathways differential activation between pairs of morphotypes.
Here we compare the results from GSEA applied to differentially expressed genes between pairs of morphotypes originating from all cases to results of GSEA applied to differentially expressed genes between pairs of morphotypes originating from the same section (tumor; i.e., matched pairs of morphotypes). All results are shown, including the statistically not significant ones. First, four columns correspond to pairs of morphotypes from all cases, while the last four, to matched pairs of morphotypes.
Figure 4.
Figure 4.. Intra-tumoral heterogeneity and the morphotypes (for all core samples, including those unassigned by the classifiers).
Only cases with at least two distinct morphotypes present are shown. (A) Left: CMS assignment for tumors represented by multiple regions. Right: CMS assignment per morphotype (and two non-tumoral patterns). (B) Left: iCMS assignment for tumors represented by multiple regions. Right: iCMS assignment per morphotype (and two non-tumoral patterns). (C) Differences between paired signatures: morphotypes vs whole tumor (each signature was normalized to [0,1] prior to computing the differences). Only four (morphotype, whole tumor) pairs were represented enough in the data. (D) Boxplots for the ten (normalized) signatures across morphotypes. The ‘Eschrich’ and ‘Jorissen’ signatures vary significantly (Kruskal-Wallis’s test) across morphotypes. For equivalent plots for all samples, including non-core, see Figure 4—figure supplement 1.
Figure 4—figure supplement 1.
Figure 4—figure supplement 1.. Molecular subtypes and morphotypes in all samples, including non-core samples.
Note that the sets of samples in A and C are the same as in Figure 4, as only core samples also had at least two distinct morphological regions.
Figure 5.
Figure 5.. Intra-tumoral heterogeneity case study.
For the same case, different CMS labels are assigned to regions and whole tumor profile. The hallmark pathways show various levels of activation (as computed by GSVA) within same section. The relative change in prognostic scores indicate potential underestimation of risk for some signatures, while others appear to be stable across tumor. See also Figure 5—figure supplements 1 and 2. Note that in the pathology section image, the original annotations were preserved, and they are not identical to the ones used in the main text. Here, MUC stands for mucinous (MU) in the text. Also, N indicates a tumor-adjacent normal epithelial region and S a supportive stroma region, respectively.
Figure 5—figure supplement 1.
Figure 5—figure supplement 1.. Intra-tumoral heterogeneity additional case study.
Figure 5—figure supplement 2.
Figure 5—figure supplement 2.. Intra-tumoral heterogeneity additional case study.
Figure 6.
Figure 6.. Normalized enrichment scores from GSEA for selected resistance signatures (from C2 section of MSigDB).
Only significant scores are shown.
Figure 6—figure supplement 1.
Figure 6—figure supplement 1.. Resistance scores (GSVA) per patient and morphotype for cases where the whole–tumor prediction is contradicted by some regional score.

Update of

  • doi: 10.1101/2023.01.24.525310
  • doi: 10.7554/eLife.86655.1
  • doi: 10.7554/eLife.86655.2

References

    1. Amin MB. In: AJCC Cancer Staging Manual. Amin MB, Edge SB, Gress DM, Meyer LR, editors. Chicago IL: Springer; 2017. American Cancer society; pp. XVII–1032.
    1. Betge J, Schneider NI, Harbaum L, Pollheimer MJ, Lindtner RA, Kornprat P, Ebert MP, Langner C. MUC1, MUC2, MUC5AC, and MUC6 in colorectal cancer: expression profiles and clinical significance. Virchows Archiv. 2016;469:255–265. doi: 10.1007/s00428-016-1970-5. - DOI - PMC - PubMed
    1. Bosman FT. WHO Classification of Tumours of the Digestive System. Lyon: International Agency for Research on Cancer; 2010.
    1. Budinska E, Popovici V, Tejpar S, D’Ario G, Lapique N, Sikora KO. Gene expression patterns unveil a new level of molecular heterogeneity in colorectal cancer. The Journal of Pathology. 2013;231:63–76. doi: 10.1002/path.4212. - DOI - PMC - PubMed
    1. Budinska E, Bosman F, Popovici V. Experiments in molecular subtype recognition based on histopathology images. 2016 IEEE 13th International Symposium on Biomedical Imaging; 2016. pp. 1168–1172. - DOI

Publication types

MeSH terms