. 2023 Nov 21;120(47):e2300733120.
doi: 10.1073/pnas.2300733120. Epub 2023 Nov 13.

A B cell-driven EAE mouse model reveals the impact of B cell-derived cytokines on CNS autoimmunity

Affiliations

A B cell-driven EAE mouse model reveals the impact of B cell-derived cytokines on CNS autoimmunity

Anna S Thomann et al. Proc Natl Acad Sci U S A. .

Abstract

In multiple sclerosis (MS), pathogenic T cell responses are known to be important drivers of autoimmune inflammation. However, increasing evidence suggests an additional role for B cells, which may contribute to pathogenesis via antigen presentation and production of proinflammatory cytokines. However, these B cell effector functions are not featured well in classical experimental autoimmune encephalomyelitis (EAE) mouse models. Here, we compared properties of myelin oligodendrocyte glycoprotein (MOG)-specific and polyclonal B cells and developed an adjuvant-free cotransfer EAE mouse model, where highly activated, MOG-specific induced germinal center B cells provide the critical stimulus for disease development. We could show that high levels of MOG-specific immunoglobulin G (IgGs) are not required for EAE development, suggesting that antigen presentation and activation of cognate T cells by B cells may be important for pathogenesis. As our model allows for B cell manipulation prior to transfer, we found that overexpression of the proinflammatory cytokine interleukin (IL)-6 by MOG-specific B cells leads to an accelerated EAE onset accompanied by activation/expansion of the myeloid compartment rather than a changed T cell response. Accordingly, knocking out IL-6 or tumor necrosis factor α in MOG-specific B cells via CRISPR-Cas9 did not affect activation of pathogenic T cells. In summary, we generated a tool to dissect pathogenic B cell effector function in EAE development, which should improve our understanding of pathogenic processes in MS.

Keywords: B cells; CNS autoimmunity; EAE/MS; cytokines.


Conflict of interest statement

The authors declare no competing interest.

Figures

Fig. 1.
Fig. 1.
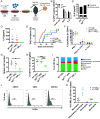
IgHMOG mice show an increased MZ B cell compartment and a more proinflammatory cytokine profile. Splenocytes of WT, heterozygous IgHMOG(+/–), and homozygous IgHMOG mice were isolated and analyzed by flow cytometry. (A) Identification of IgDhigh follicular (Fol) B cells and IgMhigh CD1d+ MZ B cells in the spleens of WT, heterozygous IgHMOG(+/–), and homozygous IgHMOG mice. (B) Frequency and absolute numbers of (C) MZ B cells or (D) follicular (Fol) B cells in WT, IgHMOG(+/–), or IgHMOG mice. Horizontal lines indicate means. Dots represent individual mice. **P < 0.01 and ***P < 0.005, one-way ANOVA with Tukey post-test. (E) Fol B cells and MZ B cells were sorted and cocultured with Cell Trace Violet (CTV)-labeled CD4+ T cells isolated from 2D2 mice at a 1:1 ratio in the presence of 50 µg/mL mMOG protein. CD4+ T cell proliferation was measured by CTV dilution after 4 d of coculture. Histograms show CTV dilution within the CD4+ cell population cultured without B cells (black) or in the presence of Fol B (green) or MZ B cells (orange) and are representative of three independent experiments. Dotted histograms show the respective condition without the addition of MOG antigen. (F and G) Total B cells or (H and I) B cell subsets were isolated or sorted from the spleens of WT or IgHMOG mice and stimulated with anti-CD40 and LPS for 24 h. Prior to FACS staining, the cells were stimulated with PMA, ionomycin, and brefeldin A for 4 h. Dots represent individual mice. (FI) *P < 0.05 and **P < 0.01, paired t test.
Fig. 2.
Fig. 2.
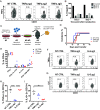
An adjuvant-free B cell–dependent adoptive cotransfer model to investigate B cell effector functions during EAE. (A) Experimental outline. WT or IgHMOG B cells were activated and expanded in the iGB culture system for 3 d. Then, the cells were loaded with MOG protein for 3 h, and 1.5 × 10⁷ iGB cells were adoptively transferred together with 5 × 10⁶ unmanipulated 2D2 CD4+ T cells into Rag1-KO recipients. (B) EAE incidence in Rag1-KO mice that received either WT or IgHMOG iGB cells together with 2D2 CD4+ T cells. Clinical data are shown for 3 mice (WT) or 7 mice per group (IgHMOG) pooled from 2 independent experiments. **P < 0.01 Mantel–Cox log-rank test. (C) IFNγ and IL-17A expression by CD4+ T cells in the CNS of sick IgHMOG iGB recipients at the peak of the disease. Flow cytometry plots are representative for n = 7 mice pooled from 2 independent experiments. (D) Representative flow cytometry plots and (E) quantification of IgG1+ B cells before and after adoptive transfer in different organs analyzed at the peak of disease (IgHMOG iGB) or at the end of the observation period (WT iGB). Horizontal lines indicate means. Dots represent individual mice. *P < 0.05, unpaired t test. iLN, inguinal lymph node; cLN, cervical lymph node; mLN, mesenteric lymph node. (F) MOG-specific IgG1 antibodies in serum samples (1:1,000 diluted) from iGB recipients were measured by ELISA. Results are shown as optical density (OD). Bars indicated means. Dots represent individual mice. ****P < 0.0001, unpaired t test.
Fig. 3.
Fig. 3.
Disease development is independent of high MOG-specific IgG1 antibody titers. IgHMOG B cells were cultured in the iGB culture system for 3 d in the absence or presence of IL-4. Then, the cells were loaded with MOG protein and adoptively transferred together with unmanipulated CD4+ T cells into Rag1-KO recipients. (A) Fas and GL7 and (B) IgG1 expression in iGB cells before adoptive transfer. (C) Expansion of unswitched (without IL-4, black) or switched (+ IL-4, red) iGB cells after 3 d of culture. Data are shown as mean + SEM pooled from 5 independent experiments. (D) EAE incidence in Rag1-KO mice that received either unswitched (without IL-4, black) or switched (+IL-4, red) IgHMOG iGB cells. Clinical data are shown for 10 mice (unswitched) or 8 mice per group (switched) pooled from 2 independent experiments. (E) EAE scores in sick mice receiving either unswitched or switched IgHMOG iGB cells. (F) MOG-specific IgG1 and (G) IgM levels in the serum of mice receiving unswitched (black) or switched (red) IgHMOG iGB cells. Antibody levels are shown separately for mice that developed EAE (solid lines) and mice that remained healthy (dashed lines). Dots indicate means ± SEM for indicated numbers of mice per group. *P < 0.05, unpaired t test.
Fig. 4.
Fig. 4.
IL-6 production by antigen-specific B cells can enhance their ability to induce EAE. (A) Experimental outline. WT or IgHMOG B cells were cultured in the iGB culture system. After 48 h, the cells were retrovirally transduced overnight and then cultured on fresh feeder cells. Two days after transduction, the cells were loaded with MOG protein and adoptively transferred together with unmanipulated 2D2 CD4+ T cells into Rag1-KO mice. (B) Frequency of successfully transduced GFP+ cells on day 5 of iGB culture in WT (filled bars) or IgHMOG iGB cells (open bars). (C) IL-6 concentration in the culture supernatants measured by ELISA. Striped bars represent IL-6 levels in cultures transduced with an empty eGFP vector. Data are shown as mean + SEM from 2 to 5 experiments. (D) IL-6 levels measured in the serum of mice receiving IL-6 overexpressing (iGB6) IgHMOG or WT iGB cells or IgHMOG cells transduced with an empty vector (iGBGFP). (E) EAE incidence is shown for 7 mice per group pooled from 2 independent experiments. *P < 0.05, Mantel–Cox log-rank test with adjusted P values for multiple comparisons using the Holm–Sidak method. (F) Frequency of IFNγ+, IFNγ+ IL-17A+, and IL-17A+ CD4+ T cells in the CNS of iGB recipients analyzed at the peak of the disease. (G) Quantification of the total number of spleen cells and (H) the frequency of CD11b+ myeloid cells in the spleen of iGB recipients. Horizontal lines indicate means. Dots represent individual mice. *P < 0.05 and ****P < 0.0001, one-way ANOVA with Tukey post-test. (I) Distribution of different cell types in the CD11b+ population shown as mean from 4 mice per group. (J) IL-6Rα expression in different cell populations in the spleen of IgHMOG iGBGFP mice 8 d post-transfer. Histograms are representative for n = 3 mice. (K) Quantification of the frequency of IL-6Rα+ cells within the different CD11b+ myeloid cell populations. Dots represent individual mice. *P < 0.05, unpaired t test.
Fig. 5.
Fig. 5.
IL-6 and TNFα production by iGB cells is not required for EAE induction. (A and B) R26-Cas9 × IgHMOG B cells were cultured in the iGB culture system and transduced with MSCV retrovirus. After transduction, the cells were cultured on fresh feeder cells in the presence of IL-21 and puromycin. (A) Representative flow cytometry plots showing the frequency TNFα production by transduced iGB cells after 3 d of puromycin selection. (B) IL-6 KO efficiency was tested by measuring IL-6 levels in the culture supernatants on day 3 or 4 after transduction. Data are shown from one representative experiment out of three independent experiments. (C) Experimental outline for adoptive transfer. R26-Cas9 × IgHMOG B cells iGB cells were transduced of day 2 of culture, and the cells were then enriched by puromycin selection in the presence of IL-4 for 3 d. Then, the cells were loaded with MOG protein and injected together with unmanipulated 2D2 CD4+ T cells into Rag1-KO mice. (D) EAE incidence is shown for 6 to 8 mice per group pooled from 2 independent experiments. (E) Cytokine production by CD4+ T cells in the CNS of iGB recipients analyzed at the peak of the disease. Horizontal lines indicate means. Dots represent individual mice. (F and G) Representative flow cytometry plots and (H and I) quantification of TNFα and IL-6 production by iGB cells recovered from the spleens of sick recipients at the peak of the disease. Horizontal lines indicate means. Dots represent individual mice. **P < 0.01 and ****P < 0.0001, one-way ANOVA with Tukey post-test. NT CTRL, nontargeting control.

References

    1. Paul A., Comabella M., Gandhi R., Biomarkers in multiple sclerosis. Cold Spring Harb. Perspect. Med. 9, a029058 (2019). - PMC - PubMed
    1. Magliozzi R., et al. , Meningeal B-cell follicles in secondary progressive multiple sclerosis associate with early onset of disease and severe cortical pathology. Brain. 130, 1089–1104 (2007). - PubMed
    1. Serafini B., Rosicarelli B., Magliozzi R., Stigliano E., Aloisi F., Detection of ectopic B-cell follicles with germinal centers in the meninges of patients with secondary progressive multiple sclerosis. Brain Pathol. 14, 164–174 (2004). - PMC - PubMed
    1. Peters A., et al. , Th17 cells induce ectopic lymphoid follicles in central nervous system tissue inflammation. Immunity 35, 986–996 (2011). - PMC - PubMed
    1. Mader S., Kümpfel T., Meinl E., Novel insights into pathophysiology and therapeutic possibilities reveal further differences between AQP4-IgG- and MOG-IgG-associated diseases. Curr. Opin. Neurol. 33, 362–371 (2020). - PubMed

Publication types