. 2024 Jan;625(7996):832-839.
doi: 10.1038/s41586-023-06832-9. Epub 2023 Nov 13.

Predicting multiple conformations via sequence clustering and AlphaFold2

Affiliations

Predicting multiple conformations via sequence clustering and AlphaFold2

Hannah K Wayment-Steele et al. Nature. 2024 Jan.

Abstract

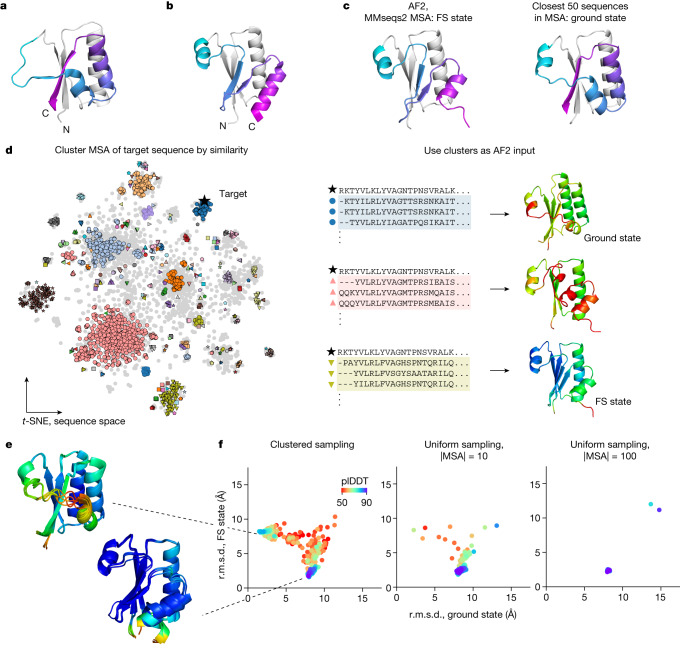
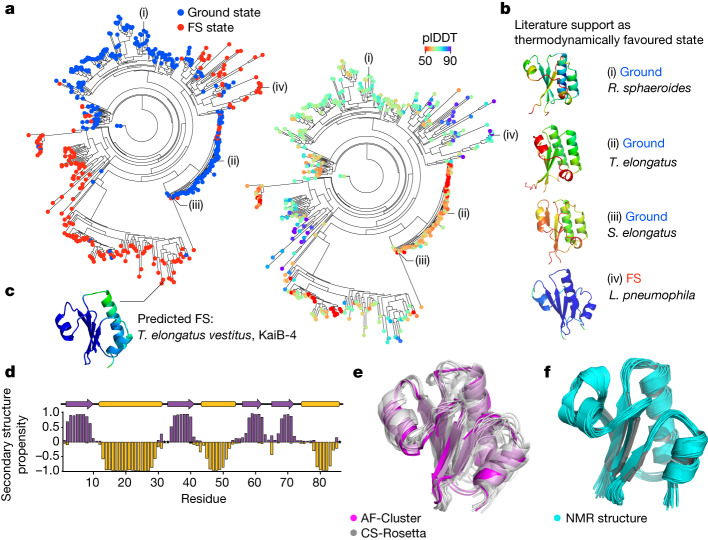
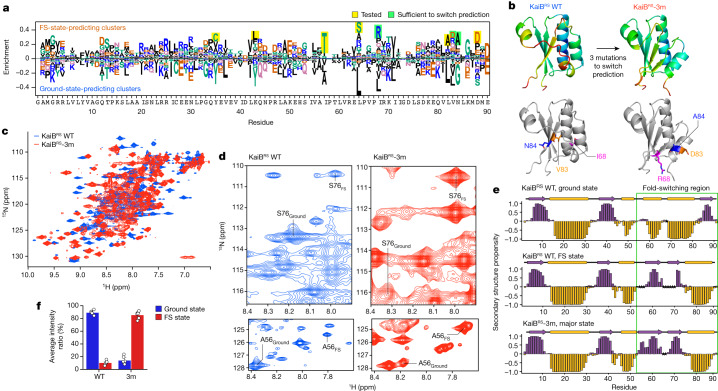
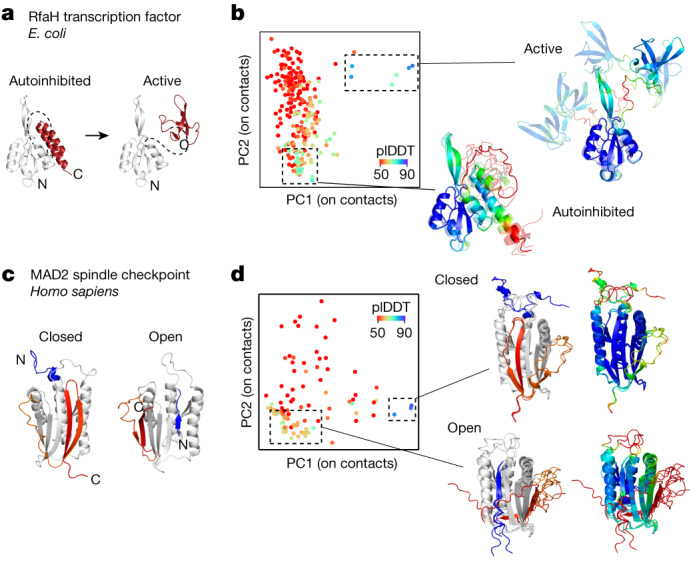
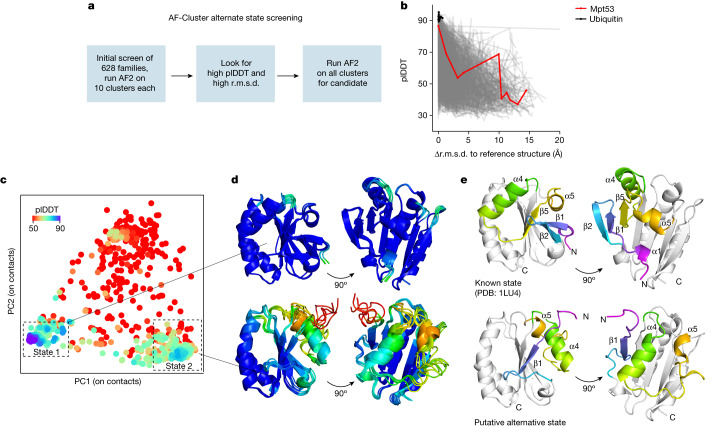
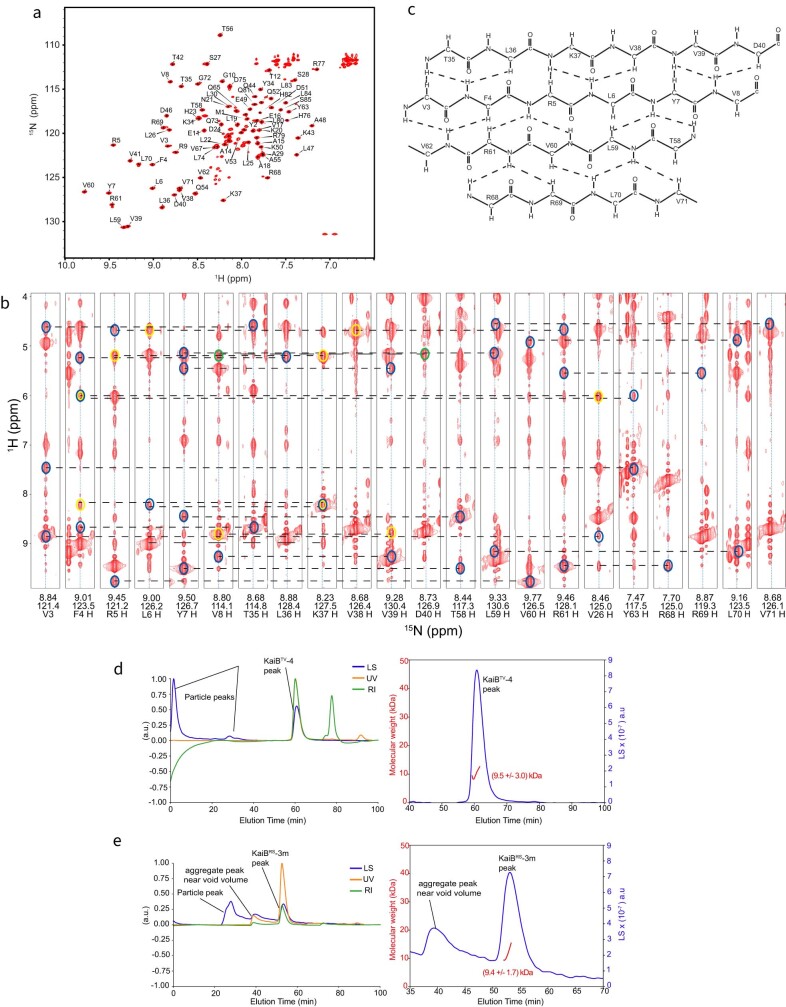
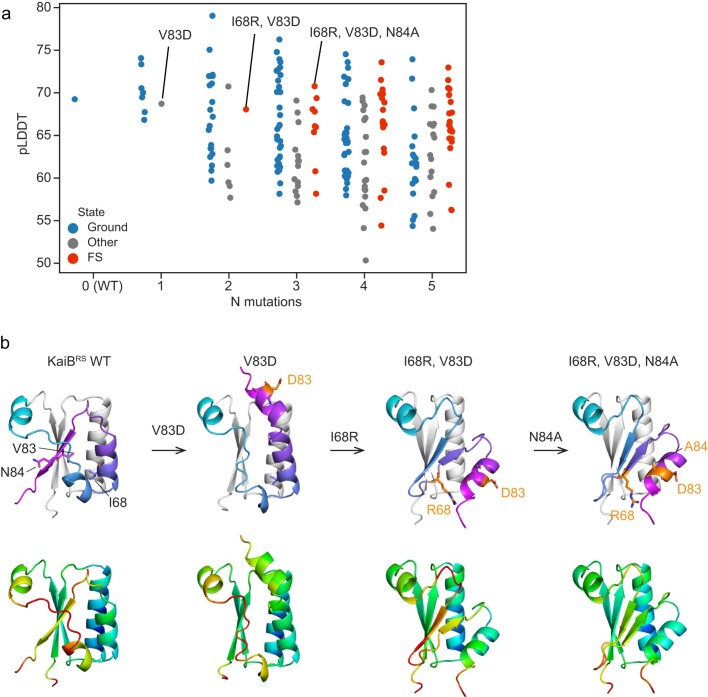
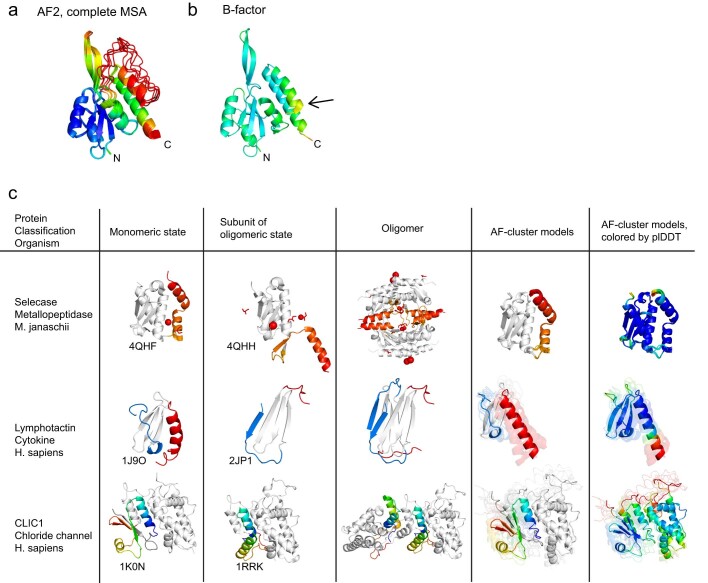
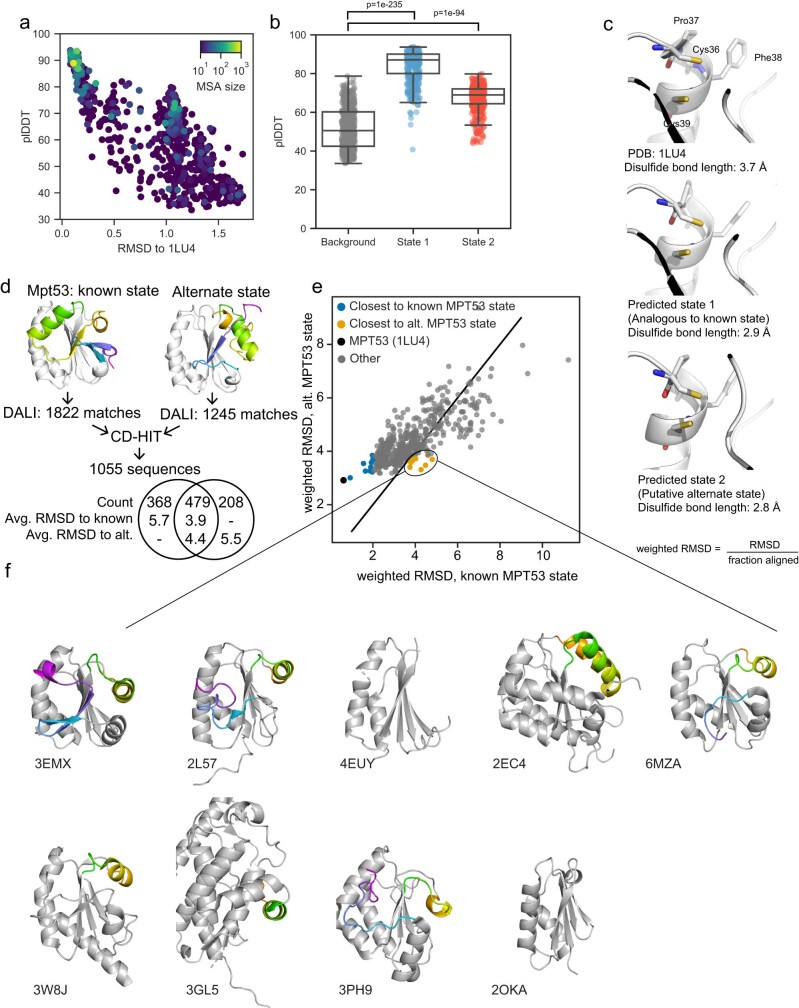
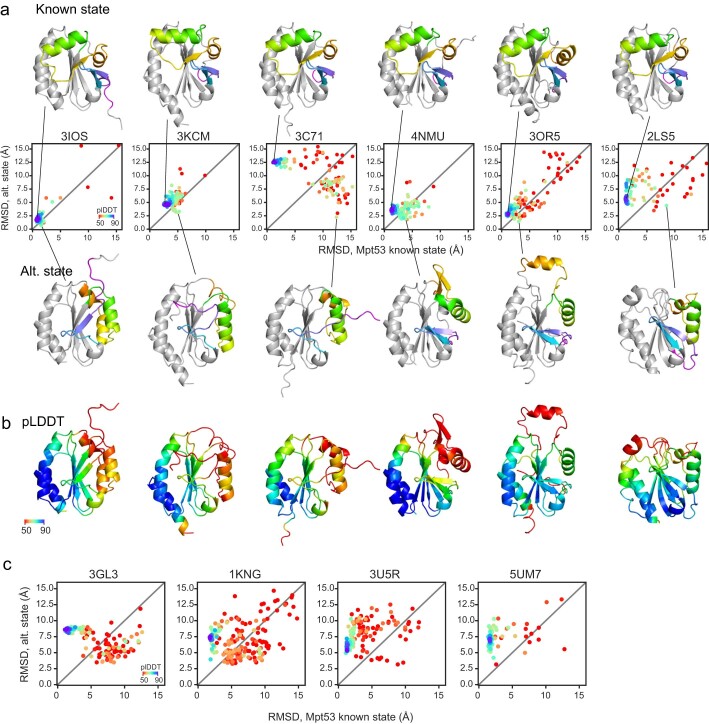
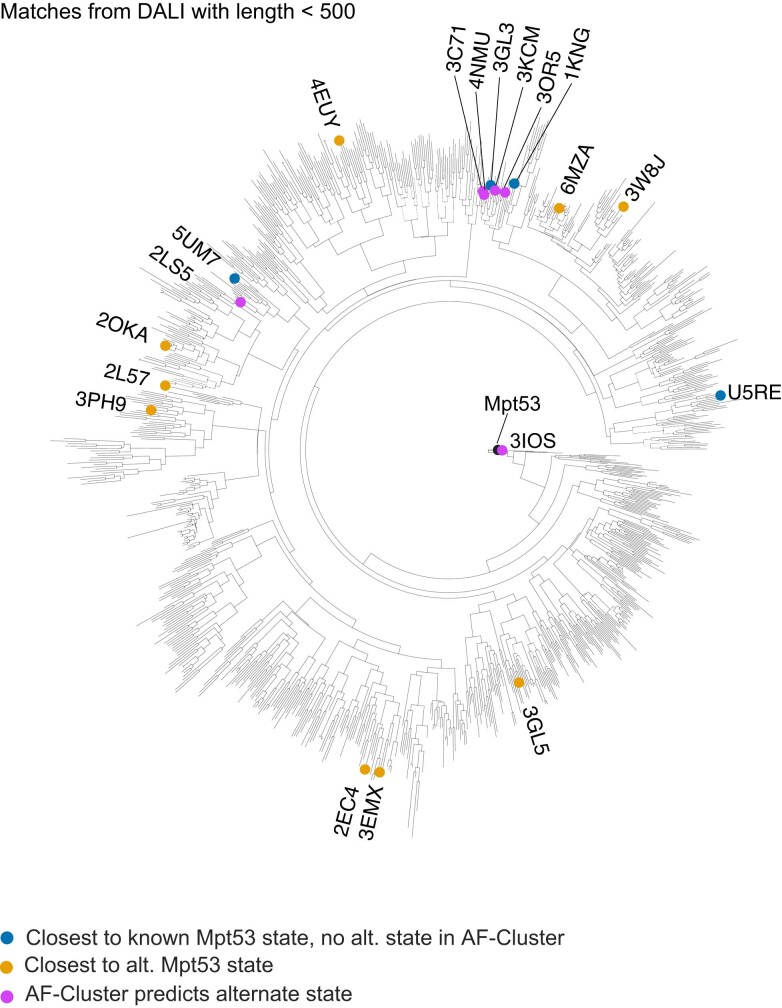
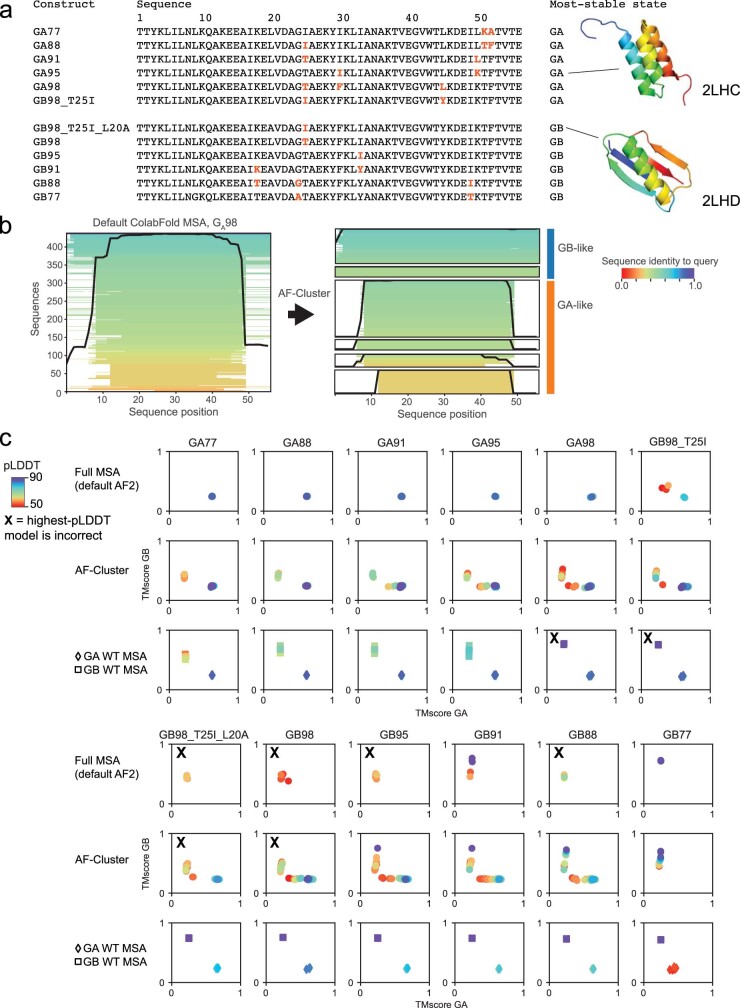
AlphaFold2 (ref. 1) has revolutionized structural biology by accurately predicting single structures of proteins. However, a protein's biological function often depends on multiple conformational substates2, and disease-causing point mutations often cause population changes within these substates3,4. We demonstrate that clustering a multiple-sequence alignment by sequence similarity enables AlphaFold2 to sample alternative states of known metamorphic proteins with high confidence. Using this method, named AF-Cluster, we investigated the evolutionary distribution of predicted structures for the metamorphic protein KaiB5 and found that predictions of both conformations were distributed in clusters across the KaiB family. We used nuclear magnetic resonance spectroscopy to confirm an AF-Cluster prediction: a cyanobacteria KaiB variant is stabilized in the opposite state compared with the more widely studied variant. To test AF-Cluster's sensitivity to point mutations, we designed and experimentally verified a set of three mutations predicted to flip KaiB from Rhodobacter sphaeroides from the ground to the fold-switched state. Finally, screening for alternative states in protein families without known fold switching identified a putative alternative state for the oxidoreductase Mpt53 in Mycobacterium tuberculosis. Further development of such bioinformatic methods in tandem with experiments will probably have a considerable impact on predicting protein energy landscapes, essential for illuminating biological function.


Conflict of interest statement

D.K. is a co-founder of Relay Therapeutics and MOMA Therapeutics. The other authors declare no competing interests.

Figures

Fig. 1
Fig. 1. AF2 predictions from MSA clusters for the fold-switching protein KaiB return both known structures.
a,b, Crystal structures of KaiB from T. elongatus (KaiBTE) in the ground state (PDB: 2QKE) (a) and the FS state (PDB: 5JYT) (b). c, The default ColabFold prediction of KaiBTE returns the FS state. Using only the closest 50 sequences by sequence distance returned from the MSA returns the ground state. For ac, the first 50 residues that are identical in both states are coloured grey and the fold-switching elements are coloured the same in both states. d, Overview of the AF-Cluster method. Left, MSA is clustered by sequence similarity. Sequence space is depicted using a t-distributed stochastic neighbour embedding (t-SNE) of the one-hot sequence encoding. Right, clusters are used as an input to AF2, resulting in a distribution of predicted structures, coloured by plDDT. e, The top five models for the ground and FS state, ranked by plDDT. f, The r.m.s.d. of AF2 structure predictions for all clusters relative to the ground and FS state. The highest-confidence regions of the AF-Cluster distribution for KaiBTE are within 3 Å r.m.s.d. of crystal structures of both the ground and FS state. By contrast, sampling the MSA uniformly returns only the FS state with high confidence.
Fig. 2
Fig. 2. The KaiB family contains pockets of sequences predicted to be stabilized for both states.
a, AF2 predictions for each variant in a phylogenetic tree using the ten closest sequences as the input MSA. Left, each node is coloured by predicted state (blue, ground state; red, FS state). Right, the same tree, coloured by plDDT. b, Three known fold-switching KaiB variants from R. sphaeroides (i), T. elongatus (ii) and S. elongatus (iii) are predicted in the ground state, and a variant from L. pneumonia (iv), crystallized in the FS state, is predicted in the FS state with a high plDDT. c, A KaiB copy present in T. elongatus vestitus, KaiBTV-4, is predicted to favour the FS state. df, Experimental testing of KaiBTV-4. d, The secondary structure propensity determined by NMR backbone chemical shifts, calculated using TALOS-N for KaiBTV-4, fully agrees with the FS state predicted by AF-Cluster. Unassigned amino acid residues are indicated by stars. e, Structure models calculated using CS-Rosetta, shown in grey, have 1.8 ± 0.3 Å r.m.s.d. to the AF-Cluster model (magenta). f, NMR structural models calculated from 3D 1H-15N- and 3D 1H-13C-edited NOESY spectra have an average pairwise r.m.s.d. of 0.7 Å, and 1.89 ± 0.13 Å r.m.s.d. to the AF-Cluster model. r.m.s.d. values in e and f were calculated over backbone atoms in secondary structure regions.
Fig. 3
Fig. 3. A designed minimal set of mutations switches the predominant fold of KaiBRS from the ground state to the FS state.
a, Sequence features enriched in clusters that predict the FS and ground state. b, Three mutations are sufficient to switch the structure prediction for KaiBRS in AF2 from the ground state to the FS state. Top, AF-Cluster models for KaiBRS and KaiBRS-3m, coloured by plDDT. Bottom, three mutation sites are highlighted. c, Overlaid 1H-15N HSQC spectra of KaiBRS (blue) and KaiBRS-3m (red). d, Examples of residues from well-resolved regions in the 1H-15N HSQC assigned in both states are shown for WT KaiBRS and KaiBRS-3m to illustrate the flip in populations through the three mutations. e, Chemical-shift-based secondary structure calculated using TALOS-N analysis of the ground and FS states of KaiBRS and the major state of KaiBRS-3m. Unassigned amino acid residues are indicated by stars. The green box indicates the fold-switching region. f, Average of the NMR peak intensity ratio of ground versus FS state for select residues that could be assigned in both states for both variants in well-resolved regions. The error bars represent the s.e.m. n = 5 residues.
Fig. 4
Fig. 4. AF-Cluster predicts fold switching for the proteins RfaH and MAD2.
a, Fold switching in the RfaH transcription factor in E. coli. In RfaH’s autoinhibited state, the CTD (red) forms an α-helix bundle (PDB: 5OND). In the active state, the CTD unbinds and forms a β-sheet that is homologous to the transcription factor NusG (CTD PDB: 2LCL). b, AF-Cluster returns structure models that include both the autoinhibited and the active state with high confidence. Note that the CTD orientation is not defined due to the flexible linker between the two domains. c, The closed state (PDB: 1S2H) and the open state (PDB: 1DUJ) of the MAD2 spindle checkpoint in humans with the fold-switching portions coloured. d, Both MAD2 states are predicted by AF-Cluster with high confidence.
Fig. 5
Fig. 5. Screening for fold switching in many protein families predicts a putative alternative fold for the M. tuberculosis secreted protein Mpt53.
a, Overview of the strategy for detecting novel predicted alternative folds. Screening of 628 families with more than 1,000 sequences in their MSA and residue length 48–150 from ref. . After clustering, we ran AF2 predictions using ten randomly selected clusters from each. b, Candidates for further sampling were selected by looking for outlier predictions with a high r.m.s.d. to the reference structure and high plDDT. c, Sampled models for candidate Mpt53, visualized using PCA of the closest heavy-atom contacts. Two states with a higher plDDT than the background were observed. d, The top five models by plDDT for the known state (top) and the putative alternative state (bottom), coloured by plDDT per residue. e, The crystal structure of the reduced state of M. tuberculosis Mpt53 (PDB: 1LU4), which corresponds to state 1 in the sampled landscape (top). In the putative alternative state 2, strand β1 replaces β5 in the five-strand β-sheet. Helix α4 shifts to the other side of the β-sheet and helix α5 is displaced.
Extended Data Fig. 1
Extended Data Fig. 1. Investigating two highly-similar sets of sequences in the KaiBTE MSA.
a) Sequences 1-50 predict the ground state in all 5 AF2 models, whereas sequences 50–100 predict the FS state in 4 of 5 models. Sequences are ranked by sequence similarity from the ColabFold MSA generation routine. b) MSA Transformer predicted contacts for both sets of sequences. c) Taking the difference of both contact maps highlights that sequences 50–100 contain features for the FS state corresponding to beta-strands (boxed in orange, magenta) and the helix-helix interaction (boxed in red). Right: Structure model (PDB: 5JYT) for the FS state of KaiBTE, features coloured analogously.
Extended Data Fig. 2
Extended Data Fig. 2. Empirically maximizing information content of clustering using DBSCAN.
a) Varying the parameter epsilon, which controls the maximum allowable distance for points to be in a cluster, results in a peak in the number of clusters DBSCAN identifies for a set of sequences. b) For epsilon <epsmax, fewer sequences are clustered, i.e. more are identified as outliers by the DBSCAN algorithm. For epsilon > epsmax, more sequences are clustered but fewer clusters are returned as more clusters are joined. c) Example clusterings of KaiB sequences at different epsilon values (compare to Fig. 1d). d) Corresponding KaiB landscape of predictions for these epsilon values. e) The plDDT values of models within 3 Å RMSD of the ground and FS state from the clustered sampling method are statistically significantly higher than the rest of the models. Box plots depict median and 25/75% interquartile range, whiskers = 1.5 *interquartile range. P-values for sample comparisons with p < 0.05 indicated, calculated via a two-sided test for the null hypothesis that 2 independent samples have identical mean values. n = 500 models for the two Uniform sampling methods, n = 230 for AF-Cluster sampling.
Extended Data Fig. 3
Extended Data Fig. 3. AF-Cluster sampling detects KaiBTE ground state in evolutionary couplings.
a) Contacts under 5 Å that correspond uniquely to the FS state (left) or ground state (right). Boxed features correspond to features unique to both states. b) AUC scores to both states of contact maps predicted by MSA transformer, a method trained by unsupervised learning. Randomly-subsampled MSAs have higher score to the FS state, and AF-Cluster contacts have higher score to ground state. c) Contact maps of sampled MSAs with the highest AUC to the ground state from (i) AF-Cluster and (ii) random sampling. The best-scoring random sample does not include the beta-strand unique to the ground state (boxed in blue in i). (iii) Contacts calculated from the whole MSA show features corresponding the FS state: beta-strands (orange, magenta) and the helix-helix interaction (red) boxed in (A). d) Contact map scores for both states correlate to the AF2 prediction RMSD for each state (Ground state: Spearman R = −0.32, p = 2e-09, FS state: Spearman R = −0.34, p = 4e-10 via a two-sided statistical test. No adjustment for multiple comparisons was made). Error bands for the linear trendline are 95% confidence intervals obtained via bootstrapping.
Extended Data Fig. 4
Extended Data Fig. 4. Supplemental experimental data for KaiBTV-4 and KaiBRS-3m.
a) 1H 15N HSQC spectra of KaiBTV-4 indicates one major folded state. Assignments are shown. b) Strip plot extracted from a 150 ms mixing time 15N-edited NOESY-HSQC spectrum of KaiBTV-4 illustrating the inter-strand NOEs between residues V3-V8; T35-D40; T58-Y63; R68-Y71, used in confirming KaiBTV-4 is in the fold-switched state. c) Summary of NOEs between the parallel β-sheets V3-V8 and T35-D40, and the antiparallel β-sheets T58-V62 and R68-V71. Confirmed NOEs are depicted by dashed lines. NOEs not depicted could not be confirmed unambiguously. SEC-MALS analysis of (d) KaiBTV-4 and (e) KaiBRS-3m at NMR concentration of 500 μM indicate both are monomeric. The profiles on the left show the full SEC-MALS run with the light scattering (LS) profile in blue, normalized UV profile in red, and refractive index (RI) profile in green. On the right is the region of the peak of interest showing the light scattering profile (blue) plotted against elution time, and the protein molar masses are indicated in red. The molar masses of KaiBTV−4 and KaiBRS-3m have been determined from light scattering and refractometry data to be (9.5 +/− 3.0) kDa and (9.4 +/− 1.7) kDa, respectively.
Extended Data Fig. 5
Extended Data Fig. 5. Three mutations are sufficient to switch KaiBRS AF2 prediction to high-confidence FS state prediction.
a) plDDT from AF2 (no MSA, 12 recycles, model 1) for all combinations of 8 possible point mutations most enriched from FS state analysis (cf. Fig. 3b). Quadruple-mutants and greater are not labelled by residue mutation, as we searched for the minimal set of mutations to flip the conformational equilibrium. b) Structure models of single mutant V83D, double mutant V83D-I68R, and triple mutant V83D-I68R-N84A demonstrating that V83D switches the C-terminal strand to a helix, and I68R switches the C-terminal helices to a strand. N84A increases the plDDT of the prediction of the FS state. Top row: structures coloured as in Fig. 1a. Bottom row: structures coloured by plDDT.
Extended Data Fig. 6
Extended Data Fig. 6. Results corresponding to testing AF-Cluster for other proteins.
a) Predicting the structure of RfaH in AF2 with the complete MSA from ColabFold returns the autoinhibited state with a mean plDDT of 68.6 (note low confidence in the first alpha-helix of the CTD.) b) B-factors of PDB 5OND, indicating that the last helical turn of the second to last helix has high B-factors (arrow). C) AF-Cluster only predicts the monomeric state for proteins that switch between monomeric and oligomeric states.
Extended Data Fig. 7
Extended Data Fig. 7. Investigating the source of the AF-Cluster prediction for an alternate state of Mpt53.
a) plDDT vs. RMSD for AF-Cluster sampling on oxidoreductase Mpt53. Each prediction coloured by MSA size. b) plDDT values for state 1, corresponding to the known thioredoxin-like state, and an alternate unknown state are significantly higher than background. Box plots depict median and 25/75% interquartile range, whiskers = 1.5 *interquartile range. P-values for sample comparisons with p < 0.05 indicated, calculated via a two-sided test for the null hypothesis that 2 independent samples have identical mean values. n = 1642 models total. c) The conserved CxxC active site is very similar between its conformation in the crystal structure and models for the putative alternate state. d) Workflow for using DALI to screen for structure homologues to both Mpt53’s original state and predicted alternate state to search for any similar structures in the PDB that might have been in AF2’s training set. e) Plotting RMSD normalized by alignment length to both structures reveals some structures with lower weighted RMSD to the alternate state than to the original state. f) 7 of 9 DALI hits with lower alternate state RMSD contained an alpha-helix positioned in similar same way as in the Mpt53 alternate state (coloured in green). One structure (3EMX) also contained an N-terminus beta-strand positioned similarly to the alternate state.
Extended Data Fig. 8
Extended Data Fig. 8. An analogous fold-switch state is predicted for some Mpt53 structure homologues.
6 of the 10 screened homologues from DALI with the lowest RMSD to the original state predicted an alternate state similar to that of Mpt53. a) Conformational landscapes, visualized by RMSD to two states of Mpt53, and showing the corresponding known structures (above) and predicted alternate structures (below), coloured analogously to Mpt53 (cf. Fig. 5e). b) Alternate structures in (a), coloured by plDDT. c) Conformational landscapes of 4 structure homologues with no evidence for predicted alternate state.
Extended Data Fig. 9
Extended Data Fig. 9. Phylogenetic tree of closest structure matches for Mpt53 states.
Homologues for Mpt53 original state and alternate state are dispersed across a calculated phylogenetic tree of the structure hits for both identified via DALI (cf. Extended Data Fig. 7).
Extended Data Fig. 10
Extended Data Fig. 10. MSA clusters enable correct predictions for engineered fold-switching point mutations in the protein GA/GB system.
A) Sequences of the 12 sets of GA/GB point mutations tested, from refs. Point mutations different from neighbouring sequences in the series are coloured in orange. Right: Representative NMR structures of the GA and GB fold. B) Left: Visualization of sequence identity and coverage of the MSA returned by ColabFold for GA98. Right: Visualization of MSA clusters with more than 10 sequences from the AF-Cluster clustering routine. C) We compared 3 types of MSAs for each point mutation: i) the full MSA returned by ColabFold, ii) MSA clusters returned by AF-Cluster, and iii) MSAs of the wild-type GA and GB proteins in ref. Predictions for which the highest plDDT is incorrect are marked with an X. AF-Cluster has a higher success rate and returns predictions with higher plDDT.

Comment in

  • Sequence clustering confounds AlphaFold2.
    Schafer JW, Lee M, Chakravarty D, Thole JF, Chen EA, Porter LL. Schafer JW, et al. Nature. 2025 Feb;638(8051):E8-E12. doi: 10.1038/s41586-024-08267-2. Epub 2025 Feb 19. Nature. 2025. PMID: 39972235 No abstract available.

References

    1. Jumper, J. et al. Highly accurate protein structure prediction with AlphaFold. Nature596, 583–589 (2021). - PMC - PubMed
    1. Henzler-Wildman, K. & Kern, D. Dynamic personalities of proteins. Nature450, 964–972 (2007). - PubMed
    1. Wang, Z. & Moult, J. SNPs, protein structure, and disease. Hum. Mutat.17, 263–270 (2001). - PubMed
    1. Stein, A., Fowler, D. M., Hartmann-Petersen, R. & Lindorff-Larsen, K. Biophysical and mechanistic models for disease-causing protein variants. Trends Biochem. Sci.44, 575–588 (2019). - PMC - PubMed
    1. Chang, Y. G. et al. Circadian rhythms. A protein fold switch joins the circadian oscillator to clock output in cyanobacteria. Science349, 324–328 (2015). - PMC - PubMed