. 2023 Dec 12;19(23):8987-8997.
doi: 10.1021/acs.jctc.3c01053. Epub 2023 Nov 13.

K-Means Clustering Coarse-Graining (KMC-CG): A Next Generation Methodology for Determining Optimal Coarse-Grained Mappings of Large Biomolecules

Affiliations

K-Means Clustering Coarse-Graining (KMC-CG): A Next Generation Methodology for Determining Optimal Coarse-Grained Mappings of Large Biomolecules

Jiangbo Wu et al. J Chem Theory Comput. .

Abstract

Coarse-grained (CG) molecular dynamics (MD) has become a method of choice for simulating various large scale biomolecular processes; therefore, the systematic definition of the CG mappings for biomolecules remains an important topic. Appropriate CG mappings can significantly enhance the representability of a CG model and improve its ability to capture critical features of large biomolecules. In this work, we present a systematic and more generalized method called K-means clustering coarse-graining (KMC-CG), which builds on the earlier approach of essential dynamics coarse-graining (ED-CG). KMC-CG removes the sequence-dependent constraints of ED-CG, allowing it to explore a more extensive space and thus enabling the discovery of more physically optimal CG mappings. Furthermore, the implementation of the K-means clustering algorithm can variationally optimize the CG mapping with efficiency and stability. This new method is tested in three cases: ATP-bound G-actin, the HIV-1 CA pentamer, and the Arp2/3 complex. In these examples, the CG models generated by KMC-CG are seen to better capture the structural, dynamic, and functional domains. KMC-CG therefore provides a robust and consistent approach to generating CG models of large biomolecules that can then be more accurately parametrized by either bottom-up or top-down CG force fields.


Conflict of interest statement

The authors declare no competing financial interest.

Figures
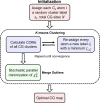
Figure 1
Figure 1
Numerical workflow of the KMC-CG method. The algorithm starts by defining the number of CG sites and assigning initial labels to each Cα atom. The K-means clustering algorithm is used to optimize χ2. Stochastic parallel minimization is then implemented to merge the outlier residues. Finally, the optimal CG mapping is obtained once the overall optimization reaches convergence.
Figure 2
Figure 2
Different 11-site CG mappings of ATP-bound G-actin. (a) The reference mapping from the literature is mapped onto the RMSF curve with colors corresponding to different CG sites. The x axis represents the index of Cα atoms, which it also does for panels b and c, and the y axis is the RMSF of each Cα atom. The four subdomains are noted as SD1, SD2, SD3, and SD4, respectively. The biologically functional domains are labeled by arrows. (b) The results of 200 independent replicas of the KMC-CG method. The y axis represents the replica index. Cα atoms with the same color belong to the same CG site. (c) The 11-site mapping obtained from the ED-CG method is mapped onto the RMSF curve, with each color corresponding to a different CG site. The y axis denotes the RMSF of each Cα atom.
Figure 3
Figure 3
Different 11-site CG models of ATP-bound G-actin. (a) The reference intuitive model from the literature, with the D-loop labeled in red. (b) The 11-site model from the KMC-CG method. (c) The 11-site model from the ED-CG method. In all three models, the four large domains and seven small subdomains are represented by four large CG beads and seven small CG beads, respectively. Each CG bead is located at the COM of its corresponding domain.
Figure 4
Figure 4
Different four-site CG models of ATP-bound G-actin. (a) The intuitive reference model from the literature: SD1 (1–32, 70–144, 338–375), SD2 (33–69), SD3 (145–180, 270–337), and SD4 (181–269). (b) The KMC-CG model: SD1 (1–34, 69–137, 339–375), SD2 (35–68), SD3 (138–183, 260–338), and SD4 (184–259). (c) The ED-CG model: SD1 (1–51), SD2 (52–192), SD3 (193–288), and SD4 (289–375). (d) The three models are mapped onto the RMSF curves with colors corresponding to the four subdomains in panels a, b, and c. The x axis represents the index of the Cα atoms, and the y axis is the RMSF of each Cα atom. Each CG bead is located at the COM of its corresponding domain in each model.
Figure 5
Figure 5
Two different twenty-site CG models of the HIV-1 CA pentamer. (a) The KMC-CG model (side view): SD1 (1–73, 127–146), SD2 (74–126), SD3 (147–225), SD4 (226–231). One monomer of the CA pentamer is colored green, orange, blue, and red, and the other four monomers are colored gray. (b) The ED-CG model (side view): SD1 (1–77), SD2 (78–126), SD3 (127–199), and SD4 (200–231). (c) The two models are mapped onto the RMSF curves with four colors corresponding to the different subdomains in panels a and b. The x axis is the index of Cα atoms, and the y axis represents the RMSF of each Cα atom. (d) The RMSF curves obtained from CG simulations of the KMC-CG model (red) and from the mapped all-atom trajectories (blue for the KMC-CG model and gray for the ED-CG model). The x axis represents the index of the CG sites with every four consecutive CG sites representing a monomer, and the y axis is the RMSF of each CG site. In both models, the CG beads are located at the COM of their corresponding domains. The RMSF curve of the mapped AA trajectory of the ED-CG model is included.
Figure 6
Figure 6
(a) The cryo-EM structure of the branch junction from Ding et al. The gray sections represent the mother filament (left) and daughter filament (right) of actin. The Arp2/3 complex is at the branch junction. Panels b and c are the KMC-CG models of the inactive and active Arp2/3 complexes, respectively. Different colors correspond to the seven subunits, and spheres of the same color represent the CG beads of that subunit. The ARPC1 insert region is colored by opaque green. Panels d and e are the RMSF curves obtained from CG simulations of the KMC-CG model (blue) and the mapped all-atom trajectory (red) for the inactive and active states, respectively. The x axis represents the index of the CG sites, and the y axis represents the RMSF of each CG site. The seven subunits are Arp3 (CG sites 1–11 and 35 for the nucleotide), Arp2 (12–22 and 36 for the nucleotide), ARPC1 (23–26), ARPC2 (27–28), ARPC3 (29–30), ARPC4 (31–32), and ARPC5 (33–34). In each model, each CG site is the COM of its corresponding domain.
Figure 7
Figure 7
Comparison of the fluctuation residuals χ02 (eq 2) obtained by KMC-CG and ED-CG. The x axis represents the number of CG sites used for the CG model of G-ATP, and the y axis shows the corresponding fluctuation residuals. The results indicate that when N ≤ 18, the χ02 of KMC-CG is significantly smaller than that of ED-CG. When N ≥ 19, the χ02 of ED-CG becomes slightly smaller than that of KMC-CG.

References

    1. Adcock S. A.; McCammon J. A. Molecular Dynamics: Survey of Methods for Simulating the Activity of Proteins. Chem. Rev. 2006, 106, 1589–1615. 10.1021/cr040426m. - DOI - PMC - PubMed
    1. Karplus M.; McCammon J. A. Molecular Dynamics Simulations of Biomolecules. Nat. Struct. Biol. 2002, 9, 646–652. 10.1038/nsb0902-646. - DOI - PubMed
    1. Pollard T. D.; Cooper J. A. Actin, a Central Player in Cell Shape and Movement. Science 2009, 326, 1208–1212. 10.1126/science.1175862. - DOI - PMC - PubMed
    1. Gupta M.; Pak A. J.; Voth G. A. Critical Mechanistic Features of HIV-1 Viral Capsid Assembly. Sci. Adv. 2023, 9, eadd743410.1126/sciadv.add7434. - DOI - PMC - PubMed
    1. Ganser-Pornillos B. K.; Yeager M.; Sundquist W. I. The Structural Biology of HIV Assembly. Curr. Opin. Struct. Biol. 2008, 18, 203–217. 10.1016/j.sbi.2008.02.001. - DOI - PMC - PubMed

LinkOut - more resources