. 2023 Nov 13;14(11):738.
doi: 10.1038/s41419-023-06263-4.

Exosome-targeted delivery of METTL14 regulates NFATc1 m6A methylation levels to correct osteoclast-induced bone resorption

Affiliations

Exosome-targeted delivery of METTL14 regulates NFATc1 m6A methylation levels to correct osteoclast-induced bone resorption

Jin-Gang Yang et al. Cell Death Dis. .

Abstract

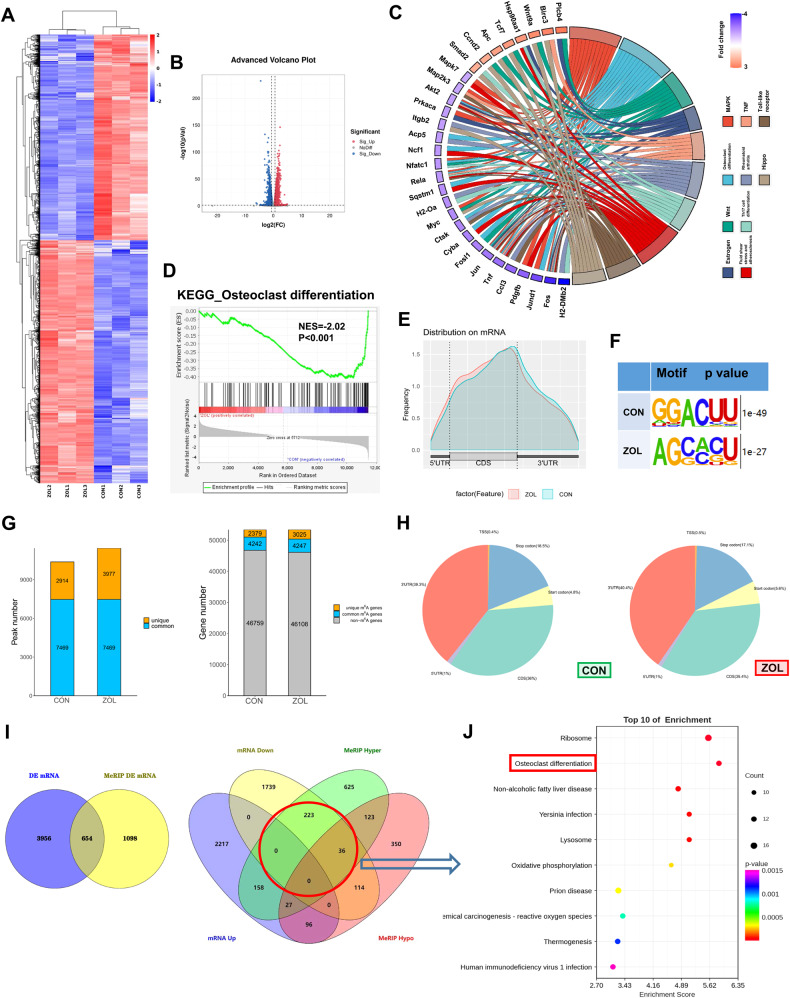
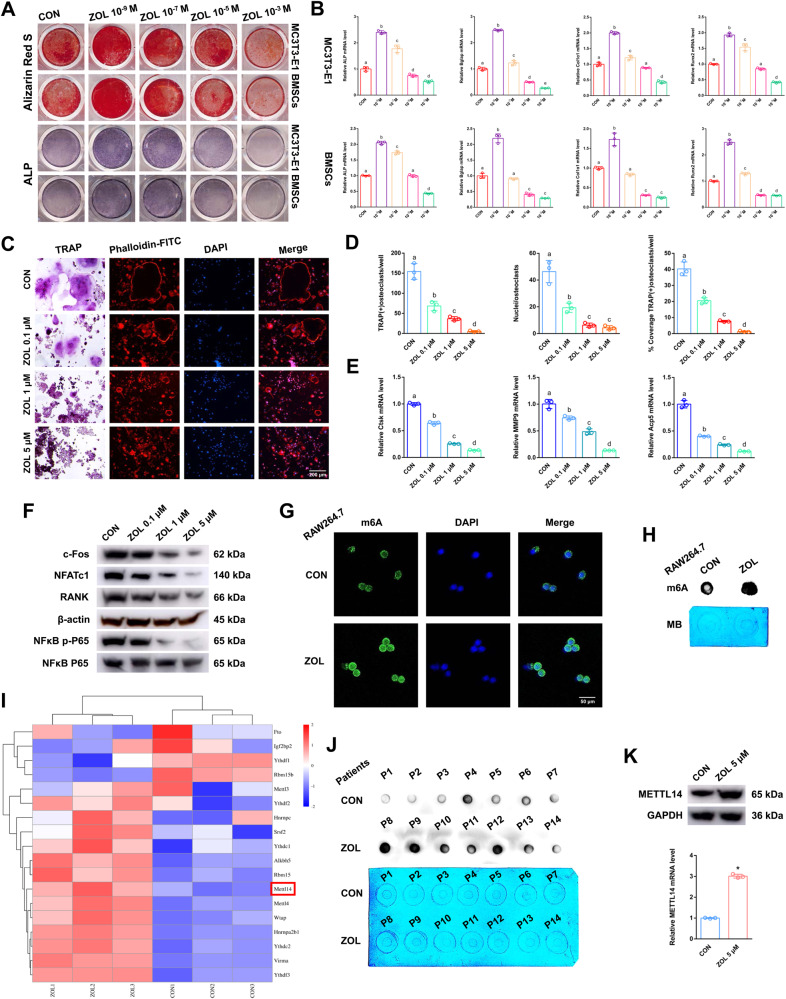
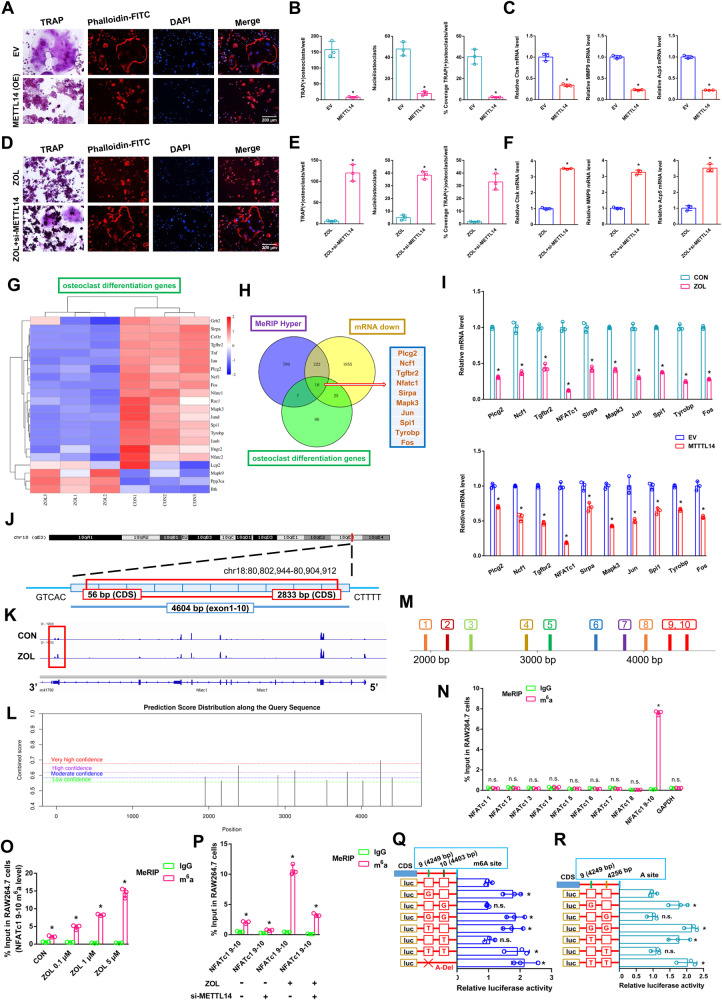
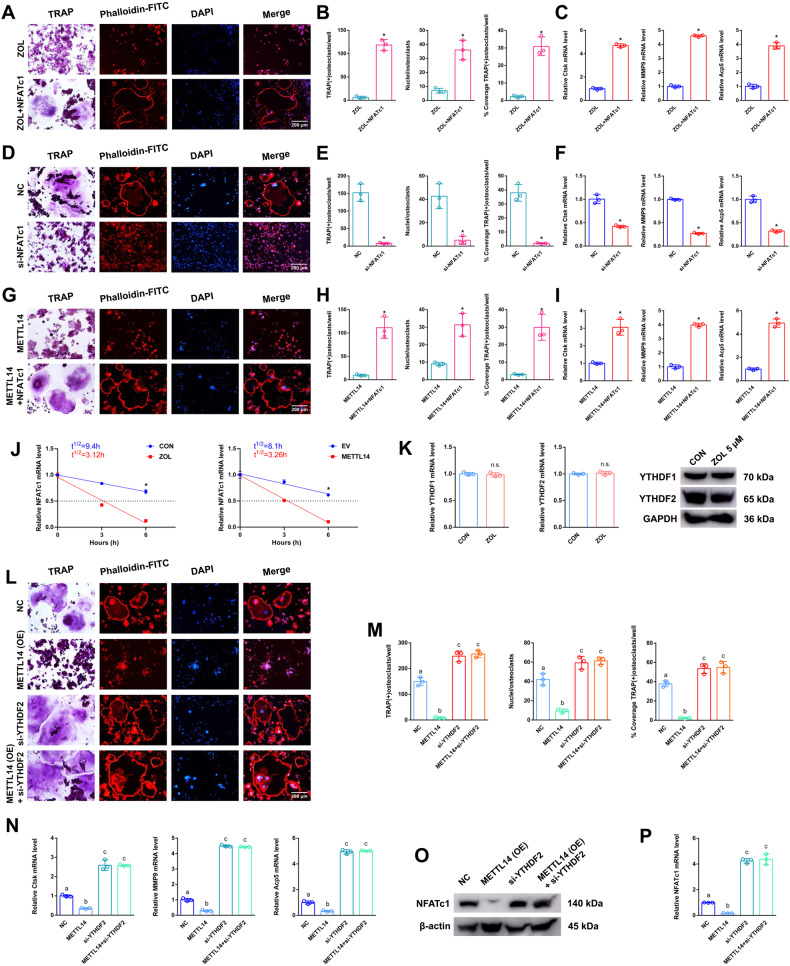
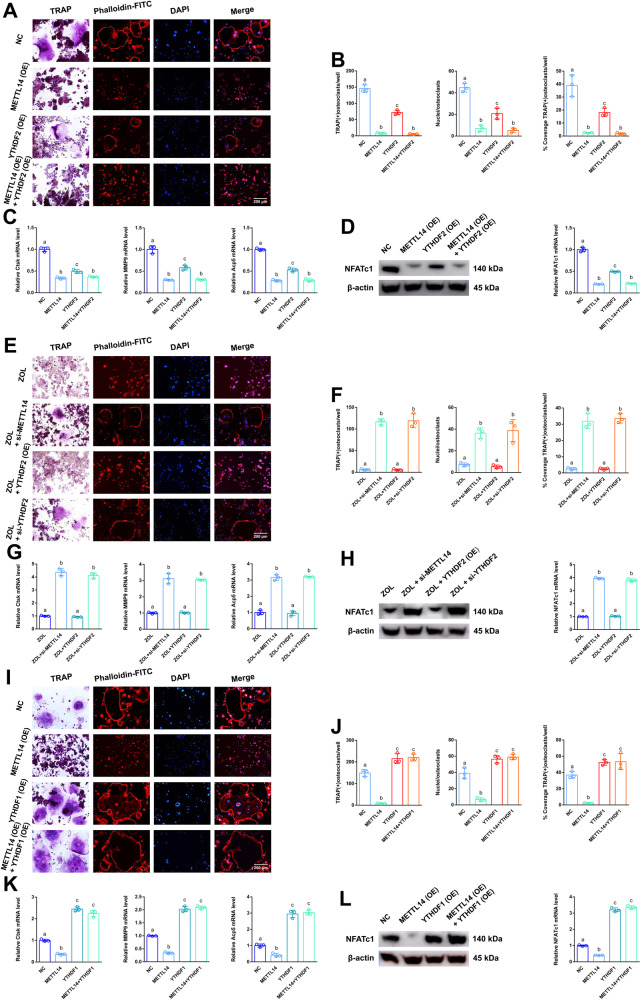
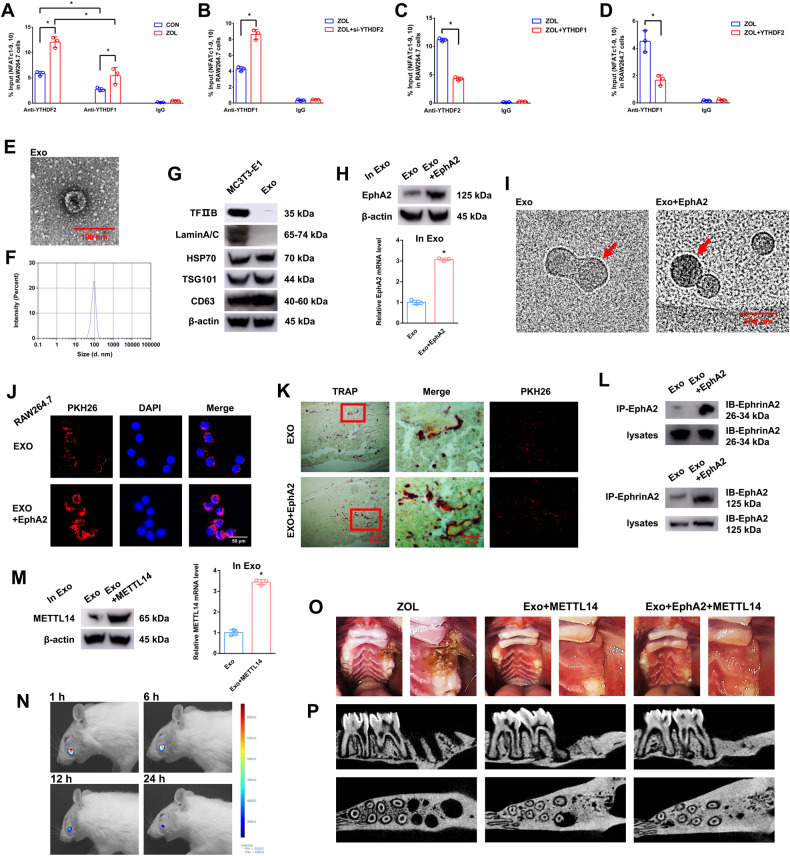
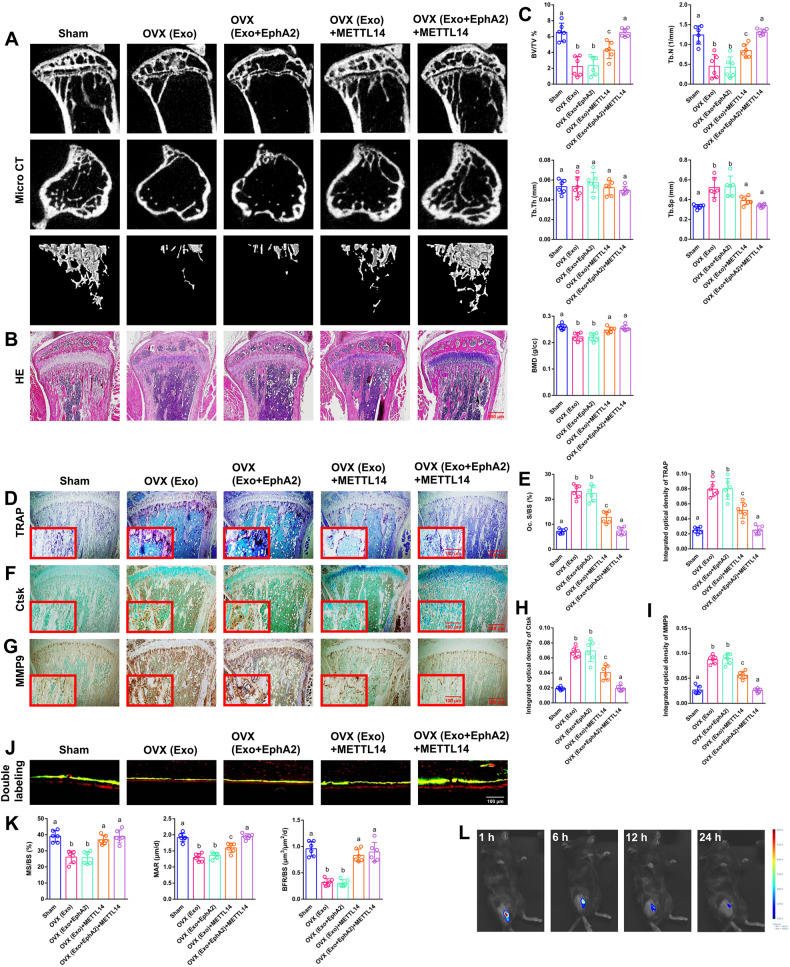
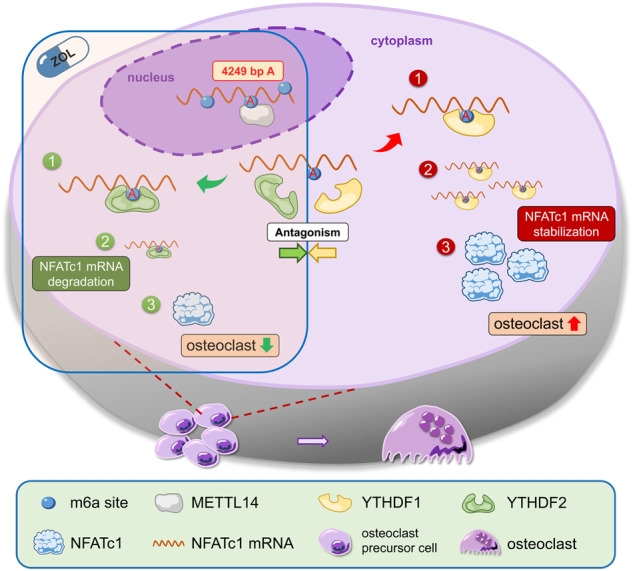
Osteoporosis has a profound influence on public health. First-line bisphosphonates often cause osteonecrosis of the jaw meanwhile inhibiting osteoclasts. Therefore, it is important to develop effective treatments. The results of this study showed that the increased level of NFATc1 m6A methylation caused by zoledronic acid (ZOL), with 4249A as the functional site, is highly correlated with the decreased bone resorption of osteoclasts. Upstream, METTL14 regulates osteoclast bone absorption through the methylation functional site of NFATc1. Downstream, YTHDF1 and YTHDF2 show antagonistic effects on the post-transcriptional regulation of NFATc1 after the m6A methylation level is elevated by METTL14. In this study, meRIP-Seq, luciferase reporter assays, meRIP and other methods were used to elucidate the NFATc1 regulatory mechanism of osteoclasts from the perspective of RNA methylation. In addition, EphA2 overexpression on exosomes is an effective biological method for targeted delivery of METTL14 into osteoclasts. Importantly, this study shows that METTL14 released by exosomes can increase the m6A methylation level of NFATc1 to inhibit osteoclasts, help postmenopausal osteoporosis patients preserve bone mass, and avoid triggering osteonecrosis of the jaw, thus becoming a new bioactive molecule for the treatment of osteoporosis.


Conflict of interest statement

The authors declare no competing interests.

Figures

Fig. 1
Fig. 1. High-throughput sequencing and differentially expressed genes.
RAW264.7 cells were separately collected with or without ZOL (5 μM) stimulation after RANKL induction. Total RNA extracted from the abovementioned two groups was subjected to RNA-seq and m6A-seq. A, B Heatmap and volcano plot showing differentially expressed mRNAs between the CON and ZOL groups. C The KEGG terms were visualised in a chord plot. D Gene set enrichment analysis (GSEA) plot evaluating the alterations in the osteoclast differentiation process using RNA sequence data. E The profiles of m6A enrichment across the mRNA transcriptome in both groups. F Predominant consensus motifs identified m6A-seq peaks in both groups. G Number of m6A peaks and m6A-modified genes identified in m6A-seq between the CON and ZOL groups. H Graphs of the m6A peak distribution showing the proportion of total m6A peaks in both groups. I Venn diagrams showing 654 intersecting genes with differential expression and differential m6A-methylation in both groups (left). The differentially expressed genes were classified according to the level of mRNA and m6A methylation (right). J A bubble chart showing the enrichment of the biological process of interest using the differentially expressed genes obtained by intersecting genes (in the red circle of Fig. 1I).
Fig. 2
Fig. 2. The effects of ZOL on both osteoblasts and osteoclasts.
A After addition of different concentrations of ZOL, Alizarin Red S or ALP staining was applied to MC3T3-E1 cells and BMSCs after 21 days or 7 days of osteogenic induction. B Relative expression levels of ALP, Bglap, Col1α1 and Runx2 in MC3T3-E1 cells and BMSCs at different concentrations of ZOL. C TRAP staining and F-actin band staining were applied to detect osteoclast differentiation and bone resorption ability at different concentrations of ZOL. Scale bar: 200 μm. D Histograms of the number, coverage rate and nuclei of TRAP-positive osteoclasts at different concentrations of ZOL. E Relative expression levels of Ctsk, MMP9 and Acp5 in RAW264.7 cells at different concentrations of ZOL. F Protein levels of c-fos, NFATc1, RANK and NFκB p-P65 in RAW264.7 cell lysates at different concentrations of ZOL were analysed by western blots. G, H Immunofluorescence images and m6A dot blot assay showing the global m6A levels of RAW264.7 cells after ZOL stimulation. Scale bar: 50 μm. I Heatmap showing the differentially expressed m6A methylation related enzymes after ZOL stimulation. J m6A dot blot assay showing the global m6A levels of postmenopausal women with or without bisphosphonate treatment. K After ZOL stimulation, the mRNA and protein expression levels of METTL14 in RAW264.7 cells were detected by RT-qPCR and western blotting, respectively. Data are representative of three independent experiments expressed as the mean ± SD (*p < 0.05). Different letters (a, b, c, d and e) indicate significant differences among multiple groups (p < 0.05).
Fig. 3
Fig. 3. The effects of the NFATc1–9 segment on the process by which METT14 regulates osteoclast differentiation.
First, METTL14 was transfected into RAW264.7 cells and prepared for further study. A TRAP staining and F-actin band staining were applied to detect osteoclast differentiation between the two groups. Scale bar: 200 μm. B Histograms of the number, coverage rate and nuclei of TRAP-positive osteoclasts between the two groups. C Relative expression levels of Ctsk, MMP9 and Acp5 in RAW264.7 cells between the two groups. After ZOL stimulation, si-METTL14 was transfected into RAW264.7 cells and prepared for further study. D TRAP staining and F-actin band staining were applied to detect osteoclast differentiation between the two groups. Scale bar: 200 μm. E Histograms of the number, coverage rate and nuclei of TRAP-positive osteoclasts between the two groups. F Relative expression levels of Ctsk, MMP9 and Acp5 in RAW264.7 cells between the two groups. G Heatmap showing the differentially expressed genes of osteoclast differentiation after ZOL stimulation. H KEGG analysis revealing the differentially expressed genes from three intersections: osteoclast differentiation genes, MeRIP hyper genes and mRNA down genes. I RT-qPCR analysis revealing the expression levels of 10 differentially expressed genes after ZOL stimulation or METTL14 overexpression. J Schematic diagram showing the genomic location of NFATc1. K m6A peak visualisation of meRIP-Seq in NFATc1 transcripts with or without ZOL stimulation. The m6A peaks are in the 3’UTRs of NFATc1. L The potential m6A methylation loci of NFATc1 on the SRAMP website. M We divided 9 segments of NFATc1 according to the potential m6A methylation loci. N m6A-RT-qPCR assay was performed to detect the enrichment of 9 segments of NFATc1 between the anti-m6A group and anti-IgG group after ZOL stimulation. O An m6A-RT-qPCR assay was performed to detect the enrichment of the NFATc1–9, 10 segment as the ZOL concentration increased. P An m6A-RT-qPCR assay was performed to detect the enrichment of the NFATc1–9, 10 segment under ZOL or si-METTL14 stimulation. Q, R Two m6A modification sites were validated through step-by-step mutation of luciferase reporters. Data are representative of three independent experiments expressed as the mean ± SD (*p < 0.05).
Fig. 4
Fig. 4. The effects of METTL14 on the post-transcriptional regulation of NFATc1.
After ZOL stimulation, NFATc1 was transfected into RAW264.7 cells and prepared for further study. A TRAP staining and F-actin band staining were applied to detect osteoclast differentiation between the two groups. Scale bar: 200 μm. B Histograms of the number, coverage rate and nuclei of TRAP-positive osteoclasts between the two groups. C Relative expression levels of Ctsk, MMP9 and Acp5 in RAW264.7 cells between the two groups. Next, si-NFATc1 was transfected into RAW264.7 cells and prepared for further study. D TRAP staining and F-actin band staining were applied to detect osteoclast differentiation between the two groups. Scale bar: 200 μm. E Histograms of the number, coverage rate and nuclei of TRAP-positive osteoclasts between the two groups. F Relative expression levels of Ctsk, MMP9 and Acp5 in RAW264.7 cells between the two groups. Next, NFATc1 or METTL14 was transfected into RAW264.7 cells separately or simultaneously according to the different groups and prepared for further study. G TRAP staining and F-actin band staining were applied to detect osteoclast differentiation between the two groups. Scale bar: 200 μm. H Histograms of the number, coverage rate and nuclei of TRAP-positive osteoclasts between the two groups. I Relative expression levels of Ctsk, MMP9 and Acp5 in RAW264.7 cells between the two groups. J Under ZOL or METTL14 stimulation, the NFATc1 mRNA half-life was estimated according to linear regression analysis. K After ZOL stimulation, the mRNA and protein expression levels of YTHDF1 and YTHDF2 in RAW264.7 cells were detected by RT-qPCR and western blotting, respectively. Next, si-YTHDF2 or METTL14 was transfected into RAW264.7 cells separately or simultaneously according to the different groups and prepared for further study. L TRAP staining and F-actin band staining were applied to detect osteoclast differentiation among the four groups. Scale bar: 200 μm. M Histograms of the number, coverage rate and nuclei of TRAP-positive osteoclasts among the four groups. N Relative expression levels of Ctsk, MMP9 and Acp5 in RAW264.7 cells among the four groups. O, P The mRNA and protein expression levels of NFATc1 in RAW264.7 cells among the four groups were analysed by RT-qPCR and western blotting, respectively. Data are representative of three independent experiments expressed as the mean ± SD (*p < 0.05). Different letters (a, b, c, d and e) indicate significant differences among multiple groups (p < 0.05).
Fig. 5
Fig. 5. The effects of YTHDF1 and YTHDF2 on the post-transcriptional regulation of NFATc1.
YTHDF2 or METTL14 was transfected into RAW264.7 cells separately or simultaneously according to the different groups and prepared for further study. A TRAP staining and F-actin band staining were applied to detect osteoclast differentiation among the four groups. Scale bar: 200 μm. B Histograms of the number, coverage rate and nuclei of TRAP-positive osteoclasts among the four groups. C Relative expression levels of Ctsk, MMP9 and Acp5 in RAW264.7 cells among the four groups. D The mRNA and protein expression levels of NFATc1 in RAW264.7 cells among the four groups were analysed by RT-qPCR and western blotting, respectively. After ZOL stimulation, YTHDF2, si-YTHDF2 or si-METTL14 was transfected into RAW264.7 cells separately according to the different groups and prepared for further study. E TRAP staining and F-actin band staining were applied to detect osteoclast differentiation among the four groups. Scale bar: 200 μm. F Histograms of the number, coverage rate and nuclei of TRAP-positive osteoclasts among the four groups. G Relative expression levels of Ctsk, MMP9 and Acp5 in RAW264.7 cells among the four groups. H The mRNA and protein expression levels of NFATc1 in RAW264.7 cells among the four groups were analysed by RT-qPCR and western blotting, respectively. Next, YTHDF1 or METTL14 was transfected into RAW264.7 cells separately or simultaneously according to the different groups and prepared for further study. I TRAP staining and F-actin band staining were applied to detect osteoclast differentiation among the four groups. Scale bar: 200 μm. J Histograms of the number, coverage rate and nuclei of TRAP-positive osteoclasts among the four groups. K Relative expression levels of Ctsk, MMP9 and Acp5 in RAW264.7 cells among the four groups. L The mRNA and protein expression levels of NFATc1 in RAW264.7 cells among the four groups were analysed by RT-qPCR and western blotting, respectively. Data are representative of three independent experiments expressed as the mean ± SD. Different letters (a and b) indicate significant differences among multiple groups (p < 0.05).
Fig. 6
Fig. 6. The effects of EphA2-EphrinA2 on osteoclasts receiving exosomes.
AD RIP assays were performed to detect the enrichment rate of the NFATc1–9, 10 segment under different conditions. E Electron microscopy images of exosomes. Scale bar: 100 nm. F Size distribution of exosomes secreted by MC3T3-1 cells. G Protein levels of TFIIB, Lamin A/C, HSP70, TSG101 and CD63 in MC3T3-E1 cell lysates or exosomes secreted by MC3T3-E1 cells analysed by western blotting. H After transfection of EphA2 into ME3T3-E1 cells, the mRNA and protein expression levels of EphA2 in exosomes were detected by RT-qPCR and western blotting, respectively. I Cryo-transmission electron microscopy images of exosomes. The red arrow indicates that the nanogold probe (1.4 nm) combined with the EphA2 receptor. Scale bar: 100 nm. J Immunofluorescence images of exosomes from MC3T3-E1 cells into RAW264.7 cells. Exosomes were labelled with PKH26 and overexpressed with or without EphA2. Scale bar: 50 nm. K Fluorescence microscopy and TRAP staining analysis revealing PKH26-labelled exosomes injected into bone marrow. Red boxes indicate that exosomes were absorbed by osteoclasts. Scale bars: 200 μm, 50 μm. L Coimmunoprecipitation (co-IP) analysis indicating the binding effects of EphA2-EphrinA2 and EphrinA2-EphA2. M After transfection of METTL14 into ME3T3-E1 cells, the mRNA and protein expression levels of METTL14 in exosomes were detected by RT-qPCR and western blotting, respectively. N Rat in vivo imaging analysis showed that exosome labelling with Cy5.5 was specifically located in the socket after the left maxillary first molar was removed. O After 8 weeks of tooth extraction, the representative pictures of rat bisphosphonate-related osteonecrosis of the jaw (BRONJ) and two exosome treatment groups (Exo+METTL14 and Exo+EphA2 + METTL14). P After 8 weeks of ZOL or exosome injection, micro-CT was applied to present the bone histological changes among the groups. Data are representative of three independent experiments expressed as the mean ± SD (*p < 0.05).
Fig. 7
Fig. 7. The effects of METTL14 in vivo.
EphA2 or METTL14 was transfected into MC3T3-E1 cells and collected from cell supernatant exosomes separately or simultaneously according to the different groups. A, B After 8 weeks of exosome injection, micro-CT and H&E staining were applied to measure the bone histological parameters. Scale bar: 500 nm. C Histograms of BV/TV, Tb.N, Tb.Th, Tb.Sp and BMD among the five groups. D TRAP staining was applied to evaluate osteoclast differentiation and bone resorption ability. Scale bars: 200 μm, 100 μm. E Histograms of osteoclast Oc. S/BS and integrated optical density of TRAP among the five groups. F, G Immunohistochemistry of Ctsk and MMP9 staining was applied to evaluate osteoclast differentiation and bone resorption ability. Scale bars: 200 μm, 100 μm. H, I Histograms of integrated optical density of Ctsk and MMP9 among the five groups. J, K Representative images of dynamic histomorphometry of cortical bone with quantification of MS/BS, MAR and BFR/BS. Scale bar: 100 μm. L Mouse in vivo imaging analysis showed that exosomes labelled with Cy5.5 were specifically located in the tibia bone marrow. Data are representative of six independent experiments expressed as the mean ± SD. Different letters (a, b and c) indicate significant differences among multiple groups (p < 0.05).
Fig. 8
Fig. 8. Schematic diagram of this study.
The increased level of NFATc1 m6A methylation caused by ZOL, in which 4249 A is the functional site, is highly correlated with the decreased function of bone resorption of osteoclasts. Upstream, METTL14 regulates osteoclast bone absorption through the methylation functional site of NFATc1. Downstream, YTHDF1 and YTHDF2 show competitive effects on the post-transcriptional regulation of NFATc1 after the m6A methylation level is elevated by METTL14.

References

    1. Maeda SS, Lazaretti-Castro M. An overview on the treatment of postmenopausal osteoporosis. Arq Bras Endocrinol Metab. 2014;58:162–71. doi: 10.1590/0004-2730000003039. - DOI - PubMed
    1. Schlaff WD. Introduction: an update on bone metabolism and osteoporosis. Fertil Steril. 2019;112:773–4. doi: 10.1016/j.fertnstert.2019.10.004. - DOI - PubMed
    1. Si L, Winzenberg TM, Jiang Q, Chen M, Palmer AJ. Projection of osteoporosis-related fractures and costs in China: 2010-2050. Osteoporos Int. 2015;26:1929–37. doi: 10.1007/s00198-015-3093-2. - DOI - PubMed
    1. van der Burgh AC, de Keyser CE, Zillikens MC, Stricker BH. The effects of osteoporotic and non-osteoporotic medications on fracture risk and bone mineral density. Drugs. 2021;81:1831–58. doi: 10.1007/s40265-021-01625-8. - DOI - PMC - PubMed
    1. Zhu X, Bai W, Zheng H. Twelve years of GWAS discoveries for osteoporosis and related traits: advances, challenges and applications. Bone Res. 2021;9:23. doi: 10.1038/s41413-021-00143-3. - DOI - PMC - PubMed

Publication types