. 2023 Nov 13;14(1):7295.
doi: 10.1038/s41467-023-42876-1.

Knockout or inhibition of USP30 protects dopaminergic neurons in a Parkinson's disease mouse model

Affiliations

Knockout or inhibition of USP30 protects dopaminergic neurons in a Parkinson's disease mouse model

Tracy-Shi Zhang Fang et al. Nat Commun. .

Abstract

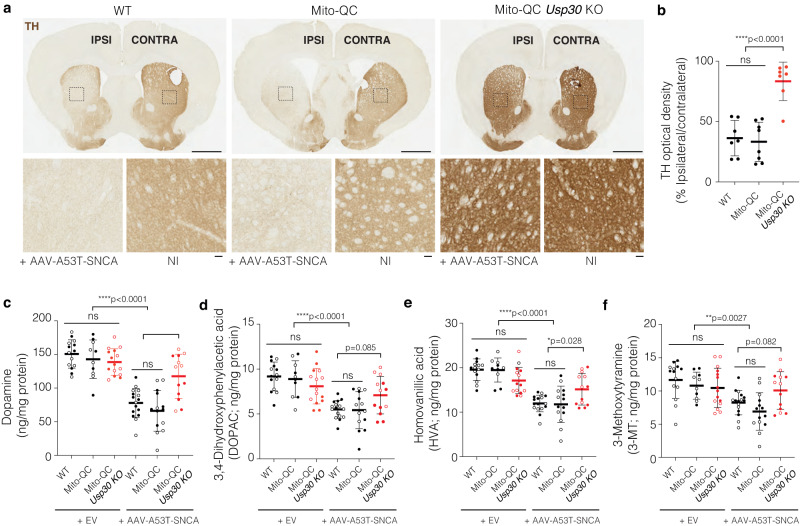
Mutations in SNCA, the gene encoding α-synuclein (αSyn), cause familial Parkinson's disease (PD) and aberrant αSyn is a key pathological hallmark of idiopathic PD. This α-synucleinopathy leads to mitochondrial dysfunction, which may drive dopaminergic neurodegeneration. PARKIN and PINK1, mutated in autosomal recessive PD, regulate the preferential autophagic clearance of dysfunctional mitochondria ("mitophagy") by inducing ubiquitylation of mitochondrial proteins, a process counteracted by deubiquitylation via USP30. Here we show that loss of USP30 in Usp30 knockout mice protects against behavioral deficits and leads to increased mitophagy, decreased phospho-S129 αSyn, and attenuation of SN dopaminergic neuronal loss induced by αSyn. These observations were recapitulated with a potent, selective, brain-penetrant USP30 inhibitor, MTX115325, with good drug-like properties. These data strongly support further study of USP30 inhibition as a potential disease-modifying therapy for PD.


Conflict of interest statement

A.C.P., M.K., C.A.L., R.W., R.M., S.A., L.B. and N.M. and P.T. are employees of, or former employees of, Mission therapeutics. S.J. is a founder, shareholder and board member of Mission Therapeutics. All other authors declare no competing interests.

Figures

Fig. 1
Fig. 1. Generation and characterization of Usp30 KO mice.
a Schematic of gene targeting to generate the Usp30 KO mice. b Bar graph shows the levels of Usp30 gene expression in different tissues in Usp30 WT and KO mice (n = 5 for brain, n = 4 for testis, n = 3 for all other tissues). Error bars represent mean ± s.d. c Representative Western Blot images of OPA1, beta-actin and USP30 in the cortex of Usp30 WT and KO male mice. The experiment was repeated twice independently. d Estimated and observed numbers of WT, Usp30 heterozygous (Het) and Usp30 homozygous knockout (KO) mice in the offspring of heterozygous Usp30 breeders. e Survival curve of WT and Usp30 KO mice. f schematic image showing the working mechanism of mito-QC reporter protein for assessing the mitophagy signal in cells. g Representative fluorescence images show the mito-QC fluorescence signal (mCherry-red, GFP-green), and dopaminergic neurons (TH, blue) in the SNpc of mito-QC and mito-QC/Usp30 KO male mice. Dashed white inlets were enlarged in right panels showing the details of mCherry only puncta (mitophagy puncta) in the DA neurons. Scale bar, 10 µm. h Quantification of mitophagy puncta in individual dopaminergic neurons of the SNpc (n = 13 for USP WT male mice, n = 14 for Usp30 KO male mice, 5–10 neurons per mouse). WT and Usp30 KO in the bar graph represent mito-QC and mito-QC/Usp30 KO, respectively. Significance determined by unpaired, two-tailed Student’s t test. Error bars represent mean ± s.d.; *P < 0.05. Acronyms: WT wild type, GT gene-trap, KO knock out, loxP locus of X-over P1 site, FRT flippase recognition target, SA splice acceptor, pA polyA tail, NEO neomycin resistance cassette, LacZ β-galactosidase. Source data are provided as a Source Data file.
Fig. 2
Fig. 2. Usp30 KO improved DN neuronal survival, decreased pathological αSyn and prevented motor deficits in an α-synuclein-induced PD mouse model.
a Representative SNpc sections of TH immunohistochemistry in different groups of male mice at 28 weeks post-injection of AAV-A53T-SNCA. Inset of left panels is enlarged to right panels. Scale bar, 1 mm for left panels, 100 µm for right panels. b Graph shows the percentages of TH-positive neurons in ipsilateral compared to contralateral SNpc of the same male mouse in each group (n = 7 for WT group, n  = 8 for mito-QC group, n = 7 for mito-QC/Usp30 KO group). Significance determined by one-way ANOVA. Error bars represent mean ± s.d.; **P < 0.01. c Representative images SNpc of male mice at 28 weeks post-injection of AAV-A53T-SNCA. Inset is enlarged on the right. Scale bar, 1 mm for left panels, 100 µm for right panels. d Quantifications of average phospho-S129 α-synuclein fluorescence intensity in DA neurons of male mice in each group (n = 3 mice for empty-vector control groups; n = 7 mice for AAV-SNCA groups). Significance determined by ANOVA. Error bars represent mean ± s.d. ****P < 0.0001; ns, not significant e Percentage of contralateral forelimb use for rearing in the cylinder test of female (open dots) or male (closed dots) mice at 28 weeks post unilateral injection of AAV-Null or AAV-A53T-SNCA vectors (n = 29 for WT + EV, n = 21 for mito-QC + EV, n = 32 for mito-QC/Usp30 KO + EV, n = 30 for WT + SNCA, n = 28 for mito-QC + SNCA, n = 29 for mito-QC/Usp30 KO + SNCA). Significance determined by one-way ANOVA. Error bars represent mean ± s.d.; ****P < 0.0001; ns, not significant. Source data are provided as a Source Data file.
Fig. 3
Fig. 3. Usp30 KO prevents loss of striatal TH+ dopaminergic fibers and preserves dopamine and its metabolites in the α-synuclein-based mouse model.
a Representative striatal sections of TH immunohistochemistry in male mice at 28 weeks post-injection of AAV-A53T-SNCA.; enlarged in lower panels. Scale bar, 1 mm for upper panels, 100 µm for lower panels. b Relative optical density of TH+ fibers in the ipsilateral striatum compared with the contralateral side of male mice in each group (n = 7 for WT group, n = 8 for mito-QC group, n = 7 for mito-QC/Usp30 KO group). Significance determined by one-way ANOVA. Error bars represent mean ± s.d.; ****P < 0.0001. c Mean dopamine levels (ng/mg protein) in the ipsilateral striatum of female (open dots) and male (closed dots) mice in each group (n = 14 for WT + EV, n = 10 for mito-QC + EV, n = 15 for mito-QC/Usp30 KO + EV, n = 16 for WT + SNCA, n = 14 for mito-QC + SNCA, n = 13 for mito-QC/Usp30 KO + SNCA groups of mice). Significance determined by one-way ANOVA. Error bars represent mean ± s.d.; ***P < 0.001, ****P < 0.0001. d Mean of 3,4-Dihydroxyphenylacetic acid levels (DOPAC, ng/mg protein) in the ipsilateral striatum of female (open dots) and male (closed dots) mice in each group (n = 14 for WT + EV, n = 10 for mito-QC + EV, n = 15 for mito-QC/Usp30 KO + EV, n = 16 for WT + SNCA, n = 14 for mito-QC + SNCA, n = 13 for mito-QC/Usp30 KO + SNCA groups of mice). Significance determined by one-way ANOVA. Error bars represent mean ± s.d.; ****P < 0.0001. e Mean levels of homovanillic acid (HVA, ng/mg protein) in the ipsilateral striatum of female (open dots) and male (closed dots) mice in each group (n = 14 for WT + EV, n = 10 for mito-QC + EV, n = 15 for mito-QC/Usp30 KO + EV, n = 16 for WT + SNCA, n = 14 for mito-QC + SNCA, n = 13 for mito-QC/Usp30 KO + SNCA groups of mice). Significance determined by one-way ANOVA. Error bars represent mean ± s.d.; ****P < 0.0001; *P < 0.05. f Mean levels of 3-methoxytyramine (3-MT, ng/mg protein) in the ipsilateral striata of female (open dots) and male (closed dots) mice in each group (n = 14 for WT + EV, n = 10 for mito-QC + EV, n = 15 for mito-QC/Usp30 KO + EV, n = 16 for WT + SNCA, n = 14 for mito-QC + SNCA, n = 13 for mito-QC/Usp30 KO + SNCA groups of mice). Significance determined by one-way ANOVA. Error bars represent mean ± s.d.; **P < 0.01. Source data are provided as a Source Data file.
Fig. 4
Fig. 4. Validation of USP30 inhibition and pharmacokinetics of a small molecule USP30 inhibitor, MTX115325.
a Representative Western blot images from 5 independent experiments show TOM20 and Ubiquitin-modified TOM20 (TOM20-Ub) at various concentrations of MTX115325 for 90 min in HeLa cells. The structure of MTX115325 is shown above. b Quantification of normalized TOM20-Ub at various MTX115325 concentrations. c Time-dependent concentration of MTX115325 in whole blood and prefrontal cortex after oral administration at 10 mg/kg. n = 4 mice per group. d Whole blood concentrations of MTX115325 after oral administration of 15 mg/kg and 50 mg/kg in the A53T model. n = 3 mice per group. e Representative images showing mito-QC signals in SHSY-5Y cells, which were counterstained with Hoechst for nuclei (blue), after exposing to MTX115325 at 0.333 μM for 20 min. Scale bar, 20 µm. The uncropped images are presented in Supplementary Fig. 9. f quantification of the mitophagy index with MTX115325 treatment (n = 3 independent experiments, with three technical replicates capturing 11 fields of views). Statistical analysis using one-way ANOVA with post-hoc Dunnett’s test. Error bars represent mean ± s.d.;*P < 0.05; **P < 0.01; ***P < 0.001. Source data are provided as a Source Data file.
Fig. 5
Fig. 5. Pharmacological inhibition of USP30 with MTX115325 prevents dopaminergic neuronal loss and dopamine depletion in an α-synuclein-based PD mouse model.
a Representative immunofluorescence images of TH in the SNpc of male mice. Inlets enlarged in lower panels. Scale bar, 1 mm for upper panels, 10 µm for lower panels. b Percentage of dopaminergic neurons in the AAV-A53T-SNCA injected side versus non-injected (NI) side. n = 15 for vehicle group, n = 14 for USP30i group. Significance determined by unpaired T test (2-tailed), Error bars represent mean ± s.d. *P < 0.05. c Relative dopamine levels in male mice’s striatum at 10 weeks post-injection (n = 14, 15, 15, 15, 14, 15 for vehicle+NI, vehicle+SNCA, USP30i 15 mg/kg+NI, USP30i 15 mg/kg+SNCA, USP30i 30 mg/kg+NI, USP30i 30 mg/kg+SNCA groups respectively). Error bars represent mean ± s.d. *P < 0.05; **P < 0.01; ***P < 0.001. d Relative DOPAC levels in male mice’s striatum at 10 weeks post-injection (n = 14, 15, 15, 15, 14, 15 for vehicle+NI, vehicle+SNCA, USP30i 15 mg/kg+NI, USP30i 15 mg/kg+SNCA, USP30i 30 mg/kg+NI, USP30i 30 mg/kg+SNCA groups respectively). Error bars represent mean ± s.d. *P < 0.05; **P < 0.01. e Relative levels of HVA in the male mice’s striatum at 10 weeks post-injection (n = 14, 15, 15, 15, 14, 15 for vehicle+NI, vehicle+SNCA, USP30i 15 mg/kg+NI, USP30i 15 mg/kg+SNCA, USP30i 30 mg/kg+NI, USP30i 30 mg/kg+SNCA groups respectively). Significance for ipsi vs contra comparisons determined by 2-way ANOVA with Uncorrected Fisher LSD. Significance for ipsi vs ipsi comparisons determined by 2-way ANOVA with Dunnett’s post-hoc test. Error bars represent mean ± s.d.; *P < 0.05; ***P < 0.01. Source data are provided as a Source Data file.

Comment in

References

    1. Haque ME, et al. Targeting alpha-synuclein aggregation and its role in mitochondrial dysfunction in Parkinson’s disease. Br. J. Pharm. 2022;179:23–45. doi: 10.1111/bph.15684. - DOI - PubMed
    1. Trinh D, Israwi AR, Arathoon LR, Gleave JA, Nash JE. The multi-faceted role of mitochondria in the pathology of Parkinson’s disease. J. Neurochem. 2021;156:715–752. doi: 10.1111/jnc.15154. - DOI - PubMed
    1. Cutillo G, Simon DK, Eleuteri S. VPS35 and the mitochondria: Connecting the dots in Parkinson’s disease pathophysiology. Neurobiol. Dis. 2020;145:105056. doi: 10.1016/j.nbd.2020.105056. - DOI - PubMed
    1. Ammal Kaidery N, Thomas B. Current perspective of mitochondrial biology in Parkinson’s disease. Neurochem Int. 2018;117:91–113. doi: 10.1016/j.neuint.2018.03.001. - DOI - PMC - PubMed
    1. Mullin S, Schapira AH. Pathogenic mechanisms of neurodegeneration in Parkinson disease. Neurol. Clin. 2015;33:1–17. doi: 10.1016/j.ncl.2014.09.010. - DOI - PubMed

Publication types