. 2023 Nov 13;14(1):7330.
doi: 10.1038/s41467-023-43002-x.

Impact of vaccinations, boosters and lockdowns on COVID-19 waves in French Polynesia

Affiliations

Impact of vaccinations, boosters and lockdowns on COVID-19 waves in French Polynesia

Lloyd A C Chapman et al. Nat Commun. .

Abstract

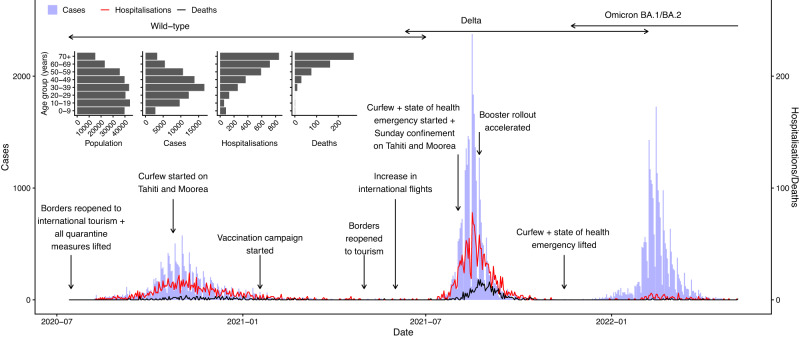
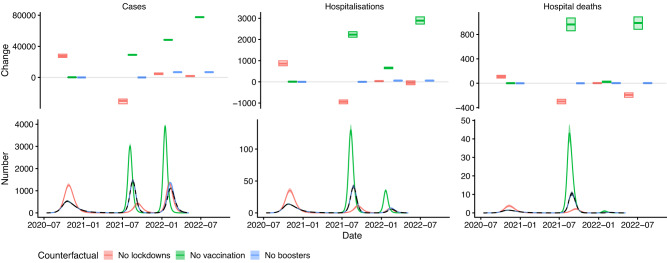
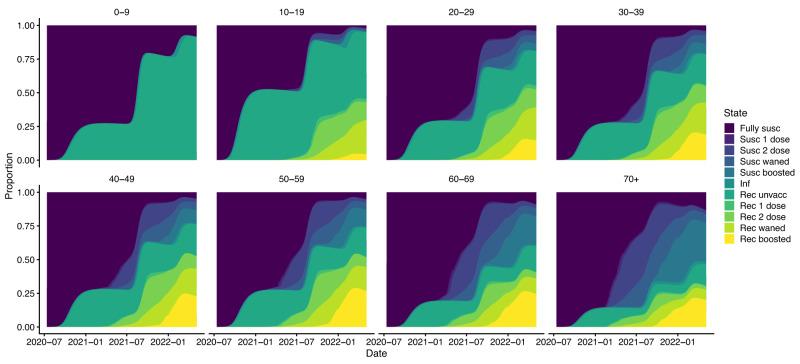
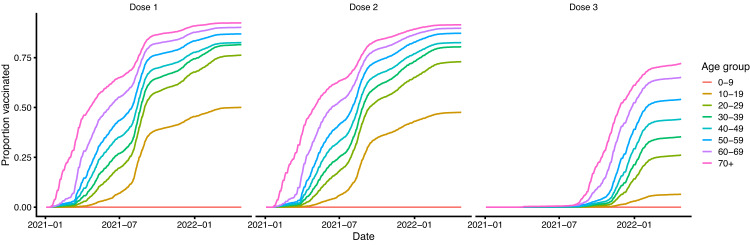
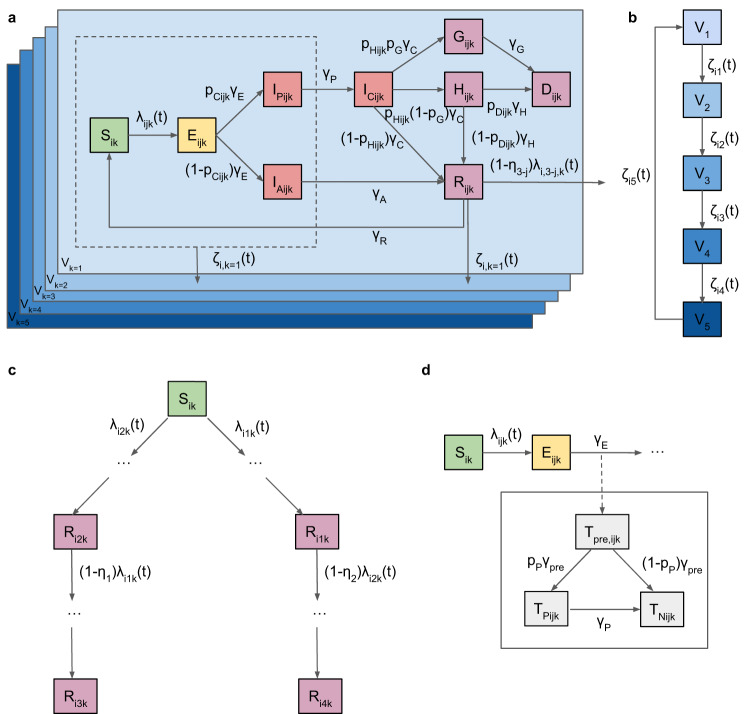
Estimating the impact of vaccination and non-pharmaceutical interventions on COVID-19 incidence is complicated by several factors, including successive emergence of SARS-CoV-2 variants of concern and changing population immunity from vaccination and infection. We develop an age-structured multi-strain COVID-19 transmission model and inference framework to estimate vaccination and non-pharmaceutical intervention impact accounting for these factors. We apply this framework to COVID-19 waves in French Polynesia and estimate that the vaccination programme averted 34.8% (95% credible interval: 34.5-35.2%) of 223,000 symptomatic cases, 49.6% (48.7-50.5%) of 5830 hospitalisations and 64.2% (63.1-65.3%) of 1540 hospital deaths that would have occurred in a scenario without vaccination up to May 2022. We estimate the booster campaign contributed 4.5%, 1.9%, and 0.4% to overall reductions in cases, hospitalisations, and deaths. Our results suggest that removing lockdowns during the first two waves would have had non-linear effects on incidence by altering accumulation of population immunity. Our estimates of vaccination and booster impact differ from those for other countries due to differences in age structure, previous exposure levels and timing of variant introduction relative to vaccination, emphasising the importance of detailed analysis that accounts for these factors.


Conflict of interest statement

The authors declare no competing interests.

Figures

Fig. 1
Fig. 1. COVID-19 epidemic in French Polynesia between August 2020 and May 2022.
Main panel: First three epidemic waves of COVID-19 confirmed cases, hospitalisations, and hospital deaths, with major changes in non-pharmaceutical interventions and vaccinations and boosters, and circulation periods of different variants. Inset: Age distributions of French Polynesian population, COVID-19 confirmed cases, hospitalisations and hospital deaths.
Fig. 2
Fig. 2. Fit of the model to the observed total numbers of confirmed cases, hospitalisations and hospital deaths over time.
Red dots show observed counts, black line and dark grey shaded area show median and 95% CI of simulations of the fitted model, i.e. the uncertainty in the expected number of each outcome in the model. Light grey shaded area shows 95% posterior predictive interval of the model, i.e. the uncertainty in the values of each outcome from the model also accounting for uncertainty in the observation process. Note that there is a strong day-of-the-week effect in the reporting that accounts for the much of the dispersion in the data. Note different scales on vertical axes.
Fig. 3
Fig. 3. Estimated impact of lockdowns, whole vaccination programme, and booster programme on numbers of COVID-19 symptomatic cases, hospitalisations, and hospital deaths.
Bottom panel: Numbers of cases, hospitalisations, and hospital deaths over time. Solid lines and shaded areas show medians and 95% CI of 500 simulations of the model for each counterfactual scenario, dashed black line and grey shaded area show median and 95% CI of simulations of the fitted model. Top panel: Change in cases, hospitalisations, and hospital deaths in each wave and overall (fourth set of boxes). Each box shows median (central line) and 95% CI (lower and upper lines) from 500 simulations of the model. See Figures S8 and S9 for results of sensitivity analysis.
Fig. 4
Fig. 4. Inferred immune status of the population over time by age group.
Coloured bands show median estimates from 1000 simulations of the fitted model. Note that the fully susceptible category includes individuals whose immunity from infection or vaccination has waned. Susc suscceptible, Inf infected, Rec recovered.
Fig. 5
Fig. 5. Vaccination coverage by vaccine dose.
Dose 3 = booster dose.
Fig. 6
Fig. 6. Model flow diagram.
a SEIR-type transmission model structure with infectious states shown in red and different vaccination strata shown in blue. Sik, Eijk, IAijk, IPijk, ICijk, Hijk, Gijk, Dijk, and Rijk denote the numbers of individuals who are susceptible, exposed (latently infected), asymptomatically infected, presymptomatically infected, symptomatically (clinically) infected, hospitalised, severely diseased who will die outside hospital, dead from COVID-19, and recovered from infection respectively. Tpreijk, TPijk, and TNijk denote the numbers of individuals pre-seropositive, seropositive, and seronegative against the SARS-CoV-2 N antigen. Subscripts denote the age group (i ∈ {0–9, 10–19, 20–29, 30–39, 40–49, 50–59, 60–69, 70+} years), variant (j ∈ {1, 2, 3, 4}, where j = 3 represents infection by variant 1 followed by infection by variant 2, and j = 4 vice versa), and vaccination stratum (k ∈ {1, 2, 3, 4, 5}). Individuals in states inside dashed box and recovered from infection can move between vaccination strata upon vaccination. b Vaccination strata flow diagram (strata defined in Table 3). c Multi-strain model structure showing possible infection with first variant or second variant, or first then second, or second then first. d Seropositivity model structure with `parallel flow' to transmission model flow. Transition rates between states are shown on arrows (see Model equations section and Table S2 for definitions). Further details of the model structure are provided in the Methods section.

References

    1. Watson OJ, et al. Global impact of the first year of COVID-19 vaccination: a mathematical modelling study. Lancet Infect. Dis. 2022;22:1293–1302. doi: 10.1016/S1473-3099(22)00320-6. - DOI - PMC - PubMed
    1. Marziano, V. et al. The effect of COVID-19 vaccination in Italy and perspectives for living with the virus. Nat. Commun.12, 7272 (2021). - PMC - PubMed
    1. Yamana, T. K. et al. The impact of COVID-19 vaccination in the US: Averted burden of SARS-COV-2-related cases, hospitalizations and deaths. PLoS ONE18, e0275699 (2023). - PMC - PubMed
    1. Shoukat A, et al. Lives saved and hospitalizations averted by COVID-19 vaccination in New York City: a modeling study. Lancet Region. Health Am. 2022;5:100085. doi: 10.1016/j.lana.2021.100085. - DOI - PMC - PubMed
    1. Haas EJ, et al. Infections, hospitalisations, and deaths averted via a nationwide vaccination campaign using the Pfizer-BioNTech BNT162b2 mRNA COVID-19 vaccine in Israel: a retrospective surveillance study. Lancet Infect. Dis. 2022;22:357–366. doi: 10.1016/S1473-3099(21)00566-1. - DOI - PMC - PubMed

Publication types

Supplementary concepts