. 2023 Nov 13;14(1):7329.
doi: 10.1038/s41467-023-43123-3.

The Imageable Genome

Affiliations

The Imageable Genome

Pablo Jané et al. Nat Commun. .

Abstract

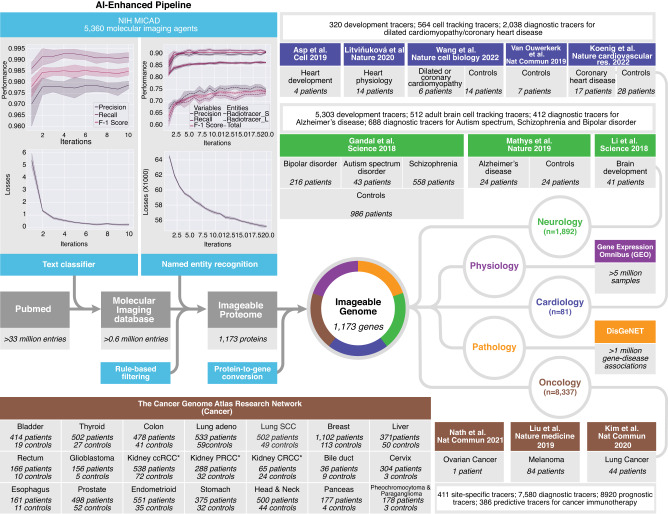
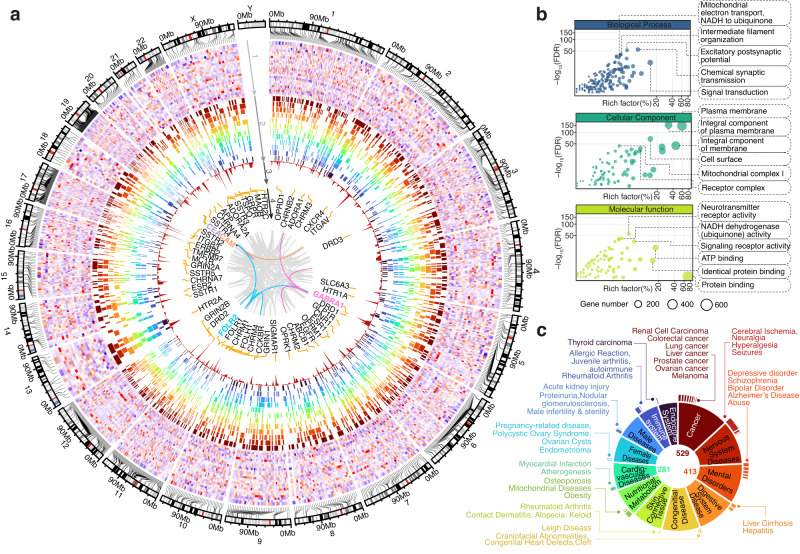
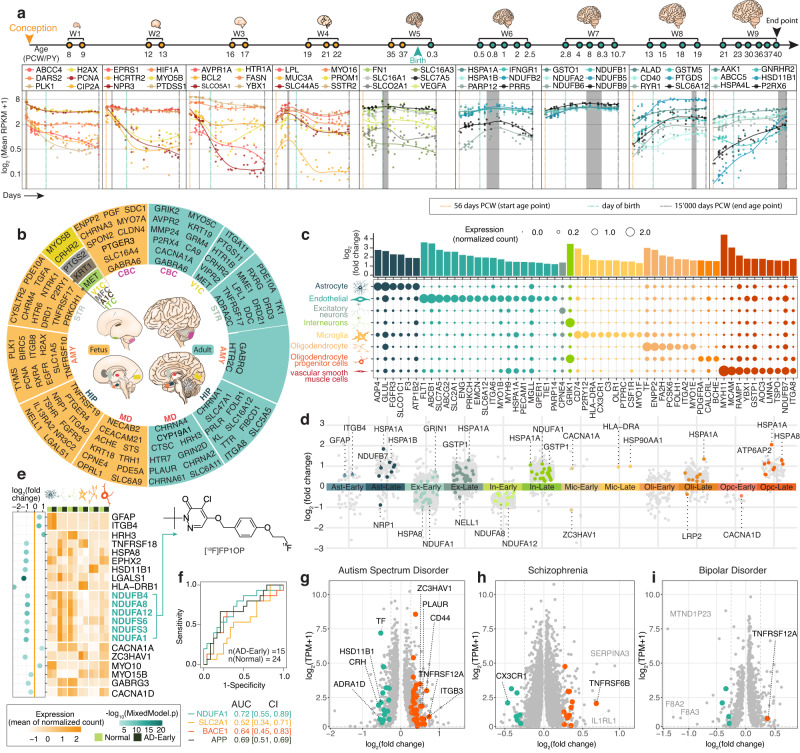
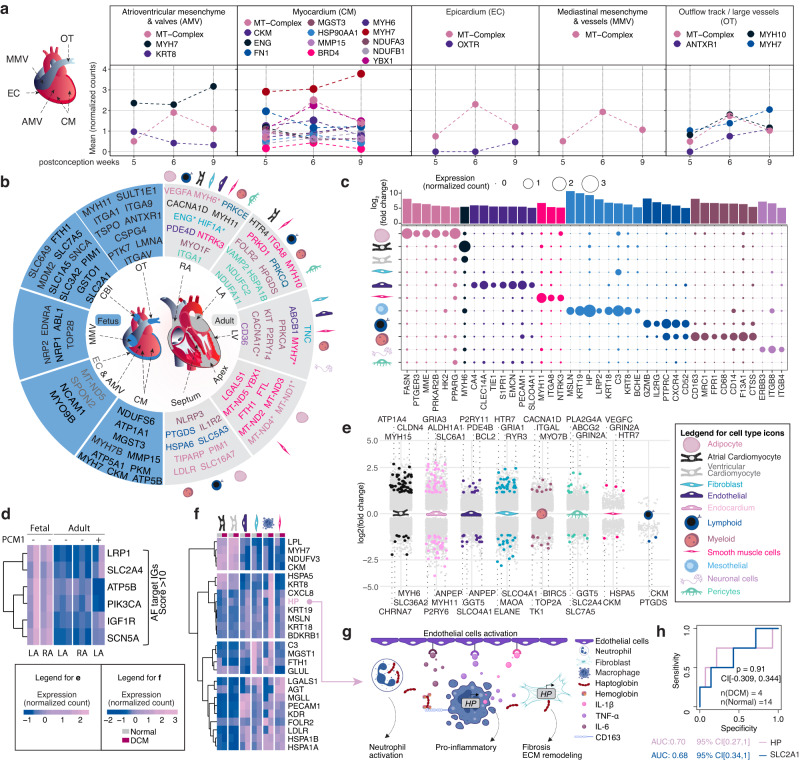
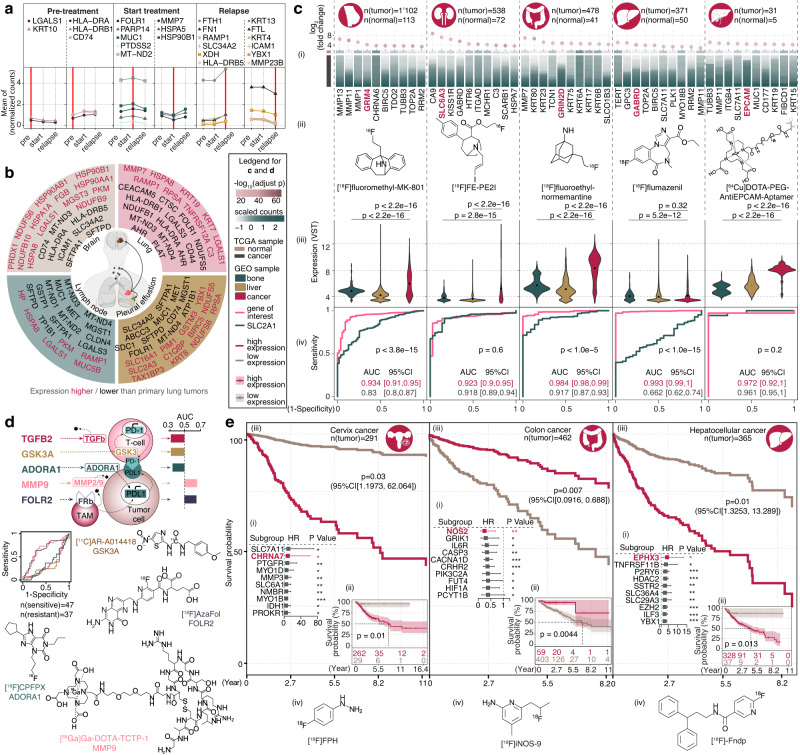
Understanding human disease on a molecular level, and translating this understanding into targeted diagnostics and therapies are central tenets of molecular medicine1. Realizing this doctrine requires an efficient adaptation of molecular discoveries into the clinic. We present an approach to facilitate this process by describing the Imageable Genome, the part of the human genome whose expression can be assessed via molecular imaging. Using a deep learning-based hybrid human-AI pipeline, we bridge individual genes and their relevance in human diseases with specific molecular imaging methods. Cross-referencing the Imageable Genome with RNA-seq data from over 60,000 individuals reveals diagnostic, prognostic and predictive imageable genes for a wide variety of major human diseases. Having both the critical size and focus to be altered in its expression during the development and progression of any human disease, the Imageable Genome will generate new imaging tools that improve the understanding, diagnosis and management of human diseases.


Conflict of interest statement

The authors declare no competing interests.

Figures

Fig. 1
Fig. 1. Data pipeline.
For the Imageable Genome project, we developed a data pipeline that identifies texts containing radiotracers, recognizes and extracts names of radiotracers from texts, filters for clinically-relevant radiotracers and their associated targets, and translates protein names, i.e. of radiotracer targets, to names of the coding genes. We then downloaded the entire baseline MEDLINE/PubMed citation record, and used the above-mentioned pipeline to establish the Imageable Genome, the part of the human genome whose expression can be assessed by molecular imaging. Subsequently, we subjected the Imageable Genome dataset to normal tissues expressions from a massive analysis of GEO studies, and gene-disease association from a curated DisGeNET database. Then we cross the Imageable Genome dataset to transcriptomic datasets of human brain development and disorders, heart development and failures, and The Cancer Genome Atlas (TCGA) of 21 cancer types, to identify imageable genes for monitoring tissue development, tracking cell types, as well as for diagnostic, prognostic and predictive imaging. ccRCC clear cell renal cell carcinoma, PRCC papillary renal cell carcinoma, CRCC chromophobe renal cell carcinoma.
Fig. 2
Fig. 2. The Imageable Genome.
a A circos plot depicting 1166 out of 1173 genes of the Imageable Genome with their chromosome locations (7 mitochondrial genes not shown): track 1, expression across 24 healthy tissues (red: relatively high gene expression, green: relatively low gene expression); track 2, gene-disease associations across 12 major diseases, with colour code corresponding to the disease classification in (c); track 3, number of radiotracers targeting an imageable gene. The height of red peak represents the corresponding number; track 4, imageable genes targeted by more than 30 radiotracers are labelled, and the links to their genome-wide co-expressed genes across 24 healthy tissues are highlighted in the innermost layer (pink, blue, purple and orange lines). CEACAM*: CEACAM3, CEACAM5, CEACAM6. b Scatter plot summarizing a list of enriched gene ontology (GO) terms from 1165 imageable genes (8 genes are not present in DAVID database). Rich factor is the ratio of the imageable gene number in a GO term to the total gene number. One-sided p values are computed using Fisher’s Exact test with a 95% confidence interval. The False Discovery Rate (FDR) is used to control for multiple testing. GO terms passing the thresholds −log10(FDR) > 30 and Rich factor >15% are labelled. c Disease classification of 916 imageable genes. Top enriched 12 major diseases and their subcategorized diseases are shown in a sunburst plot, with the area corresponding to the ratio of gene number within a major disease to the total gene number. Centred absolute numbers represent the number of genes within the disease families cancer, mental disorders and cardiovascular diseases. Source data are provided as a Source data file.
Fig. 3
Fig. 3. The Imageable Genome in neurology.
a Representative temporally imageable genes across 9 brain development windows (W1–9). Dots represent the expression level calculated from all brain regions of a sample within a window. PCW: postconceptional weeks. PY postnatal years. Grey box: corresponding development window. b A donut chart showing the prenatal (left, yellow) and adult (right, lake blue) brain regional imageable genes. CBC, cerebellar cortex; V1C, primary visual (V1) cortex; STR, striatum; AMY, amygdala; HIP, hippocampus; MD, mediodorsal nucleus of thalamus; MFC, medial prefrontal cortex; A1C, primary auditory (A1) cortex; ITC, inferior temporal cortex. c Dot plot depicting the expression of cell type specific imageable genes in eight adult brain cell types, with colour code corresponding to cell type. d A scatter plot of Early or Late-Alzheimer’s disease related imageable genes across 6 cell types. The top ranked imageable genes are highlighted with colour code corresponding to cell type. Ast astrocytes, Ex excitatory neurons, In inhibitory neurons, Mic microglia, Oli oligodendrocytes, Opc oligodendrocyte precursor cells. e Top ranked Early-Alzheimer’s disease (AD-Early) related imageable genes sorted by absolute log2 (mean gene expression in AD-Early/mean gene expression in Normal) (shown as: log2(fold change)) values across 6 cell types. Z-score normalized read counts are shown (two sided Wilcoxon-rank sum test at FDR < 0.01, absolute log2(fold change) >0.25, and Poisson mixed model at FDR < 0.05). NADH:ubiquinone oxidoreductase supernumerary subunits were labelled in lake blue, followed by a chemical structure of Fluorine-18 radioisotope labelled PET radiotracer targeting the mitochondrial complex. Cell-type icons created with BioRender.com. f Area under the receiver operating curve (AUC) values representing the capacity of imageable genes and 3 reference genes in discriminating Early-Alzheimer’s disease and healthy brains. gi Volcano plots of genes differentially expressed in g autism (ASD, n = 43), h schizophrenia (SCZ, n = 558), and i bipolar disorder (BD, n = 216) versus healthy brains (n = 986). Up-regulated (red) or down-regulated (green) imageable genes are highlighted. Ast astrocytes, Endo endothelial cells, Ex excitatory neurons, In inhibitory neurons, Mic microglia, Oli oligodendrocytes Opc oligodendrocyte precursor cells, Vsmc vascular smooth muscle cells. Source data are provided as a Source data file. Cell type icons are created with BioRender.com.
Fig. 4
Fig. 4. The Imageable Genome in cardiology.
a Temporally imageable genes during human embryonic heart development within each region. A scheme showing the structure of the human embryonic heart at 5–9 post-conception weeks (Created with BioRender.com). Genes coding for mitochondria complex I-IV subunits are grouped and named into MT-complex. b Regional imageable genes for human embryonic heart (left, blue) and adult heart of each cell type (right, grey). CM cardiomyocyte, LV left ventricular, LA left atrial, RA right atrial, OT outflow track, CBI cavities with blood and immune cells, AMV atrioventricular mesenchyme and valves, MMV mediastinal mesenchyme and vessels, EC epicardium. c Dot plot depicting the expression of cell-type-specific imageable genes in eleven adult heart cell types, with colour code corresponding to cell type and circle size representing the relative gene expression level. d Heatmap of atrial fibrillation (AF) target imageable genes up- or down-regulated in adult PCM1 labelled (Pericentriolar Material 1 antibody) left atrial cells versus adult whole atrial tissue expression, or up-regulated in the fetal atrium versus the adult atrium. e Expression of adult dilated cardiomyopathy (DCM) related genes in each cell type (DCM = 18, n (healthy) = 27). The top ranked imageable genes are highlighted in colour corresponding to cell type. f Heatmap of top ranked DCM related imageable genes in 6 cell types. Haptoglobin (HP) was labelled in pink. g Schematic illustrating the HP cellular function and potential pro-inflammatory effects under heart failure condition (Created with BioRender.com). h AUC values (95% confidence interval (CI)) representing the capacity of HP and GLUT1 (SLC2A1) expressions in discriminating DCM and healthy states of the adult human hearts including 4 cell types: EC (endocardium), FB (fibroblasts), MP (macrophages) and SMC (smooth muscle cells). p value with 95% CI calculated from two-sided DeLong’s test for two ROC curves. Source data are provided as a Source data file. Cell-type icons are created with BioRender.com.
Fig. 5
Fig. 5. The Imageable Genome in Oncology.
a Expression of top ranked disease status related imageable genes in malignant ovarian epithelial cells over time: at diagnosis (pre-treatment), under therapy (treatment), and in relapse as indicated by an augmented serum CA-125 level (two-sided Wilcox test). b Tissue origins during lung cancer metastasis and top ranked imageable genes differentially expressed at advanced or metastatic sites versus primary site, two-sided Student’s t test p < 0.01 with Bonferroni correction<0.01, |log2(fold change)|>0.585. c Top diagnostic imageable genes across 5 cancer types. log2(fold change)>0.5 and Limma moderated t-statistic with Bonferroni correction<0.01. (i) heatmap illustrating the gene expressions (columns) in normal or cancer tissue (rows); (ii) an gene of interest (GOI) in mauve with a chemical structure of PET radiotracer targeting the GOI; (iii) violin plot of GOI expression in bone (n = 284), liver (n = 1759) and mammary cancer (n = 5541), kidney cancer (n = 349) or intestines cancer (n = 2227), two-sided Wilcoxon test p values are shown. (iv) ROC curves of GOI and SLC2A1 with 95% confidence interval (CI) and two-sided DeLong’s test p value for two correlated ROC curves. d A schematic showing the predictive capacity (ROC curves, sensitive: PD1-blockage treatment responder, resistant: non-responders) of 5 representative imageable genes, and their clinical radiotracers. e Prognostic imageable genes in, left to right, Cervix cancer, Colon cancer and Hepatocellular cancer. For each cancer, (i) top ranked imageable genes sorted by p values from Wald test by fitting Cox proportional hazards (CPH) models to evaluate the effect of covariates on overall survival, with the best cutoff determined (see “Methods”). A square represents the Hazard Ratio (HR) with a horizontal line extending on either side representing the 95% CI. GOI is labelled in mauve. *p < 0.05; **p < 0.01; ***p < 0.001; (ii) Kaplan–Meier overall survival with Log-Rank test p value; (iii) cox regression overall survival curves distinguishing GOI high/low expression groups (multivariable survival analyses with Wald test p values by fitting CPH model); (iv) chemical structure of PET radiotracer targeting the GOI. Cancer-type icons are created with BioRender.com. Source data are provided as a Source data file.

References

    1. Strasser BJ. Perspectives: molecular medicine. “Sickle cell anemia, a molecular disease”. Science. 1999;286:1488–1490. doi: 10.1126/science.286.5444.1488. - DOI - PubMed
    1. Herschman HR. Molecular imaging: looking at problems, seeing solutions. Science. 2003;302:605–608. doi: 10.1126/science.1090585. - DOI - PubMed
    1. Massoud TF, Gambhir SS. Integrating noninvasive molecular imaging into molecular medicine: an evolving paradigm. Trends Mol. Med. 2007;13:183–191. doi: 10.1016/j.molmed.2007.03.003. - DOI - PubMed
    1. Weber WA, Grosu AL, Czernin J. Technology Insight: advances in molecular imaging and an appraisal of PET/CT scanning. Nat. Clin. Pract. Oncol. 2008;5:160–170. doi: 10.1038/ncponc1041. - DOI - PubMed
    1. Siva S, et al. Expanding the role of small-molecule PSMA ligands beyond PET staging of prostate cancer. Nat. Rev. Urol. 2020;17:107–118. doi: 10.1038/s41585-019-0272-5. - DOI - PubMed

Publication types