. 2023 Nov 13;6(1):1161.
doi: 10.1038/s42003-023-05515-5.

Degeneracy in the neurological model of auditory speech repetition

Affiliations

Degeneracy in the neurological model of auditory speech repetition

Noor Sajid et al. Commun Biol. .

Abstract

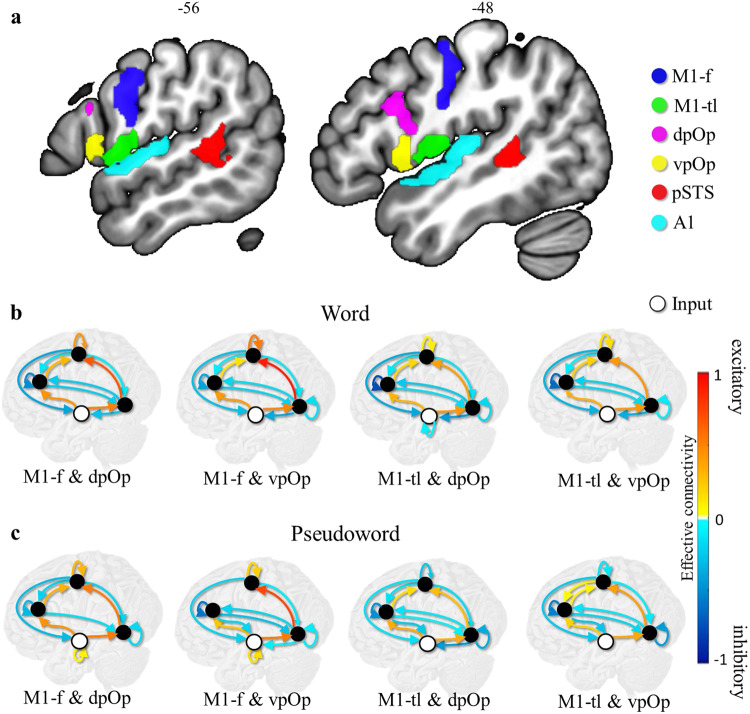
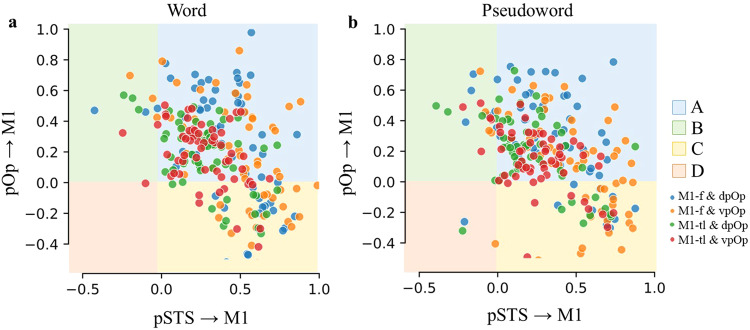
Both classic and contemporary models of auditory word repetition involve at least four left hemisphere regions: primary auditory cortex for processing sounds; pSTS (within Wernicke's area) for processing auditory images of speech; pOp (within Broca's area) for processing motor images of speech; and primary motor cortex for overt speech articulation. Previous functional-MRI (fMRI) studies confirm that auditory repetition activates these regions, in addition to many others. Crucially, however, contemporary models do not specify how regions interact and drive each other during auditory repetition. Here, we used dynamic causal modelling, to test the functional interplay among the four core brain regions during single auditory word and pseudoword repetition. Our analysis is grounded in the principle of degeneracy-i.e., many-to-one structure-function relationships-where multiple neural pathways can execute the same function. Contrary to expectation, we found that, for both word and pseudoword repetition, (i) the effective connectivity between pSTS and pOp was predominantly bidirectional and inhibitory; (ii) activity in the motor cortex could be driven by either pSTS or pOp; and (iii) the latter varied both within and between individuals. These results suggest that different neural pathways can support auditory speech repetition. This degeneracy may explain resilience to functional loss after brain damage.


Conflict of interest statement

The authors declare no competing interests.

Figures

Fig. 1
Fig. 1. Estimated effective connectivity for the anatomical regions of interest.
a shows the 6 anatomical regions of interest: M1-f (blue), M1-tl (green), dpOp (magenta), vpOp (yellow), pSTS (red) and A1 (cyan). b shows the strength of effective connectivity among regions, during word repetition, after Bayesian model selection. In each model, the four circles represent A1 (bottom, white circle, input area), pSTS (black circle, right), pOp (black circle, left) and M1 (black circle, top). Four different models are depicted for either vpOp or dpOp; with either M1-f or M-tl. c shows the same for pseudoword repetition. Red lines denote positive (excitatory) extrinsic connections between regions, with a maximum value of 1, dark blue denotes negative (inhibitory) extrinsic connections between regions, with a maximum value of −1. The other lines represent connections graded within these extremes, see Table 1 for details. Self-connections with a high posterior probability (i.e., >0.75 representative of strong Bayesian evidence) are log scale parameters that scale inhibitory intrinsic connectivity.
Fig. 2
Fig. 2. Individual-level effective connectivity from pOp and pSTS to M1.
For word (a) and pseudoword (b) repetition separately, group membership (A, B, C or D) is illustrated for each of the four subregional configurations for each participant. The colour dots denote the model specification, i.e., blue is for the M1-f and dpOp, orange for M1-f and vpOp, green for M1-tl and dpOp and red for M1-tl and vpOp. Group A included excitatory connections from both pOp and pSTS to M1; Group B included excitatory connections from pSTS to M1 but not from pOp to M1; Group C included excitatory connections from pOp to M1 but not from pSTS to M1; and Group D did not include excitatory connections from either pOp or pSTS to M1.
Fig. 3
Fig. 3. Model assignment in each group.
a Box plots of the number of models (y-axis) assigned to each group (x-axis), across the 4 configurations (dpOp & M1-f, vpOp & M1-f, dpOp & M1-tl, vpOp & M1-tl) for word and pseudoword repetition separately at an individual level. The box ranges from the first quartile to the third quartile of the distribution and the interquartile range represents the range between them. The line across the box is the median and the ends on the box plots go from the first and third quartiles to the most extreme data points. Here, Group A denotes excitatory connections from pOp to M1 and from pSTS to M1; Group B denotes excitatory connections from pSTS to M1 but not from pOp to M1; Group C denotes excitatory connections from pOp to M1 but not from pSTS to M1; and Group D denotes no connectivity from both pOp and pSTS to M1. We found no significant [ns] differences (with a p-value of 1.00) between word and pseudoword repetition across the different groups using a two-sided Mann-Whitney-Wilcoxon test with Bonferroni correction (sample size n = 59). b represents the 10 models (from subset of Group C) that were consistent with the neurological model across subregional configuration (dpOp & M1-f, vpOp & M1-f, dpOp & M1-tl, vpOp & M1-tl). c, d represent the model specification breakdown by group membership for word and pseudowords, respectively. This highlights the similar distribution of the 4 model types (in red, green, orange, and blue) for words and pseudowords and across subregional configuration.
Fig. 4
Fig. 4. Degeneracy in auditory repetition.
Sample density (y-axis) is plotted against entropy measured in natural units (nats; x-axis), over group membership for word (blue) and pseudoword (orange) repetition separately. Low entropy (=0) denotes membership of a single group (e.g., the participant was consistently in group A) whereas high entropy (>1.3) denotes membership dispersed over all groups (i.e., the participant was in group A, B, C and D for the different subregional combinations). Sample density plots the participation distribution (n = 59) at each level of entropy.
Fig. 5
Fig. 5. Graphical illustration of subject-level DCM.
a presents a graphic illustration of the DCM for generative model: BOLD (blood oxygenation level-dependent) signal represents the observed fMRI data, Neuronal Dynamics represent the neural state dynamics and arrows between denote the forward model (i.e., predict) and inverse model (i.e., estimate). b presents the four different DCMs estimated. Each model comprised 4 regions with 15 connections, including the 4 self-connections. However, different subregional configurations lead to 4 different models (1-4): 1 (M1-f and dpOp), 2 (M1-f and vpOp), 3 (M1-tl and dpOp) and 4 (M1-tl and dpOp). Here, dark blue coloured node is for M1-f, green for M1-tl, magenta for dpOp, yellow for vpOp, red for pSTS and cyan for A1.

References

    1. Lichtheim, L. On Aphasia. Brain7, 434–484 (1885).
    1. Broca, P. Localization of Speech in the Third Left Frontal Convolution. Bull. Soc. Anthropol. 6, 337–393 (1865).
    1. Wernicke, C. Aphasia Symptom Complex eine psychologische Studie auf anatomischer Basis, Cohn & Weigert (1874).
    1. Geschwind N. Disconnexion syndromes in animals and man. Brain. 1965;88:585–585. doi: 10.1093/brain/88.3.585. - DOI - PubMed
    1. Hope TMH, et al. Dissecting the functional anatomy of auditory word repetition. Front. Hum. Neurosci. 2014;8:246–246. doi: 10.3389/fnhum.2014.00246. - DOI - PMC - PubMed

Publication types