. 2023 Dec;26(12):2104-2121.
doi: 10.1038/s41593-023-01480-8. Epub 2023 Nov 13.

The APOE-R136S mutation protects against APOE4-driven Tau pathology, neurodegeneration and neuroinflammation

Affiliations

The APOE-R136S mutation protects against APOE4-driven Tau pathology, neurodegeneration and neuroinflammation

Maxine R Nelson et al. Nat Neurosci. 2023 Dec.

Abstract

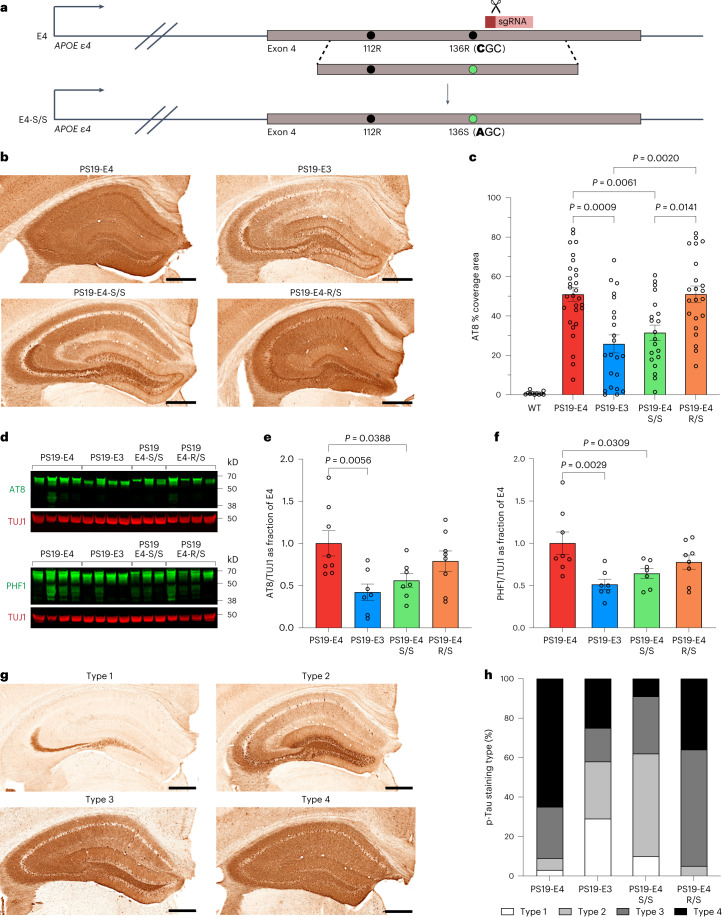
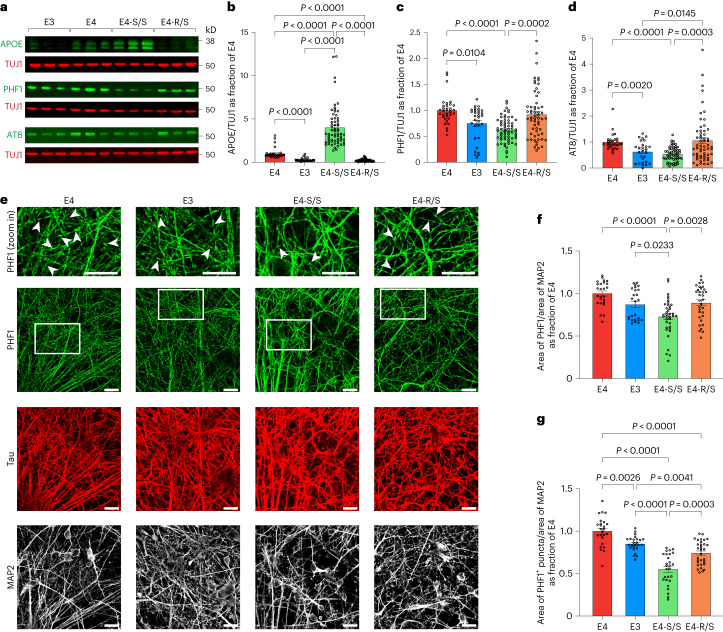
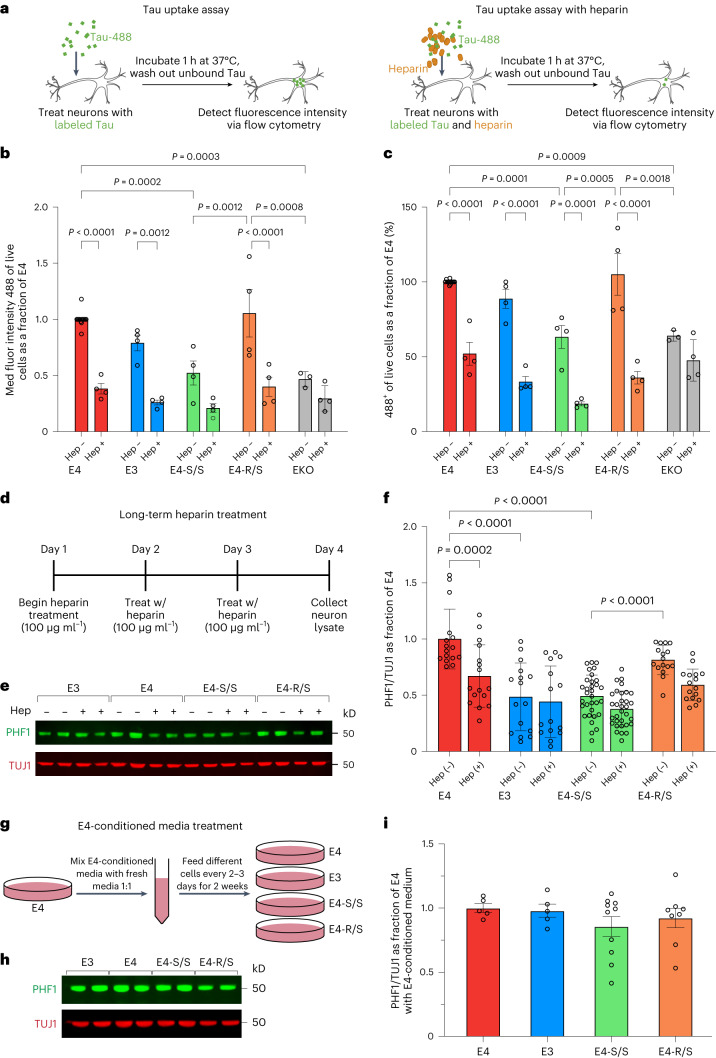
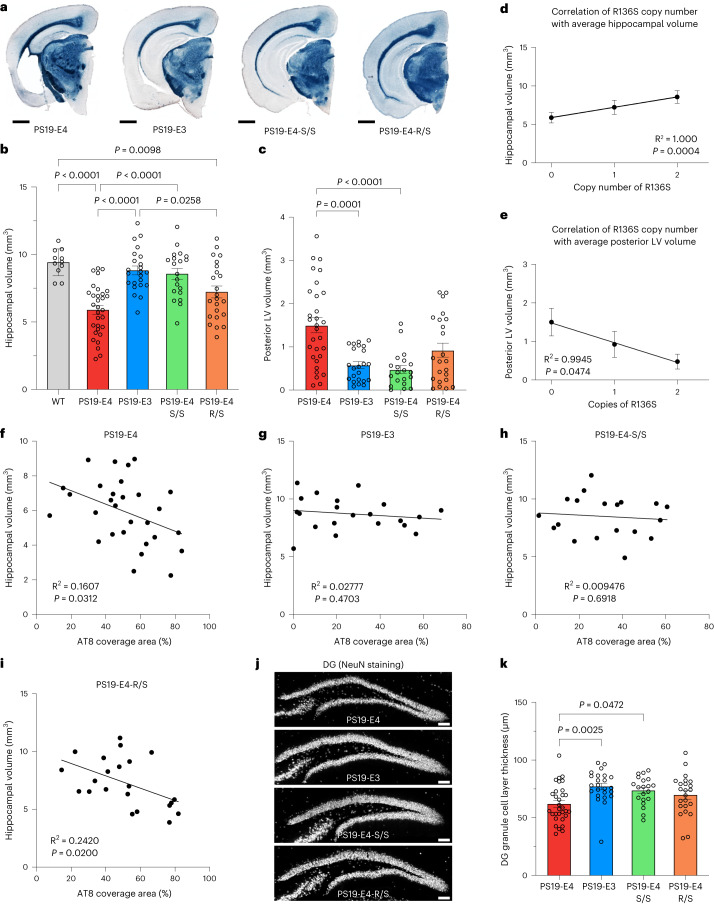
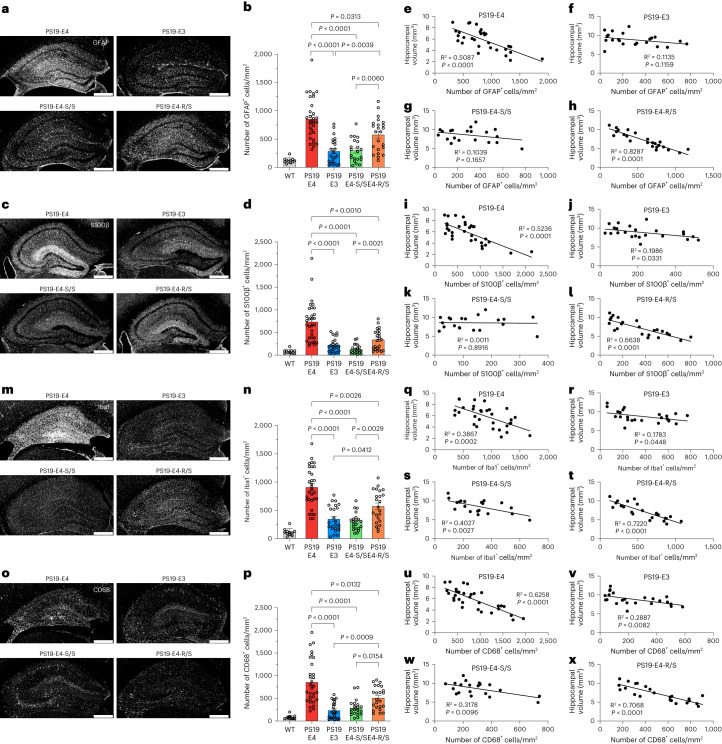
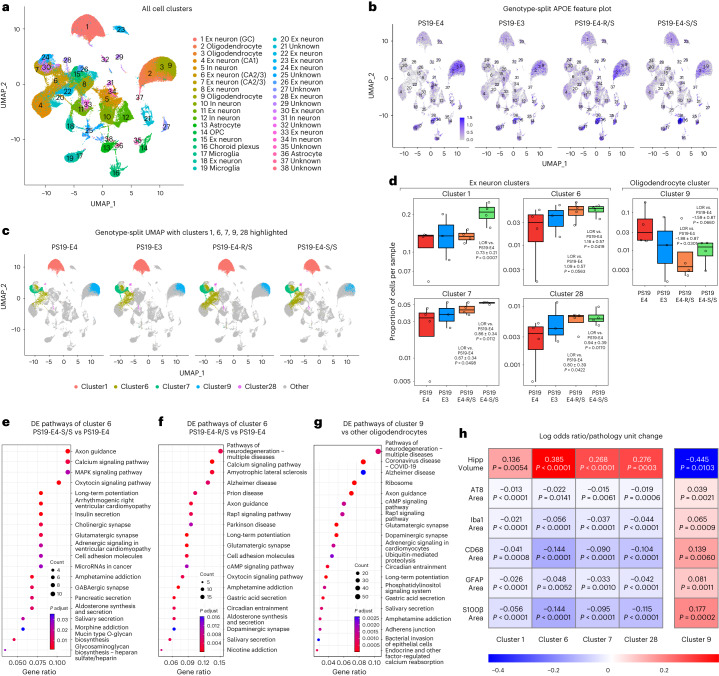
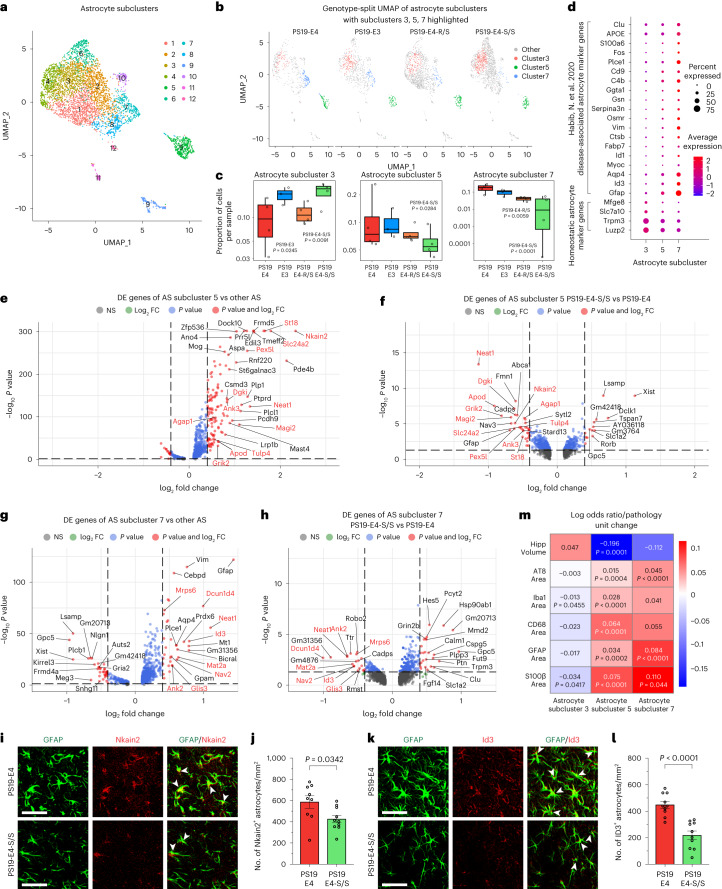
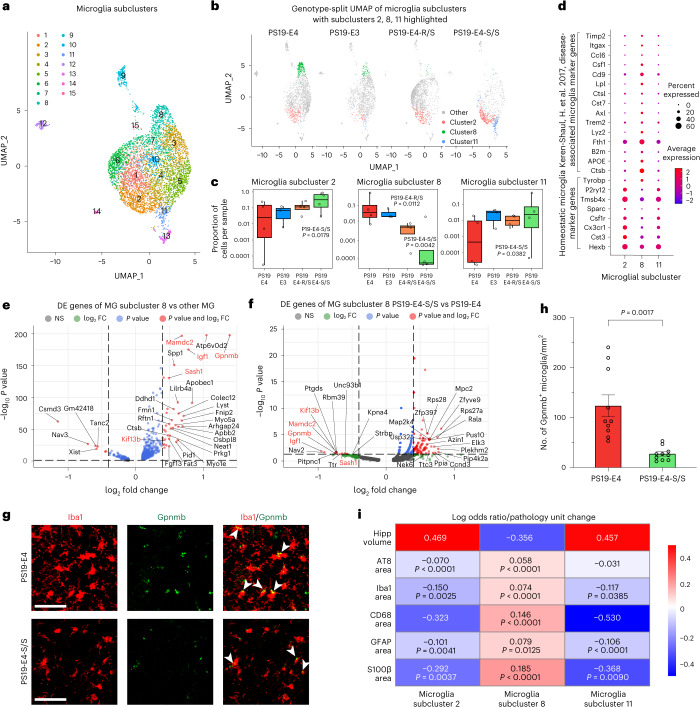
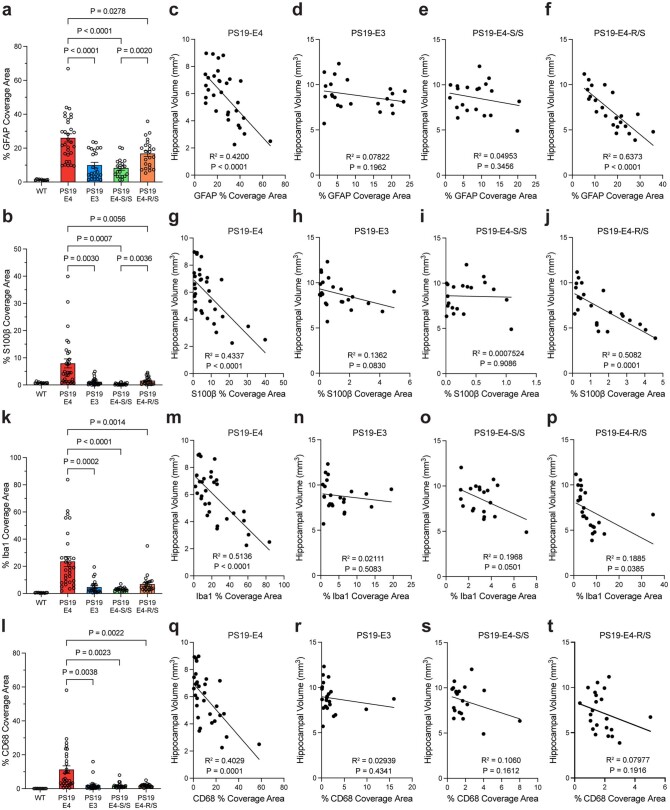
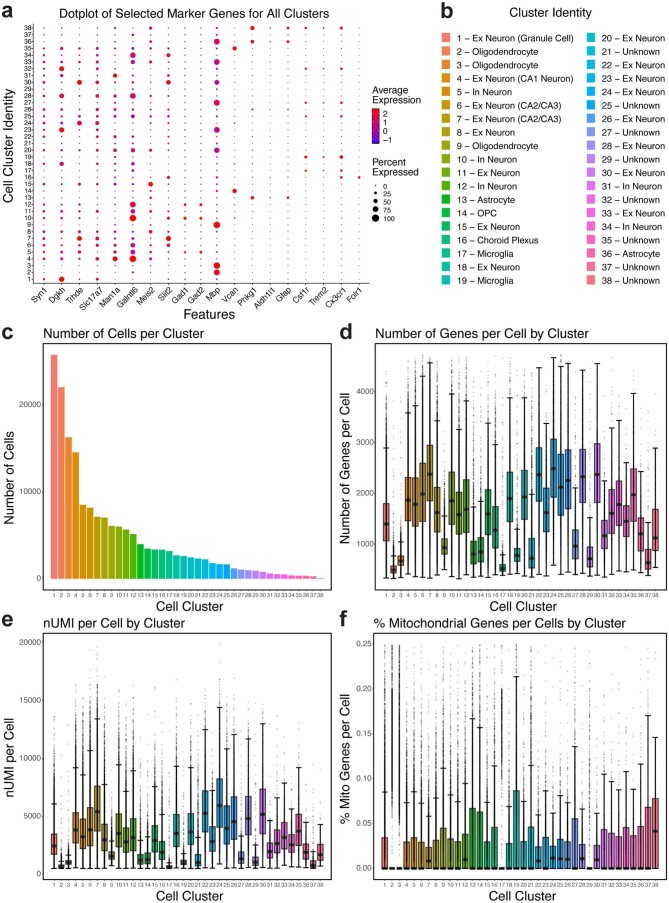
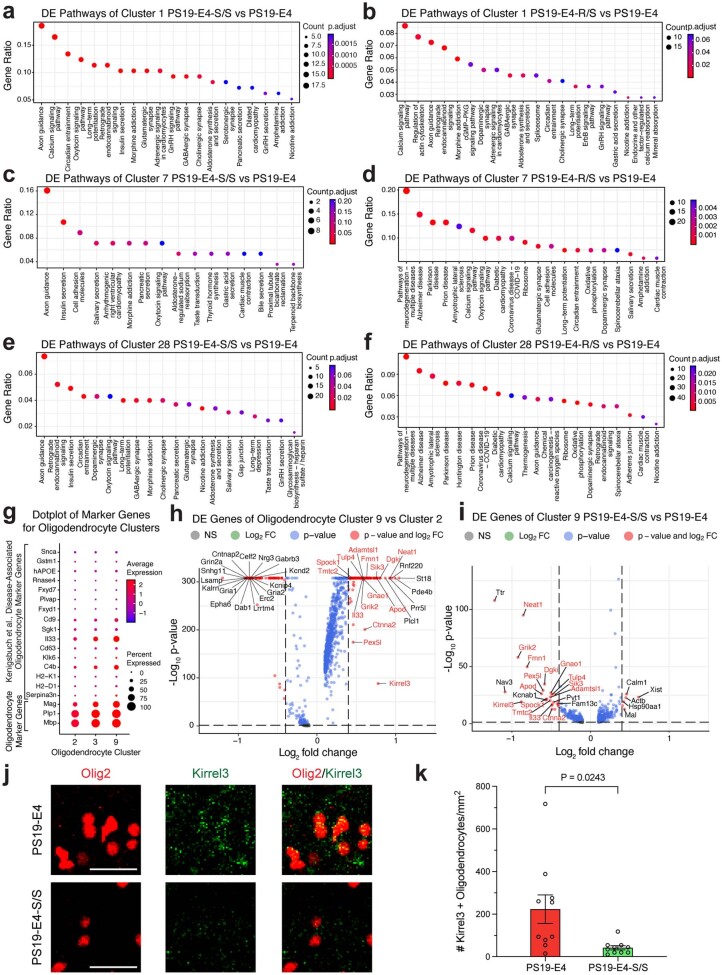
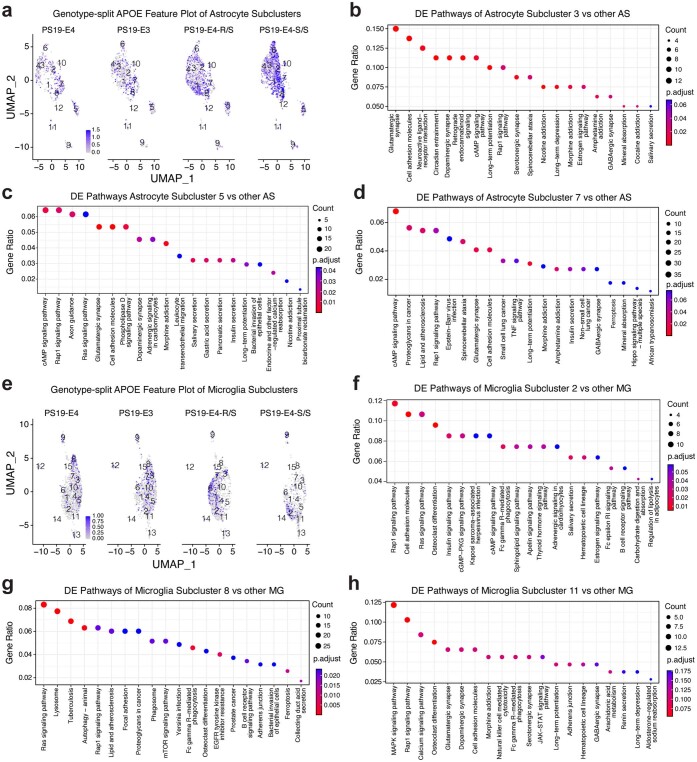
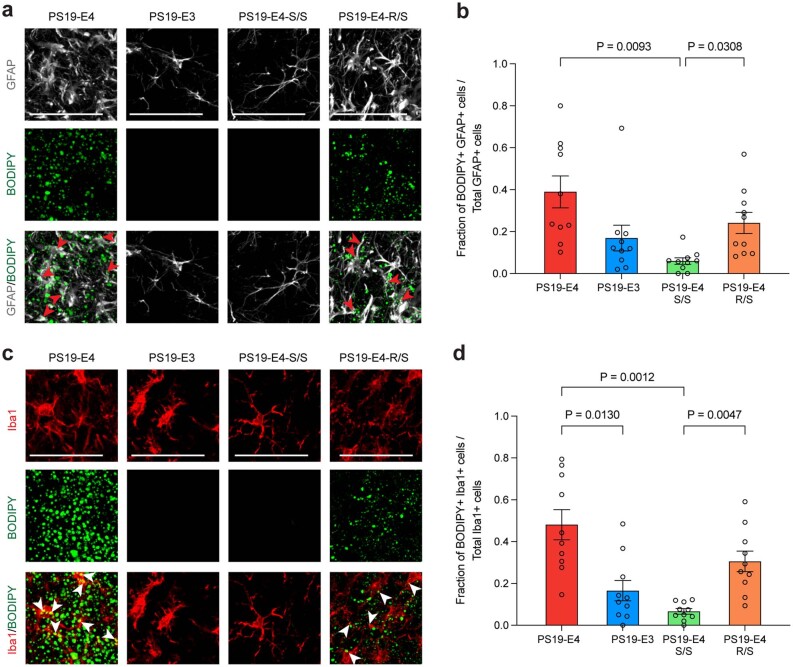
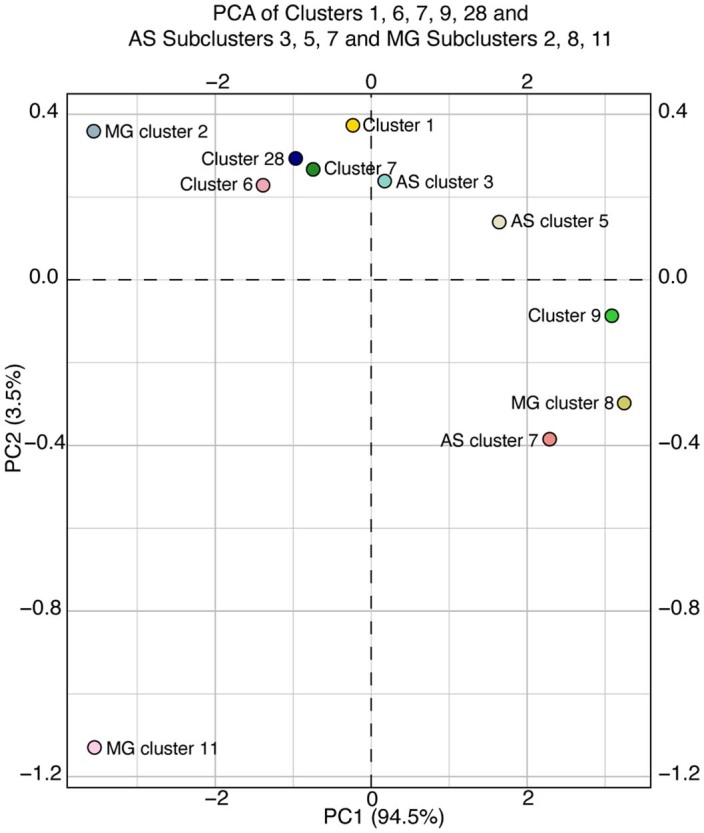
Apolipoprotein E4 (APOE4) is the strongest genetic risk factor for late-onset Alzheimer's disease (LOAD), leading to earlier age of clinical onset and exacerbating pathologies. There is a critical need to identify protective targets. Recently, a rare APOE variant, APOE3-R136S (Christchurch), was found to protect against early-onset AD in a PSEN1-E280A carrier. In this study, we sought to determine if the R136S mutation also protects against APOE4-driven effects in LOAD. We generated tauopathy mouse and human iPSC-derived neuron models carrying human APOE4 with the homozygous or heterozygous R136S mutation. We found that the homozygous R136S mutation rescued APOE4-driven Tau pathology, neurodegeneration and neuroinflammation. The heterozygous R136S mutation partially protected against APOE4-driven neurodegeneration and neuroinflammation but not Tau pathology. Single-nucleus RNA sequencing revealed that the APOE4-R136S mutation increased disease-protective and diminished disease-associated cell populations in a gene dose-dependent manner. Thus, the APOE-R136S mutation protects against APOE4-driven AD pathologies, providing a target for therapeutic development against AD.


Conflict of interest statement

Y. Huang and R.W.M. are involved in establishing and managing GABAeron, Inc. Q.X. works part time at GABAeron, Inc. J.F.A.-V. is a co-inventor on a patent application describing methods and compositions for the treatment of Alzheimer’s disease via APOE Christchurch. Other authors declare no competing financial interests.

Figures

Fig. 1
Fig. 1. Homozygous R136S mutation rescues APOE4-promoted Tau pathology in tauopathy mice.
a, Schematic of CRISPR–Cas-9-mediated gene editing strategy to generate human APOE4-R136S knock-in mice. b, Representative images of p-Tau immunostaining in hippocampus of 10-month-old PS19-E4, PS19-E3, PS19-E4-S/S and PS19-E4-R/S mice with the AT8 monoclonal antibody. c, Quantification of the percent AT8 coverage area in the hippocampus of these mice (PS19-E4, n = 29; PS19-E3, n = 22; PS19-E4-S/S, n = 20; PS19-E4-R/S, n = 22) and WT mice (n = 11). d, Representative western blot images with p-Tau-specific AT8 or PHF1 antibody. TUJ1 was used as a loading control. e,f, Quantification of AT8+ (e) and PHF1+ (f) p-Tau levels in hippocampal lysates of PS19-E4 (n = 8), PS19-E3 (n = 7), PS19-E4-S/S (n = 7) and PS19-E4-R/S (n = 8) mice. p-Tau levels were normalized to TUJ1 first and then to those of PS19-E4 mice. g, Representative images of four AT8 staining patterns in the hippocampus. h, Distribution of four p-Tau staining patterns in the hippocampus of 10-month-old PS19-E4, PS19-E3, PS19-E4-S/S and PS19-E4-R/S mice (PS19-E4, n = 29; PS19-E3, n = 22; PS19-E4-S/S, n = 20; PS19-E4-R/S, n = 22). Scale bars in b and g, 500 µm. Throughout, data are expressed as mean ± s.e.m. Differences between groups were determined by Welch’s ANOVA followed by Dunnett’s T3 multiple comparison test (c) or ordinary one-way ANOVA followed by Dunnett’s multiple comparison test (e,f). Comparisons of P ≤ 0.05 are labeled on the graph. Source data
Fig. 2
Fig. 2. Homozygous R136S mutation protects against APOE4-induced p-Tau accumulation in human neurons.
ad, Representative western blot images (a) and quantification of APOE (b), PHF1+ p-Tau (c) and AT8+ p-Tau (d) levels in lysates of E4, E3, E4-S/S or E4-R/S neurons. In b, APOE levels were normalized to those of E4. TUJ1 was used as loading control (E4, n = 32; E3, n = 31; E4-S/S, n = 64 (n = 24 from E4-S/S-A; n = 8 from E4-S/S-B; n = 32 from E4-S/S-C); E4-R/S, n = 59 (n = 31 from E4-R/S-A; n = 28 from E4-R/S-B)). In c, PHF1+ p-Tau levels were normalized to those of E4. TUJ1 was used as loading control (E4, n = 32; E3, n = 31; E4-S/S, n = 64 (n = 24 from E4-S/S-A; n = 8 from E4-S/S-B; n = 32 from E4-S/S-C); E4-R/S, n = 59 (n = 31 from E4-R/S-A; n = 28 from E4-R/S-B)). In d, AT8+ p-Tau levels were normalized to those of E4. TUJ1 was used as loading control (E4, n = 28; E3, n = 27; E4-S/S, n = 55 (n = 16 from E4-S/S-A; n = 11 from E4-S/S-B; n = 28 from E4-S/S-C); E4-R/S, n = 59 (n = 31 from E4-R/S-A; n = 28 from E4-R/S-B)). e, Representative images showing immunostaining of p-Tau (PHF1), total Tau and MAP2 in E4, E3, E4-S/S or E4-R/S human neurons, with some PHF1+ puncta (white arrowheads in insets). f,g, Quantification of fraction of the PHF1+ area over MAP2+ area (f) and fraction of PHF1+ puncta area over MAP2+ area (g) (E4, n = 25 fields of view; E3, n = 25 fields of view; E4-S/S, n = 38 fields of view; E4-R/S, n = 33 fields of view). The ratio of PHF1+ area (f) and PHF1+ puncta area (g) over MAP2 area was normalized to that of E4. Western blot data (bd) were made up of at least three independent rounds of differentiation, and all data were combined. Scale bars (e), 20 µm. In bd, n = biological replicates. Throughout, data are expressed as mean ± s.e.m. Differences between groups were determined by Welch’s ANOVA followed by Dunnett’s T3 multiple comparison test (bd,g) or ordinary one-way ANOVA followed by Tukey’s multiple comparison test (f). Comparisons of P ≤ 0.05 are labeled on the graph. Source data
Fig. 3
Fig. 3. Homozygous R136S mutation protects against APOE4-induced p-Tau accumulation by reducing Tau uptake via the HSPG pathway.
a, Diagram of Tau-488 uptake assay. Neurons treated with either Tau-488 alone (left) or Tau-488 together with 100 µg ml−1 heparin (right) before flow cytometry analysis. b, Measurement of individual neuronal Tau-488 uptake (25 nM, 1-h incubation) based on MFI per cell in human neurons. c, Measurement of Tau-488 uptake (25 nM, 1-h incubation) based on percent Tau-488+ human neurons. In b,c, n = independent experiments and normalized to E4 MFI (b) or uptake (%) (c). E4, n = 13; E4+heparin, n = 4; E3, n = 4; E3+heparin, n = 4; E4-S/S, n = 4; E4-S/S+heparin, n = 4; E4-R/S, n = 4; E4-R/S+heparin, n = 4; EKO, n = 3; EKO+heparin, n = 4. Analysis was performed on a live cell population of estimated 5,000 cells for each sample. d, Experimental design for long-term heparin treatment of human neurons. e,f, Representative western blot images (e) and quantification of PHF1+ p-Tau levels (f) in lysates of E4, E3, E4-S/S or E4-R/S neurons under long-term heparin treatment. In f, PHF1+ p-Tau levels were normalized to those of E4. TUJ1 was used as loading control (E4, n = 16; E4+heparin, n = 16; E3, n = 16; E3+heparin, n = 15; E4-S/S, n = 32; E4-S/S+heparin, n = 32; E4-R/S, n = 16; E4-R/S+heparin, n = 16). g, Experimental design for E4 neuron-conditioned medium treatment of human neurons with different APOE genotypes. h,i, Representative western blot images (h) and quantification of PHF1+ p-Tau levels (i) in lysates of E4, E3, E4-S/S or E4-R/S neurons after E4 neuron-conditioned medium treatment. In i, PHF1+ p-Tau levels were normalized to those of E4. TUJ1 was used as loading control (E4, n = 5; E3, n = 5; E4-S/S, n = 10; E4-R/S, n = 10). In f,i, n =biological replicates. Throughout, data are expressed as mean ± s.e.m. Differences between groups were determined by two-way ANOVA followed by Tukey’s multiple comparison test (b,c,f) or ordinary one-way ANOVA followed by Tukey’s multiple comparison test (i). Some comparisons of P ≤ 0.05 are labeled on the graph. Hep, heparin; fluor, fluorescence. Source data
Fig. 4
Fig. 4. The R136S mutation ameliorates APOE4-driven neurodegeneration in tauopathy mice.
a, Representative images of 10-month-old PS19-E4, PS19-E3, PS19-E4-S/S and PS19-E4-R/S mouse brain sections stained with Sudan black to enhance hippocampal visualization (scale bar, 1 mm). b,c, Quantification of hippocampal volume (WT, n = 11; PS19-E4, n = 31; PS19-E3, n = 23; PS19-E4-S/S, n = 20; PS19-E4-R/S, n = 23; n = mice) (b) and posterior lateral ventricle volume (PS19-E4, n = 30; PS19-E3, n = 23; PS19-E4-S/S, n = 20; PS19-E4-R/S, n = 23; n = mice) (c). d,e, Correlation of the APOE4-R136S gene copy number with the average of hippocampal volume (PS19-E4, n = 31; PS19-E4-S/S, n = 20; PS19-E4-R/S, n = 23; n = mice) (d) or the average of posterior lateral ventricle volume (PS19-E4, n = 30; PS19-E4-S/S, n = 20; PS19-E4-R/S, n = 23; n = mice) (e) in PS19-E4 mice with 0, 1 or 2 copies of the APOE4-R136S gene mutation. fi, Correlations between percent AT8 coverage area and hippocampal volume in 10-month-old PS19-E4 (n = 29) (f), PS19-E3 (n = 21) (g), PS19-E4-S/S (n = 19) (h) and PS19-E4-R/S (n = 22) (i) mice. j, Representative images of the DG stained for NeuN in 10-month-old PS19-E4, PS19-E3, PS19-E4-S/S and PS19-E4-R/S mice (scale bar, 100 μm). k, Quantification of DG GC layer thickness in 10-month-old PS19-E4 (n = 30), PS19-E3 (n = 23), PS19-E4-S/S (n = 20) and PS19-E4-R/S (n = 23) mice. Throughout, data are expressed as mean ± s.e.m. except for correlation plots. Differences between groups were determined by ordinary one-way ANOVA followed by Tukey’s multiple comparison test (b,k) or Welch’s ANOVA followed by Dunnett’s T3 multiple comparison test (c). Comparisons of P ≤ 0.05 are labeled on the graph. Pearson’s correlation analysis (two-sided). LV, lateral ventricle. Source data
Fig. 5
Fig. 5. The R136S mutation reduces APOE4-driven gliosis in tauopathy mice.
a,b, Representative images of GFAP immunostaining of astrocytes in the hippocampus of 10-month-old PS19-E4, PS19-E3, PS19-E4-S/S and PS19-E4-R/S mice (a) and quantification of the number of GFAP+ cells per mm2 (b) in the hippocampus of these mice and WT mice. c,d, Representative images of S100β immunostaining of astrocytes in the hippocampus of 10-month-old PS19-E4, PS19-E3, PS19-E4-S/S and PS19-E4-R/S mice (c) and quantification of the number of S100β+ cells per mm2 (d) in the hippocampus of these mice and WT mice. eh, Correlations between GFAP+ cells per mm2 and hippocampal volume in PS19-E4 (n = 31) (e), PS19-E3 (n = 23) (f), PS19-E4-S/S (n = 20) (g) and PS19-E4-R/S (n = 23) (h) mice. il, Correlations between S100β+ cells per mm2 and hippocampal volume in PS19-E4 (n = 31) (i), PS19-E3 (n = 23) (j), PS19-E4-S/S (n = 20) (k) and PS19-E4-R/S (n = 23) (l) mice. m,n, Representative images of Iba1 immunostaining of microglia in the hippocampus of 10-month-old PS19-E4, PS19-E3, PS19-E4-S/S and PS19-E4-R/S mice (m) and quantification of the number of Iba1+ cells per mm2 (n) in the hippocampus of these mice and WT mice. o,p, Representative images of CD68 immunostaining of microglia in the hippocampus of 10-month-old PS19-E4, PS19-E3, PS19-E4-S/S and PS19-E4-R/S mice (o) and quantification of the number of CD68+ cells per mm2 (p) in the hippocampus of these mice and WT mice. qt, Correlations between Iba1+ cells per mm2 and hippocampal volume in PS19-E4 (n = 31) (q), PS19-E3 (n = 23) (r), PS19-E4-S/S (n = 20) (s) and PS19-E4-R/S (n = 23) (t) mice. ux, Correlations between CD68+ cells per mm2 and hippocampal volume in PS19-E4 (n = 31) (u), PS19-E3 (n = 23) (v), PS19-E4-S/S (n = 20) (w) and PS19-E4-R/S (n = 23) (x) mice. For all quantifications in b,d,n,p, WT, n = 11; PS19-E4, n = 31; PS19-E3, n = 24; PS19-E4-S/S, n = 21; PS19-E4-R/S, n = 23. Scale bars, 500 µm in a,c,m,o. Throughout, data are expressed as mean ± s.e.m. In b,d,n,p, differences between groups were determined by Welch’s ANOVA followed by Dunnett’s T3 multiple comparison test. Comparisons of P ≤ 0.05 are labeled on the graph. Pearson’s correlation analysis (two-sided). Source data
Fig. 6
Fig. 6. snRNA-seq reveals protective effects of the R136S mutation on APOE4-driven neuronal and oligodendrocytic deficits in mice.
a, UMAP projection of 38 distinct cell clusters in hippocampi of 10-month-old PS19-E4 (n = 4), PS19-E3 (n = 3), PS19-E4-S/S (n = 4) and PS19-E4-R/S (n = 4) mice. b, Feature plot showing relative levels of normalized human APOE gene expression across all 38 hippocampal cell clusters by APOE genotype (PS19-E4, n = 4; PS19-E3, n = 3; PS19-E4-S/S, n = 4; PS19-E4-R/S, n = 4; n = mice). c, UMAP projection highlighting hippocampal cell clusters 1, 6, 7, 9 and 28 for each genotype group. d, Box plot of the proportion of cells from each sample in clusters 1, 6, 7, 9 and 28 in PS19-E4 (n = 4), PS19-E3 (n = 3), PS19-E4-R/S (n = 4), and PS19-E4-S/S (n = 4) mice. The lower, middle and upper hinges of the box plots correspond to the 25th, 50th and 75th percentiles, respectively. The upper whisker of the box plot extends from the upper hinge to the largest value no further than 1.5 Å~ IQR from the upper hinge. IQR, interquartile range, or distance between the 25th and 75th percentiles. The lower whisker extends from the lower hinge to the smallest value at most 1.5 Å~ IQR from the lower hinge. The LORs are the mean ± s.e.m. estimates of LOR for these clusters, which represents the change in the log odds of cells per sample from PS19-E3, PS19-E4-R/S or PS19-E4-S/S mice belonging to the respective clusters compared to the log odds of cells per sample from PS19-E4 mice. e,f, KEGG pathway enrichment dot plot of top 20 pathways significantly enriched for DE genes of neuronal cluster 6 in PS19-E4-S/S (e) or PS19-E4-R/S (f) versus PS19-E4 mice. P values are based on a two-sided hypergeometric test and are adjusted for multiple testing using the Benjamini–Hochberg method. Gene ratio represents the proportion of genes in the respective gene set that are deemed to be DE using the two-sided Wilcoxon rank-sum test as implemented in the FindMarkers function in Seurat. g, KEGG pathway enrichment dot plot of top 20 pathways significantly enriched for DE genes of oligodendrocyte cluster 9 versus oligodendrocyte cluster 2. h, Heat map plot of LOR per unit change in each pathological measurement for clusters 1, 6, 7, 9 and 28. The LOR represents the mean estimate of the change in the log odds of cells per sample from a given animal model, corresponding to a unit change in a given histopathological parameter. Associations with pathologies are colored (negative associations, blue; positive associations, red). P values in d are from fits to a GLMM_AM, and P values in h are from fits to a GLMM_histopathology; the associated tests are two-sided. All error bars represent s.e.m. Ex neuron, excitatory neuron; In neuron, inhibitory neuron.
Fig. 7
Fig. 7. The APOE4-R136S mutation increases disease-protective and decreases disease-associated astrocyte subpopulations.
a, UMAP projection of 12 astrocyte subclusters after subclustering hippocampal cell clusters 13 and 36 (Fig. 6a) from 10-month-old mice with different APOE genotypes. b, UMAP projection highlighting astrocyte subclusters 3, 5 and 7 for each genotype group (PS19-E4, n = 4; PS19-E3, n = 3; PS19-E4-S/S, n = 4; PS19-E4-R/S, n = 4; n = mice). c, Box plot of the proportion of cells from each sample in astrocyte subclusters 3, 5 and 7 in PS19-E4 (n = 4), PS19-E3 (n = 3), PS19-E4-R/S (n = 4), and PS19-E4-S/S (n = 4) mice. The lower, middle and upper hinges of the box plots correspond to the 25th, 50th and 75th percentiles, respectively (see Fig. 6d for details). The LORs are the mean ± s.e.m. estimates of LOR for these clusters, which represents the change in the log odds of cells per sample from PS19-E3, PS19-E4-R/S or PS19-E4-S/S mice belonging to the respective clusters compared to the log odds of cells per sample from PS19-E4 mice. LOR versus PS19-E4 for subcluster 3: PS19-E3, 0.67 ± 0.30; PS19-E4-S/S, 0.71 ± 0.27; subcluster 5: PS19-E4-S/S, −0.74 ± 0.34; subcluster 7: PS19-E4-R/S, −1.57 ± 0.57; PS19-E4-S/S, −2.75 ± 0.62. d, Dot plot of normalized average expression of selected homeostatic and DAA marker genes for astrocyte subclusters 3, 5 and 7. e, Volcano plot for top 30 DE genes of astrocyte subcluster 5 versus other astrocyte subclusters. f, Volcano plot for top 30 DE genes of astrocyte subcluster 5 in PS19-E4-S/S versus PS19-E4 mice. g, Volcano plot for top 30 DE genes of astrocyte subcluster 7 versus other astrocyte subclusters. h, Volcano plot for top 30 DE genes of astrocyte subcluster 7 in PS19-E4-S/S versus PS19-E4 mice. i, Representative images of Nkain2+GFAP+ astrocytes in the hippocampus of 10-month-old PS19-E4 (n = 9) and PS19-E4-S/S (n = 10) mice. j, Quantification of the number of Nkain2+GFAP+ cells (per mm2) within the molecular layer of hippocampus. k, Representative images of Id3+GFAP+ astrocytes in the hippocampus of 10-month-old PS19-E4 (n = 10) and PS19-E4-S/S (n = 10) mice. l, Quantification of the number of Id3+GFAP+ cells (per mm2) within the molecular layer of hippocampus. m, Heat map plot of LOR per unit change in each pathological measurement for astrocyte subclusters 3, 5 and 7. P values in c are from fits to a GLMM_AM, and P values in m are from fits to a GLMM_histopathology; the associated tests are two-sided. In eh, horizonal dashed line indicates P = 0.05, and vertical dashed lines indicate log2 fold change = 0.4. The unadjusted P values and log2 fold change values used were generated from the gene set enrichment analysis using the two-sided Wilcoxon rank-sum test as implemented in the FindMarkers function of the Seurat package. Gene names highlighted in red text indicate that they are selected marker genes for DAAs. Scale bars in i and k, 50 µm. All error bars represent s.e.m. Differences between groups in j and l were determined by unpaired, two-sided Welch’s t-test. AS, astrocyte; NS, not significant; FC, fold change. Source data
Fig. 8
Fig. 8. The APOE4-R136S mutation increases disease-protective and decreases disease-associated microglial subpopulations.
a, UMAP projection of 15 microglia subclusters after subclustering hippocampal cell clusters 17 and 19 (Fig. 6a) from 10-month-old mice with different APOE genotypes. b, UMAP projection highlighting microglia subclusters 2, 8 and 11 for each mouse genotype group (PS19-E4, n = 4; PS19-E3, n = 3; PS19-E4-S/S, n = 4; PS19-E4-R/S, n = 4; n = mice). c, Box plot of the proportion of cells from each sample in microglia subclusters 2, 8, and 11 in PS19-E4 (n = 4), PS19-E3 (n = 3), PS19-E4-R/S (n = 4), and PS19-E4-S/S (n = 4) mice. The lower, middle and upper hinges of the box plots correspond to the 25th, 50th and 75th percentiles, respectively (see Fig. 6d for details). The LORs are the mean ± s.e.m. estimates of LOR for these clusters, which represents the change in the log odds of cells per sample from PS19-E3, PS19-E4-R/S or PS19-E4-S/S mice belonging to the respective clusters compared to the log odds of cells per sample from PS19-E4 mice. LOR versus PS19-E4 for subcluster 2: PS19-E4-S/S, 3.02 ± 1.28; subcluster 8: PS19-E4-R/S, −2.58 ± 1.02; PS19-E4-S/S, −3.36 ± 1.17; subcluster 11: 2.69 ± 1.33. d, Dot plot of normalized average expression of selected homeostatic and DAM marker genes for microglia subclusters 2, 8 and 11. e, Volcano plot for top 30 DE genes of microglia subcluster 8 versus other microglia subclusters. f, Volcano plot for top 30 DE genes of microglia subcluster 8 in PS19-E4-S/S versus PS19-E4 mice. g, Representative images of Gpnmb+Iba1+ microglia in the hippocampus of 10-month-old PS19-E4 (n = 10) and PS19-E4-S/S (n = 10) mice. Scale bars, 50 µm. h, Quantification of the number of Gpnmb+Iba1+ cells (per mm2) within the DG of hippocampus. Difference between groups in h was determined by unpaired, two-sided Welch’s t-test. i, Heat map plot of LOR per unit change in each pathological measurement for microglia subclusters 2, 8 and 11. P values in c are from fits to a GLMM_AM, and P values in i are from fits to a GLMM_histopathology; the associated tests are two-sided. In e,f, horizonal dashed line indicates P = 0.05, and vertical dashed lines indicate log2 fold change = 0.4. The unadjusted P values and log2 fold change values used were generated from the gene set enrichment analysis using the two-sided Wilcoxon rank-sum test as implemented in the FindMarkers function of the Seurat package. Gene names highlighted in red text indicate that they are selected marker genes for DAMs. All error bars represent s.e.m. AS, astrocyte; FC, fold change; MG, microglia; NS, not significant. Source data
Extended Data Fig. 1
Extended Data Fig. 1. Generation of human APOE4-R136S knock-in mice and APOE4-R136S hiPSC lines by CRISPR/Cas-9-mediated gene editing.
a, Schematic of generating human APOE4-R136S knock-in (E4-S/S-KI) mice using CRISPR/Cas-9-mediated gene editing. b, Schematic of gene editing strategy to generate the R136S mutation in human E4-KI mice (with the loxP sites, unused in current gene-editing strategy) and to generate APOE4-R136S (E4-S/S) hiPSC lines (without the loxP sites). c, DNA sequences of WT human APOE4 loci encoding for R136, designed sgRNA, and single-stranded oligodeoxynucleotides donor repair template encoding for S136 and silent mutation at PAM site for generating E4-S/S-KI mice. d, Sanger DNA sequencing of WT APOE4 and APOE4-S/S at and near the site encoding for residue 136 in E4-S/S-KI mice. e, Summary of on-target R136S editing in APOE4 and potential off-target mutation screening for knock-in mice. f, Representative immunofluorescent images of APOE (green) and GFAP (red) in CA1 hippocampal subfield in E4-KI and E4-S/S-KI mice at 12 months of age (scale bar, 50 μm). g, DNA sequences of WT APOE4 loci encoding for R136, designed sgRNA, and single-stranded oligodeoxynucleotides donor repair template encoding for S136 and silent mutation at PAM site for generating E4-S/S hiPSC lines. h, Sanger DNA sequencing of WT E4, E4-S/S, and E4-R/S at and near the site encoding for residue 136 in hiPSC lines. i, Summary of on-target R136S editing in APOE4 and potential off-target mutation screening in hiPSC lines. Experiments depicted in representative images in f were performed on n = 3 mice per genotype using 2 brain sections per mouse, with reproducible data. WT, wildtype; sgRNA, single guide RNA; ssODN, single-stranded oligodeoxynucleotide.
Extended Data Fig. 2
Extended Data Fig. 2. Histopathological analyses of 10-month-old WT and 6-month-old PS19-E3, PS19-E4, PS19-E4-S/S, and PS19-E4-R/S mice.
a, Representative images of 10-month-old WT mouse (n = 11) brain sections stained with AT8 monoclonal antibody to visualize p-Tau (scale bar, 500 µm), Sudan black to enhance hippocampal visualization (scale bar, 1 mm), GFAP and S100β to measure astrocytosis (scale bar, 500 µm), and Iba1 and CD68 to measure microgliosis (scale bar, 500 µm). b,c, Representative images of 6-month-old PS19-E4, PS19-E3, PS19-E4-S/S, and PS19-E4-R/S mouse brain sections stained with AT8 antibody for p-Tau (scale bar, 500 µm) (b) or Sudan black (scale bar, 1 mm) (c). d, Representative images of GFAP and S100β immunostaining for astrocytes and reactive astrocytes, respectively, as well as Iba1 and CD68 immunostaining for microglia and reactive microglia, respective, in the hippocampus of 6-month-old PS19-E4, PS19-E3, PS19-E4-S/S, and PS19-E4-R/S mice. Scale bar, 500 µm. e–j, Quantification of % AT8 coverage area (e), hippocampal volume (f), % GFAP coverage area (g), % S100β coverage area (h), % Iba1 coverage area (i), and % CD68 coverage area (j). In a–j, PS19-E4, n = 12; PS19-E3, n = 11; PS19-E4-S/S, n = 12; PS19-E4-R/S, n = 9; n=mice. Experiments depicted in representative images in a–d were performed using 2 brain sections per mouse, with reproducible data. Throughout, data are expressed as mean ± s.e.m. Differences between groups were determined by ordinary one-way ANOVA followed with Dunnett’s multiple comparison test (e,f) or Welch’s ANOVA followed with Dunnett T3 multiple comparison test (g-j); comparisons of p ≤ 0.05 were labeled on graph. Source data
Extended Data Fig. 3
Extended Data Fig. 3. Characterization of E4-S/S and E4-R/S hiPSC lines and neuronal differentiation.
a, Karyogram of E4-S/S-A, E4-S/S-B, E4-S/S-C, E4-R/S-A, and E4-R/S-B hiPSC lines. For all cell lines, metaphase was examined for n = 20 cells per line. b, Representative immunofluorescent images of pluripotent stem cell markers Nanog, OCT3/4, SOX2, hNuclei, and TRA-1-60 from E4-S/S-A, E4-S/S-B, E4-S/S-C, E4-R/S-A, and E4-R/S-B hiPSC lines (scale bar, 100 μm). c, Representative immunofluorescent images of mature neuronal marker MAP2 (green) and DAPI (blue) in 3-week-old neurons differentiated from E4-S/S-A, E4-S/S-B, E4-S/S-C, E4-R/S-A, and E4-R/S-B hiPSC lines (scale bar, 20 μm). Representative images were selected from n = 3 fields of view from each cell line.
Extended Data Fig. 4
Extended Data Fig. 4. Measurement of neuronal uptake of Tau-488 by flow cytometry.
a, Internal controls of Tau-488 uptake assay as measured by median fluorescent intensity at 488 nm of live cell population (left) or % 488-positive live cell population (right) via flow cytometry. All values normalized to E4 cells at 37 °C, collected over separate experiments. Samples treated with Tau-488 are colored in green and samples treated with unlabeled tau are colored in white. E4 at 37 °C with Tau-488, n = 10; E4 at 37 °C with unlabeled Tau, n = 4; E4 at 4 °C with Tau-488, n = 18; E4 at 37 °C no Tau CTL, n = 7; n=independent experiment with unique biological samples. b, Gating strategy for Tau uptake assay. First, cells were gated on forward scatter/side scatter (FSC/SSC). Cells were then gated on forward scatter height (FSC-H) versus area (FSC-A) to discriminate doublets. Dead cells were removed from the analysis using nuclear stain with DAPI, and positive cells were determined by gating on a control (no Tau-488 added) population. c, Scatter plots of flow cytometry analysis of live cell population at 488 nm (FITC-A versus FSC-A) for E4, E3, E4-S/S, or E4-R/S neuronal cultures with or without the treatment with 100 µg/ml heparin. Roughly 1×10⁵ to 5×10⁵ events were recorded in each experiment. The live cell population analyzed was roughly 5000 cells for each sample. In a, data are expressed as mean ± s.e.m. Source data
Extended Data Fig. 5
Extended Data Fig. 5. Quantifications and correlations between % coverage area of glial markers and hippocampal volume in tauopathy mice.
a,b, Quantification of % GFAP (a) or % S100β (b) coverage area in hippocampus of 10-month-old PS19-E4, PS19-E3, PS19-E4-S/S, and PS19-E4-R/S mice. c–f, Correlation between % GFAP coverage area and hippocampal volume in PS19-E4 (n = 31) (c), PS19-E3 (n = 23) (d), PS19-E4-S/S (n = 20) (e), and PS19-E4-R/S (n = 23) (f) mice at 10 months of age. g–j, Correlation between % S100β coverage area and hippocampal volume in PS19-E4 (n = 31) (g), PS19-E3 (n = 23) (h), PS19-E4-S/S (n = 20) (i), and PS19-E4-R/S (n = 23) (j) mice at 10 months of age. k,l, Quantification of % Iba1 (k) or % CD68 (l) coverage area in hippocampus of 10-month-old PS19-E4, PS19-E3, PS19-E4-S/S, and PS19-E4-R/S mice. m–p, Correlation between % Iba1 coverage area and hippocampal volume in PS19-E4 (n = 31) (m), PS19-E3 (n = 23) (n), PS19-E4-S/S (n = 20) (o), and PS19-E4-R/S (n = 23) (p) mice at 10 months of age. q–t, Correlation between % CD68 coverage area and hippocampal volume in PS19-E4 (n = 31) (q), PS19-E3 (n = 23) (r), PS19-E4-S/S (n = 20) (s), and PS19-E4-R/S (n = 23) (t) mice at 10 months of age. For all quantifications in a,b,k,l, WT, n = 11; PS19-E4, n = 31; PS19-E3, n = 24; PS19-E4-S/S, n = 21; PS19-E4-R/S, n = 23. In a,b,k,l, data are expressed as mean ± s.e.m. and differences between groups were determined by Welch’s ANOVA followed with Dunnett T3 multiple comparison test; comparisons of p ≤ 0.05 were labeled on graph. Pearson’s correlation analysis (two-sided). Source data
Extended Data Fig. 6
Extended Data Fig. 6. Quality control measures in snRNA-seq analysis of tauopathy mice with different APOE genotypes.
a, Dot-plot depicting normalized average expression of selected cell identity marker genes for all 38 distinct hippocampal cell clusters from mice at 10 months of age. b, Cluster identity of 38 distinct cell types. c, The number of cells per cluster. d, The number of genes per cell in each cluster (± s.e.m). e, The number of nUMI (unique molecular identified) per cell in each cluster (± s.e.m). f, The % mitochondrial genes per cell in each cluster (± s.e.m). Number of cells (n) for each cell cluster can be found in c. For details of the analyses, see Methods.
Extended Data Fig. 7
Extended Data Fig. 7. snRNA-seq analysis of disease-protective neuronal clusters and disease-associated oligodendrocyte cluster.
a,b, KEGG pathway enrichment dot-plot of top 20 pathways significantly enriched for DE genes of neuronal cluster 1 in PS19-E4-S/S (a) or PS19-E4-R/S (b) versus PS19-E4 mice at 10 months of age. c,d, KEGG pathway enrichment dot-plot of top 20 pathways significantly enriched for DE genes of neuronal cluster 7 in PS19-E4-S/S (c) or PS19-E4-R/S (d) versus PS19-E4 mice at 10 months of age. e,f, KEGG pathway enrichment dot-plot of top 20 pathways significantly enriched for DE genes of neuronal cluster 28 in PS19-E4-S/S (e) or PS19-E4-R/S (f) versus PS19-E4 mice at 10 months of age. g, Dot-plot normalized average expression of selected homeostatic and disease-associated oligodendrocyte (DAO) marker genes for oligodendrocyte clusters 2, 3, and 9. h, Volcano plot for top DE genes of oligodendrocyte cluster 9 versus cluster 2. i, Volcano plot for top DE genes of oligodendrocyte cluster 9 in PS19-E4-S/S versus PS19-E4 mice at 10 months of age. j, Representative images of Kirrel3+ Olig2+ oligodendrocytes in the hippocampus of 10-month-old PS19-E4 and PS19-E4-S/S mice at 10 months of age. Scale bars are 25 µm. k, Quantification of the number of Kirrel3+ Olig2+ oligodendrocytes (per mm2) within the dentate gyrus of hippocampus in 10-month-old PS19-E4 (n = 10) and PS19-E4-S/S (n = 10) mice at 10 months of age. In a–f, P-values are based on a two-sided hypergeometric test and are adjusted for multiple testing using the Benjamini-Hochberg method. Gene ratio represents the proportion of genes in the respective gene set that are deemed to be differentially expressed using the two-sided Wilcoxon Rank-Sum test as implemented in the FindMarkers function in Seurat. In h,i, horizonal dashed line indicates p-value = 0.05 and vertical dashed lines indicate log2 fold change = 0.4. All error bars represent s.e.m. Difference between groups in k was determined by unpaired, two-sided Welch’s t-test. DE, differentially expressed; NS, nonsignificant; FC, fold change. For details of the analyses, see Methods. Source data
Extended Data Fig. 8
Extended Data Fig. 8. snRNA-seq analysis of astrocyte and microglia subclusters.
a, Feature plot showing relative levels of normalized human APOE gene expression across all 12 astrocyte subclusters by APOE genotype from mice at 10 months of age. b–d, KEGG pathway enrichment dot-plot of top 20 pathways significantly enriched for DE genes of astrocyte subclusters 3 (b), 5 (c), and 7 (d) versus other astrocyte subclusters. e, Feature plot showing relative levels of normalized human APOE gene expression across all 15 microglia subclusters by APOE genotype from mice at 10 months of age. f–h, KEGG pathway enrichment dot-plot of top 20 pathways significantly enriched for DE genes of microglia subclusters 2 (f), 8 (g), and 11 (h) versus other microglia subclusters. In b–d and f–h, P-values are based on a two-sided hypergeometric test and are adjusted for multiple testing using the Benjamini-Hochberg method. Gene Ratio represents the proportion of genes in the respective gene set that are deemed to be differentially expressed using the two-sided Wilcoxon Rank-Sum test as implemented in the FindMarkers function in Seurat.
Extended Data Fig. 9
Extended Data Fig. 9. The R136S mutation reduces APOE4-induced neutral lipid accumulation in astrocytes and microglia in tauopathy mice.
a, Representative images of neutral lipid visualized with BODIPY staining in GFAP+ astrocytes in the dentate gyrus of hippocampus in PS19-E4, PS19-E3, PS19-E4-S/S, and PS19-E4-R/S mice at 10 months of age (example overlap shown in red arrows). b, Quantification of the fraction of BODIPY+ GFAP+ cells per total GFAP+ cells in the dentate gyrus of hippocampus in PS19-E4, PS19-E3, PS19-E4-S/S, and PS19-E4-R/S mice at 10 months of age. c, Representative images of neutral lipid visualized with BODIPY staining in Iba1+ microglia in the dentate gyrus of hippocampus in PS19-E4, PS19-E3, PS19-E4-S/S, and PS19-E4-R/S mice at 10 months of age (example overlap shown in white arrows). d, Quantification of the fraction of BODIPY+ Iba1+ cells per total Iba1+ cells in the dentate gyrus of hippocampus in PS19-E4, PS19-E3, PS19-E4-S/S, and PS19-E4-R/S mice at 10 months of age. In a and c, scale bars are 50 µm. In b and d, PS19-E4, n = 10; PS19-E3, n = 10; PS19-E4-S/S, n = 10; PS19-E4-R/S, n = 10; n=mice. In b,d, data are expressed as mean ± s.e.m. and differences between groups were determined by Welch’s ANOVA followed with Dunnett T3 multiple comparison test; comparisons of p ≤ 0.05 were labeled on graph. DE, differentially expressed; AS, astrocyte; MG, microglia. For details of the analyses, see Methods. Source data
Extended Data Fig. 10
Extended Data Fig. 10. PCA clustering of selected hippocampal cell clusters as well as astrocyte and microglia subclusters against all measured pathologies.
Principal component analysis plot for hippocampal clusters 1, 6, 7, 9, 28, astrocyte subclusters 3, 5, 7, and microglia subclusters 2, 8, 11 against all measured pathologies (hippocampal volume and coverage areas of AT8, Iba1, CD68, GFAP, and S100β). PC1 and PC2 showed the overall relationship between clusters based on similarity of the estimated log odds ratio per unit change in six pathologies per cluster/subcluster. AS, astrocyte; MG, microglia. For details of the analyses, see Methods.

References

    1. Huang Y, Mucke L. Alzheimer mechanisms and therapeutic strategies. Cell. 2012;148:1204–1222. - PMC - PubMed
    1. Mahley RW, Weisgraber KH, Huang Y. Apolipoprotein E4: a causative factor and therapeutic target in neuropathology, including Alzheimer’s disease. Proc. Natl Acad. Sci. USA. 2006;103:5644–5651. - PMC - PubMed
    1. Huang Y, Mahley RW. Apolipoprotein E: structure and function in lipid metabolism, neurobiology, and Alzheimer’s diseases. Neurobiol. Dis. 2014;72PA:3–12. - PMC - PubMed
    1. Koutsodendris N, Nelson MR, Rao A, Huang Y. Apolipoprotein E and Alzheimer’s disease: findings, hypotheses, and potential mechanisms. Annu. Rev. Pathol. 2022;17:73–99. - PubMed
    1. Harris FM, Brecht WJ, Xu Q, Mahley RW, Huang Y. Increased tau phosphorylation in apolipoprotein E4 transgenic mice is associated with activation of extracellular signal-regulated kinase: modulation by zinc. J. Biol. Chem. 2004;279:44795–44801. - PubMed