. 2023 Dec;26(12):2182-2191.
doi: 10.1038/s41593-023-01485-3. Epub 2023 Nov 13.

Meta-reinforcement learning via orbitofrontal cortex

Affiliations

Meta-reinforcement learning via orbitofrontal cortex

Ryoma Hattori et al. Nat Neurosci. 2023 Dec.

Erratum in

Abstract

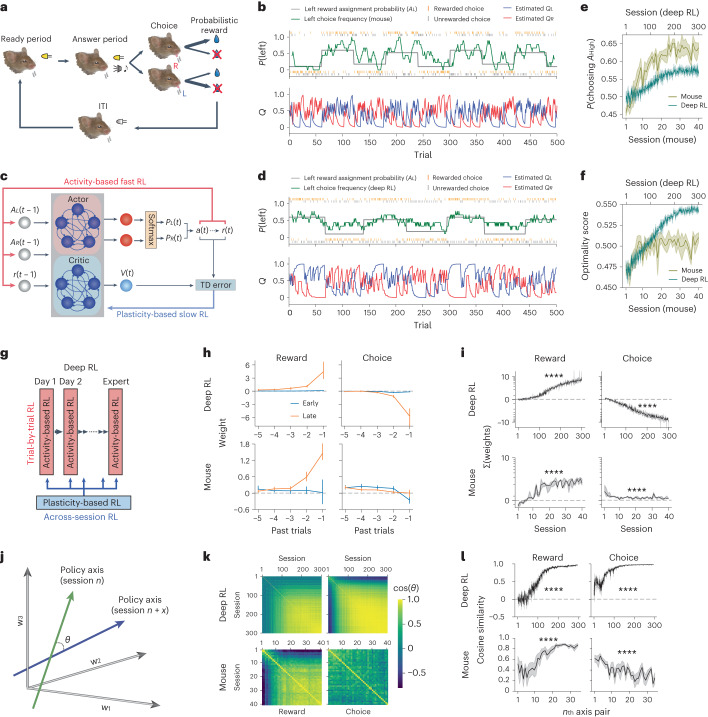
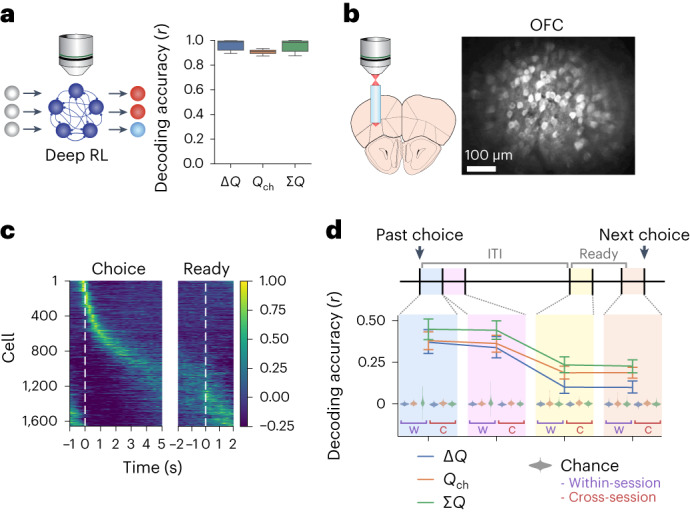
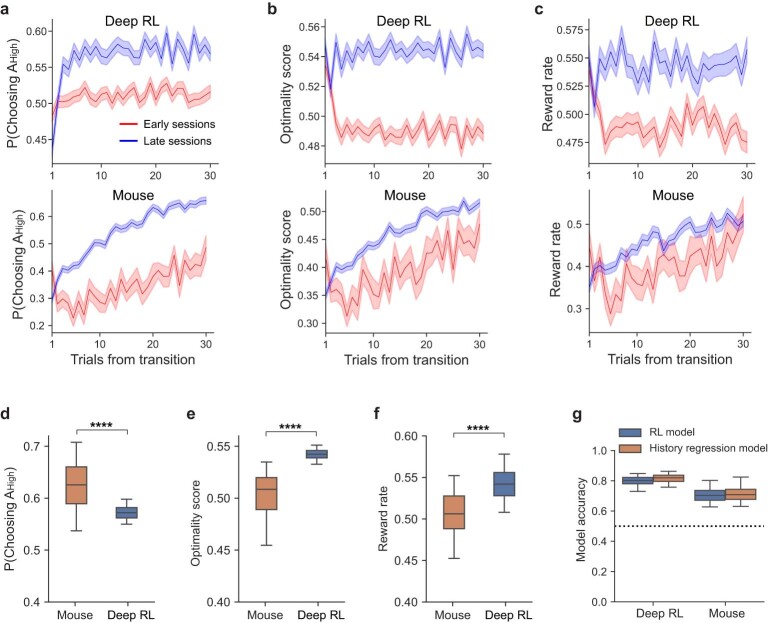
The meta-reinforcement learning (meta-RL) framework, which involves RL over multiple timescales, has been successful in training deep RL models that generalize to new environments. It has been hypothesized that the prefrontal cortex may mediate meta-RL in the brain, but the evidence is scarce. Here we show that the orbitofrontal cortex (OFC) mediates meta-RL. We trained mice and deep RL models on a probabilistic reversal learning task across sessions during which they improved their trial-by-trial RL policy through meta-learning. Ca2+/calmodulin-dependent protein kinase II-dependent synaptic plasticity in OFC was necessary for this meta-learning but not for the within-session trial-by-trial RL in experts. After meta-learning, OFC activity robustly encoded value signals, and OFC inactivation impaired the RL behaviors. Longitudinal tracking of OFC activity revealed that meta-learning gradually shapes population value coding to guide the ongoing behavioral policy. Our results indicate that two distinct RL algorithms with distinct neural mechanisms and timescales coexist in OFC to support adaptive decision-making.


Conflict of interest statement

The authors declare no competing interests.

Figures

Fig. 1
Fig. 1. Meta-learning of RL.
a, Schematic of the behavior task for mice. b, Example mouse behavior in an expert session (top) and the estimated left and right action values from an RL model in each trial (bottom). Choice frequency was calculated using nine-trial sliding windows. c, Schematic of the deep RL that implements meta-RL. d, Example behavior of a trained deep RL. e, Mean probability of choosing the side with a higher reward assignment probability. Note that the reward assignment probability is not equal to the reward probability in individual trials because a reward, once assigned, remains available until consumed. f, Mean optimality score that measures the optimality of action policy in this task considering the cumulative nature of reward availability. g, Schematic illustrating the meta-RL mechanism in the deep RL. Deep RL updates action values on each trial using recurrent activity, and the action policy (that is, the way they compute the values) is gradually updated by synaptic plasticity across sessions based on the performance evaluation on each session. h, Mean history regression weights in early (deep RL, ≤100th; OFC, day 1–14) and late (deep RL, ≥230th; OFC, ≥day 15) sessions. Mean weight was calculated using the early or late sessions for each individual, and the mean ± 95% CI of the means across models/mice is shown. i, Sum of the history weights of the five past trials (median ± s.e.). Both mice and deep RL models learned to use reward history for decision-making. Weights are plotted along a symmetric log scale where only the range between the minor ticks closest to 0 is linear scale (‘symlog’ option in matplotlib in Python). Deep RL (reward, P < 1 × 10−100; choice, P < 1 × 10−100), mouse (reward, P = 5.01 × 10−45; choice, P = 1.00 × 10−7). j, Angle between policy axes from different sessions was measured to quantify the similarity of action policies. k, Cosine similarity of policy axes between different pairs of training sessions. l, Cosine similarity between the policy axis on the nth session and the mean policy axis of the following 5 d (n + 1 − n + 5). Deep RL (reward, P < 1 × 10−100; choice, P < 1 × 10−100), mouse (reward, P = 4.1 × 10−21; choice, P = 2.58 × 10−5). Shadings and error bars indicate s.e. and 95% CI, respectively. Statistics in i and l are from mixed-effects models (session number as the fixed effect, subjects as the random intercept, two-sided test). NS P > 0.05, ****P < 0.0001. Five independently trained deep RL models and seven mice used for OFC imaging are included in e, f, h, i, k, and l. NS, not significant. Source data
Fig. 2
Fig. 2. OFC plasticity is required for across-session meta-learning of RL.
a, Schematics of optogenetic suppression of synaptic plasticity with paAIP2. b, Virally transfected neurons expressing mEGFP and paAIP2 in a cortical organotypic slice. Right, a field-of-view from lateral orbitofrontal cortex showing transfected pyramidal neurons. c, Top, representative control paAIP2-labeled dendritic shaft of the OFC neuron in which LTP induction using two-photon uncaging without paAIP2 stimulation showed an increase in the spine volume. Bottom, a representative dendritic shaft of the OFC neuron expressing mEGFP and paAIP2 in which LTP induction during blue light stimulation did not show any structural change. Fluorescence intensity of mEGFP was used to measure the spine volume change. For structural long-term potentiation (sLTP) experiments, we transfected slices nine independent times from which we recorded 16 cells in each condition. We obtained similar results as represented in b and c for these nine independent slices. d, Average (mean ± s.e.m.) time course summary of all spines from paAIP2-labeled OFC neurons where LTP was induced successfully without light (gray, 16 spines from 8 neurons) but failed when stimulated with light (blue, 16 spines from 8 neurons). e, Bar graphs showing mean transient volume change (volume change averaged over 0–2 min (mean ± s.e.m.), unpaired t test, t(30) = 4.17, P = 0.0002) and sustained volume change (volume change averaged over 12–14 min (mean ± s.e.m.), unpaired t test, t(30) = 3.252, P = 0.0028). Asterisk denote statistical significance. f, Histology image showing paAIP2 expression and fiber-optic cannula targeting the lateral OFC (LO). Yellow dotted line indicates the location of cannula. We confirmed that all mice in paAIP2 groups (5 mice in Fig. 2 and 5 mice in Fig. 3) in this study show similar expression patterns as in this example. g, Mean probability of choosing the side with a higher reward assignment probability (early, P = 0.95; middle, P = 1.89 × 10−5; late, P = 5.36 × 10−6), and the optimality score (early, P = 0.66; middle, P = 1.38 × 10−2; late, P = 2.74 × 10−4). Mice with EGFP (black, five mice) or EGFP-P2A-paAIP2 (blue, five mice) virus injections. h, Summed history weights (medians) across training sessions. Compared separately for days 1–5, 6–20 and 21–30. Suppression of OFC plasticity during training impairs the learning of reward-based action policy. Reward (early, P = 0.41; middle, P = 1.58 × 10−8; late, P = 2.37 × 10−3), choice (early, P = 0.87; middle, P = 0.65; late, P = 0.27). i, Mean cosine similarity of policy axes between pairs of training sessions and its difference between control and paAIP2 mice. j, Mean cosine similarity between the policy axis on the nth session and the mean policy axis of the following 5 d. Reward (early, P = 0.43; middle, P = 1.08 × 10−9; late, P = 2.50 × 10−3), choice (early, P = 0.80; middle, P = 0.20; late, P = 1.51 × 10−3). Shadings and error bars indicate s.e. and 95% CI, respectively. Statistics in g, h and j are from mixed-effects models (session number as the fixed effect, subject as the random intercept). Aligned rank transform for h. All tests are two-sided. NS P > 0.05, *P < 0.05 , **P < 0.01, ***P < 0.001, ****P < 0.0001. DLO, dorsolateral OFC; VO, ventral OFC. Source data
Fig. 3
Fig. 3. Trial-by-trial RL is independent of CaMKII-dependent synaptic plasticity in OFC.
Photoactivation of paAIP2 on every other session in expert mice (five mice, blue shadings indicate photoactivation sessions). a, Summed history weights in individual expert sessions. b, Pairwise comparisons of the photoactivation effects. Each line indicates the mean per mouse. Suppression of OFC plasticity in expert mice does not affect history-based action policy and task performance. Shadings and error bars indicate s.e.m. and 95% CI, respectively. All statistics are from mixed-effects models (virus as the fixed effect, session as the random intercept, subject as the random slope, two-sided). NS P > 0.05. Source data
Fig. 4
Fig. 4. OFC activity robustly encodes value signals.
a, Decoding accuracy of value-related signals from recurrent units of trained deep RL models (230th–301st sessions from five independently trained networks). The mean activity of the three time steps immediately before choice was used. The box shows the quartiles, and the whiskers extend to the 5th and 95th percentiles. b, Example calcium signals in OFC (max-intensity projection). c, Trial-averaged activity of OFC neurons, aligned to choice (left) or the start of the ready period (right). Cells were sorted by the peak activity timing from half of the recorded trials, and the mean activity in the other half of the trials is shown. Cells from 14 unique populations (seven mice, two planes each) were pooled. Activity of each cell was normalized to its trial-averaged peak. For each unique population, only a single expert session with the best ΔQ decoding accuracy at the ready period was included for this plot. d, Decoding accuracy of value-related signals from OFC population activity (subsampled 55 cells per population) at different trial periods (mean ± 95% CI). The updated value signals are available in OFC until the next choice. All sessions after ≥14 d of training were analyzed for all mice. To minimize spurious correlations of slowly varying neural signals and value, we decoded the change in value from change in neural activity between adjacent trials. Chance decoding accuracy was obtained by shuffling behavior labels across trials for each session (within-session) or decoding unshuffled behavior labels from different sessions (cross-session). The chance distributions are shown as kernel densities. All accuracies were significantly above chance (P < 1 × 10−100, mixed-effects model with shuffling as the fixed effect, neural population as the random intercept, two-sided). Source data
Fig. 5
Fig. 5. OFC activity is necessary for trial-by-trial RL.
a, Inactivation of the recurrent activity of deep RL models at the prechoice time step impairs behavioral dependence on history (30% of cells were inactivated, P < 1 × 10−10 for both). Mean regression weights of 50 sessions (top), and the sum of each type of history weights from the past five trials (bottom). b, Schematics and a histology image for bilateral OFC inactivation. Inactivation was performed in ~13% of trials throughout the duration of ITI (0.5 s delay) and ready period. Yellow dotted line indicates the location of the cannula. c, Bilateral optogenetic inactivation of OFC impairs reward history dependence. Mean regression weights for mice with ChrimsonR-tdTomato (top), and the sum of each type of history weights from the past five trials for mice with ChrimsonR-tdTomato or only tdTomato (bottom). Different colors of thin lines indicate different mice. Black, control trials; red, light-on trials. Inactivation impairs reward history dependence (P = 8.01 × 10−4). d, Mean inactivation effects on the size of history-independent action bias for deep RL and mice. Black, control trials; red, inactivation trials. Inactivation increased dependence on the bias in both mice (P = 0.018) and deep RL (P < 1 × 10−10). All error bars are 95% CI. All statistics are from mixed-effects model with aligned rank transform (inactivation as the fixed effect, subject as the random slope, session as the random intercept for mice; inactivation as the fixed effect, session as the random intercept for deep RL). All tests are two-sided. NS P > 0.05, *P < 0.05, ***P < 0.001, ****P < 0.0001. ChrimsonR-tdTomato (6 mice, 43 sessions) and tdTomato (5 mice, 30 sessions) for c and d. Source data
Fig. 6
Fig. 6. History-independent action bias is independent of OFC.
a, Unilateral OFC inactivation, alternating the side of inactivation every session. The impact on the history-independent bias direction in an example mouse (ΔBias = (bias in inactivated trials) − (bias in control trials)) is shown. b, Mean effects of unilateral OFC inactivation on history dependence (4 mice, 177 sessions). Black, control trials; red, inactivation trials. Similarly to bilateral inactivation, behavioral dependence on reward history was impaired by unilateral inactivation (P = 0.018). c, Unilateral inactivation increased the size of the mean unsigned bias (P = 0.030). d, The direction of the bias did not depend on the side of unilateral inactivation. The box shows the quartiles, and the whiskers extend to the 5th and 95th percentiles. e, Mean bias direction across days. The sign of ΔBias was flipped for those with negative ΔBias at day 0. The direction of enhanced bias was generally consistent for several days. f, Action selection based on reward history requires OFC. When OFC is inactivated, history-independent action bias dictates action selection. All error bars are 95% CI. All statistics are from mixed-effects model with aligned rank transform (inactivation as the fixed effect, subject as the random slope, session as the random intercept, two-sided). NS P > 0.05, *P < 0.05. In total, 177 sessions from 4 mice are used for be. Source data
Fig. 7
Fig. 7. Dynamics and stabilization of OFC value coding during meta-learning.
a, Longitudinal tracking of neural populations across sessions (5 deep RL models, 14 OFC populations). Scale bar = 100 µm. This figure focuses on the activity at postchoice period (0–1 s for mice, the time point after choice for deep RL). Analyses at other trial periods are shown in Extended Data Figs. 9 and 10. b, Decoding accuracy of value-related signals increases during training. All 100 recurrent units were used for deep RL models, and OFC neurons were subsampled (55 cells per population). Shadings indicate s.e.m. Statistics are from mixed effects models with session as the fixed effect and neural population as the random intercept. Deep RL (ΔQ, P = 7.08 × 10−202; Qch, P = 1.72 × 10−99; ∑Q, P = 1.21 × 10−110), mouse (ΔQ, P = 0.22; Qch, P = 8.53 × 10−19; ∑Q, P = 3.24 × 10−14). c, Relationships between the decoding accuracy and the strength of behavioral dependence on reward history (sum of unsigned regression weights). Kernel density estimation of the distributions (deep RL), and scatterplots with different colors for 14 different OFC populations. For deep RL, early sessions (<100th) were excluded due to their unstable decoding accuracy. Regression lines and statistics are from mixed effects models (accuracy as the fixed effect, neural population as the random intercept). Deep RL (ΔQ, P = 3.92 × 10−73; Qch, P = 1.76 × 10−63; ∑Q, P = 6.72 × 10−58), mouse (ΔQ, P = 0.13, Qch, P = 6.75 × 10−16; ∑Q, P = 1.26 ×;10−6). d, Angle between coding axes for shared neurons from adjacent sessions (1 session apart for deep RL, 2 d apart for OFC) was measured to quantify the similarity of population coding for value-related signals. Cosine similarity of the coding axes increases during training in both deep RL and mouse OFC. Shadings indicate s.e.m. Statistics are from mixed effects models with session pair as the fixed effect and neural population as the random intercept. Deep RL (ΔQ, P = 2.18 × 10−39; Qch, P = 6.14 × 10−140; ∑Q, P = 1.53 × 10−154), mouse (ΔQ, P = 2.55 × 10−3; Qch, P = 7.53 × 10−11; ∑Q, P = 3.13 × 10−7). e, Relationships between the angle of coding axes for values and the angle of action policy axes for reward history in pairs of sessions. The similarity in coding axes correlates with the similarity in behavioral action policies. Deep RL (ΔQ, P = 3.60 × 10−39; Qch, P = 4.35 × 10−113; ∑Q, P = 3.78 × 10−102), mouse (ΔQ, P = 9.83 × 10−4; Qch, P = 3.56 × 10−10; ∑Q, P = 3.02 × 10−6). Statistics are from mixed effects models with coding axis angle as the fixed effect and neural population as the random intercept. NS P > 0.05, **P < 0.01, ***P < 0.001, ****P < 0.0001. All tests are two-sided. Source data
Extended Data Fig. 1
Extended Data Fig. 1. Task engagement was consistent in mice across training sessions.
a, Mean number of choice trials per session. b, Mean frequency of alarm trials (licking during ready period). c, Mean frequency of miss trials (trials where mice did not make a choice during the 2 sec answer period). d, Reaction time in choice trials (across-animal averaging of median reaction time). All error bars indicate 95% CI. Only the 7 mice used for OFC imaging were included. Source data
Extended Data Fig. 2
Extended Data Fig. 2. Choice adaptability after probability block transition, and the performance comparison between mice and deep RL models.
a, Mean probability of choosing the side with a higher reward assignment probability after block transition (Deep RL: ≤100th session for early and 230th−301st sessions for late; Mouse: ≤ 5th session for early and ≥15th session for late). Shadings indicate s.e.m. b, Mean optimality score after block transition. c, Mean reward rate after block transition. This reward rate is mere a noisier measure of (b) due to the probabilistic nature of the reward assignment. Therefore, we used the quantities of (a) and (b) for most task performance quantifications. df, Performance comparisons between deep RL (230th–301st sessions) and mice (≥15th session). Two-sided Wilcoxon rank-sum test. The box shows the quartiles, and the whiskers extend to 5th and 95th percentiles. Mice developed an action policy to preferentially select the side with higher reward assignment probability, while deep RL outperformed mice by utilizing the cumulative nature of the reward availability on the unchosen side as reflected on the optimality score. This action policy difference is reflected on their choice history dependence (see Fig. 1h for choice alternation only in deep RL). g, Choice prediction accuracy by RL model and history regression model for expert sessions (Deep RL: ≥ 230th session, mice: ≥ 15th session). The RL model predicts choices as well as the regression model despite fewer parameters for both mice and deep RL models. The box shows the quartiles, and the whiskers extend to 5th and 95th percentiles. Data from 5 independently trained deep RL models and 7 mice used for OFC imaging are used for a-g. The ≥ 15th session group of the 7 mice consisted of 292 sessions in total. ****P < 0.0001. Source data
Extended Data Fig. 3
Extended Data Fig. 3. CaMKII inhibition by paAIP2 blocks dendritic spine plasticity in M1 during motor learning in vivo without affecting the spine density and dendritic structure.
a, Schematic of behavior and imaging setup. Left, mice expressing either EGFP or both EGFP and paAIP2 were subjected to 2-photon imaging prior to behavioral training. Right, during training, blue light was directed into the cranial window. b, Top, behavioral paradigm. An auditory cue is presented, after which the lever must be pressed past both the smaller (red dotted line) and larger (green dotted line) thresholds in order to receive a water reward. Blue light is on during all cue periods. Bottom, longitudinal experimental schedule. Imaging was performed prior to behavior on sessions 1, 11, 12, 13, and 14. For each field of view, of the 11th-14th session, one with the best image quality was chosen and used as the late session. Blue light was presented during every session. c, Selected examples of spine enlargement in EGFP control animals. Unfilled arrowheads demarcate the spines of interest prior to enlargement. Filled arrowheads indicate the spines after enlargement in late imaging sessions. d, Example images illustrating the prevalence of spine enlargement along dendrites in EGFP controls and paAIP2-expressing mice. Demarcated spines are those showing >= 1.5× volume relative to session 1. Filled and unfilled arrows demarcate spines before and after enlargement, respectively. The probability of spine enlargement shown here is comparable to the average values reported in g. e, Spine volume measurements from late sessions of training relative to the first session of training. Data points correspond to individual spines. Only spines present in both early and late sessions (‘stable spines’) are shown. Colors represent individual animals. The median value of each animal (color-coded horizontal bars) as well as the median of these values for each group (black bars with centripetal arrowheads) are shown. Black dotted line corresponds to a relative spine volume of 1, indicating stable spine size over the experiment. Red dotted line indicates the spine enlargement threshold (1.5× session 1 size) used in subsequent analyses. n = 449 stable spines / 25 dendritic segments / 5 neurons / 4 mice for EGFP controls, n = 308 stable spines, 18 dendritic segments / 5 neurons / 4 mice for paAIP2. f, Histograms of changes in spine size over motor learning for EGFP- (gray) and paAIP2 (light blue)- expressing mice. Both groups show a primary peak at 1, indicating that a majority of spines are relatively stable in their size. The median relative spine size in EGFP controls (1.08, 95% CI = [1.04 1.11]) is nonetheless higher than for paAIP2-expressing mice (0.98, 95% CI = [0.93, 1.03]; p = 1e-04, rank-sum test). A pronounced upper tail is apparent in the EGFP distribution. Inset, corresponding cumulative data distributions for EGFP- (black) and paAIP2- (light blue) expressing mice. The distributions are significantly different (p = 7e-05, Kolmogorov-Smirnoff test), and the lower representation of spine enlargement (>1.5×, red dotted line) in the paAIP2 animals is apparent. Statistical tests are two-sided g, Summary of motor learning-related changes in spine size by animal. Left, mean changes in spine size are reduced in paAIP2-expressing animals (p = 0.003, two-sample t-test). Data points correspond to the mean of all measured spines for each animal. n = 449 stable spines / 25 dendritic segments / 5 neurons / 4 mice for EGFP controls, n = 308 stable spines, 18 dendritic segments / 5 neurons / 4 mice for paAIP2. The means of animals for each group are plotted as color-coded horizontal bars. Error bars correspond to mean ± SEM across animals. Right, the probability of spine enlargement (> 1.5×) is significantly lower in paAIP2-expressing animals (p = 5e-05, chi-square test of proportions). Mean ± SEM. Note that the nonzero enlargement probability in paAIP2 animals indicates that plasticity is still occurring, albeit at a lowered level. Statistical tests are two-sided. h, Example in vivo images illustrating the viability of paAIP2-expressing neurons across multiple imaging sessions. Left, example in vivo images of a dendrite in early and late imaging sessions. Zoomed-in versions of the selected dendritic segment (red box) on both sessions are shown at bottom. Right, an extracted portion of the dendrite demarcated at left. The majority of spines are stable, and there is no apparent sign of diminishing dendritic health. Images are shown as color-coded by depth to illustrate out-of-plane structures. i, Overall spine density is comparable between EGFP- and paAIP2-expressing mice, and is stable over time. Individual dendritic segments used in this analysis are shown as partially transparent points/lines for both early and late sessions, color-coded by animal. The median spine density for each animal is plotted as color-matched opaque lines. The medians across animals are plotted as black lines. There is no main effect of training session (that is early vs. late, p = 0.47; 2-way ANOVA) nor of transgene (that is EGFP vs. paAIP2, p = 0.38; 2-way ANOVA) on spine density. Further, there is no significant interaction between training session and transgene. Together, these data illustrate that spine density is stable over training, irrespective of the transgene being expressed. n = 628 spines / 20 dendritic segments / 4 mice for EGFP controls; n = 614 spines / 23 dendritic segments / 4 mice for paAIP2. The mean dendritic segment length was 50 ± 7μm for EGFP and 50 ± 10μm for paAIP2. j, Example in vivo images illustrating spine turnover in EGFP control mice. Both spine formation (cyan arrows) and spine elimination (red arrows) are apparent on the dendritic segment shown. Unfilled arrows indicate the location of future formation or elimination; filled arrows indicate the corresponding state in the late learning session. k, Summary of spine turnover in EGFP- and paAIP2-expressing mice. Left, new spine density measured along dendritic segments (each data point represents 1 dendritic segment) from late imaging sessions for each animal (color-coded data points). The median density and 95% confidence intervals (after first taking the median of each animal) are shown in black (EGFP: median 8 new spines / 100μm, 95% CI: [3, 9]; paAIP2: median 1 new spine / 100μm, 95% CI: [0, 5]). When considering individual dendrites as a sample, EGFP-expressing dendrites show a significantly higher new spine density (p = 4e-05, rank-sum test). When considering animals as a sample, there is a trend in the same direction (p = 0.057, rank-sum test). Right, density of spine elimination events along the same dendritic segments. Elimination density is comparable between EGFP dendrites (median = 3 eliminations / 100μm) and paAIP2 dendrites (median = 2 eliminations / 100μm), showing no significant difference when considering individual dendrites (p = 0.93, rank-sum test) or animals (p = 1, rank-sum test) as samples. n = 67 new spines / 33 eliminated spines / 20 dendritic segments / 4 mice for EGFP controls; n = 19 new spines / 31 eliminated spines / 23 dendritic segments / 4 mice for paAIP2. All tests are two-sided.
Extended Data Fig. 4
Extended Data Fig. 4. Suppression of OFC plasticity delays the improvement in the choice adaptability after each probability block transition during training, but the same manipulation in expert mice did not impair their choice adaptability.
a, Probability of choosing the side with a higher reward assignment probability after probability block transition for different learning phases (Day 1–5: p = 0.44, Day 6–20: 2.40 × 10⁻¹⁶, Day 21–30: 1.12 × 10⁻⁴). b, Optimality score after probability block transition for different learning phases (Day 1–5: p = 0.25, Day 6–20: 1.41 × 10⁻⁷, Day 21–30: 5.22 × 10⁻³). c, The same probabilities for paAIP2-expressing mice that received photoactivation only after achieving expert performance. This mouse group is separate from the group used in (a and b). Sessions with [photoactivation + masking light] and [masking light only] were alternated for 20 sessions. Although OFC plasticity suppression delayed the across-session meta-learning, it did not affect the trial-by-trial RL of expert mice. Shadings indicate s.e.m. d-h, Suppression of OFC plasticity during training did not affect history-independent action bias and task engagement. d, Median size of history-independent action bias for mice with both EGFP and paAIP2 expression (blue) or with only EGFP expression (black). e, Mean number of choice trials per session. f, Mean frequency of alarm trials (licking during ready period). g, Mean frequency of miss trials (trials where mice did not make a choice during the 2 sec answer period). h, Reaction time in choice trials (mean of median reaction time). Statistics are from mixed effects models (virus as the fixed effect and session as the random intercept). i-m, Suppression of OFC plasticity at expert stage did not affect history-independent action bias and task engagement. Same metrics as (d-h) for paAIP2-expressing mice that received photoactivation only after achieving expert performance. This mouse group is separate from the group used in (d-h). Sessions with [photoactivation + masking light] and [masking light only] were alternated for 20 sessions. Each line indicates the mean per mouse (10 sessions for each condition). All error bars are 95% CI. Statistics in a-c are from mixed-effects model (suppression as the fixed effect, trials from transition as the random intercept). Statistics in d-h are from mixed-effects model (suppression as the fixed effect, session as the random intercept). Statistics in i-m are from mixed effects models (suppression as the fixed effect, subject as the random slope, session as the random intercept). All tests are two-sided. n.s. P > 0.05, **P < 0.01, ***P < 0.001, ****P < 0.0001. Source data
Extended Data Fig. 5
Extended Data Fig. 5. CaMKII inhibition by paAIP2 does not affect firing properties and value coding of OFC neurons.
a-e. Recordings from OFC slices. a, Representative traces of whole-cell current-clamp recordings from paAIP2 labeled OFC pyramidal neurons in organotypic cortical slices at three different current steps (−100, 0, and 500 pA) before (gray) and after (blue) 40 minutes of blue light stimulation (1 sec ON, 3 sec OFF). The recordings were made from different groups of neurons before and after blue light stimulation. b, Mean (± SEM) number of action potentials (AP) evoked by depolarizing current steps. n = 15 cells after stimulation and 13 cells from 5 transfected slices before stimulation. c, Summary of AP threshold (mean ± SEM) showing no difference between before and after stimulation cells (p = 0.93, unpaired t-test, t(26) = 0.08, p = 0.92). d, Summary of AP amplitude (mean ± SEM) showing no difference between before and after stimulation cells (p = 0.5, unpaired t-test, t(26) = 0.68, p = 0.5). e, Summary of AP half-width (mean ± SEM) showing no difference between before and after stimulation cells (p = 0.42, unpaired t-test, t(26) = 0.80, p = 0.42). f-h, Recordings in vivo. f, Baseline firing rates of OFC neurons were recorded with a chronic silicone probe under head-fixation in darkness 2 hrs before and immediately after a behavior session with paAIP2 photoactivation. n = 25 cells for pre-task and 22 cells for post-task. The box shows the quartiles, and the whiskers extend to the minimum and maximum. Two-sided Wilcoxon rank-sum test. g, Baseline firing rates (head-fixation in darkness) and firing rates during the RL task after 30 consecutive photoillumination sessions for control (EGFP only) and paAIP2 mice. The firing rates during the task were calculated from the first 2-sec window of the ready or post-choice period. Baseline: n = 92 cells for EGFP and 111 cells for paAIP2. Task: n = 131 cells for EGFP (gray) and 81 cells for paAIP2 (blue). The box shows the quartiles, and the whiskers extend to the minimum and maximum. Two-sided Wilcoxon rank-sum tests. h, Decoding of value-related signals from the neural population activity after 30 consecutive photostimulation sessions. We used only the recorded populations with at least 18 simultaneously recorded cells, and the decoding was performed with randomly subsampled population (18 cells) to match the number of input cells to the decoder. We obtained 5 distinct populations for EGFP and 3 distinct populations for paAIP2 with at least 18 simultaneously recorded cells. The decoding analysis indicates that OFC neurons stay healthy with normal value coding in their activity after 30 consecutive paAIP2 photoactivation sessions. Error bars indicate 95% CI. Source data
Extended Data Fig. 6
Extended Data Fig. 6. Value decoding from OFC population activity.
a, Value-related signals were decoded from OFC population activity (subsampled 55 cells/population) with 2 different decoders (mean ± 95% CI). Standard decoder (left) directly decodes value-related signals from neural population activity on individual trials. Trial-derivative decoder (right) decodes the change in value-related signals from the change in population activity between adjacent trials (duplicate from Fig. 4d). Both decoders decoded significant value-related signals from OFC through the trial periods. All sessions after ≥ 14 days of training were analyzed for all mice. Chance decoding accuracy was obtained by shuffling behavior labels across trials for each session (‘within-session’) or decoding unshuffled behavior labels from different sessions (‘cross-session’). The chance distributions are shown as kernel densities. All accuracies were significantly above chance (P < 0.0001). b, Decoding accuracy of value-related signals from OFC population activity (subsampled 55 cells/population) at different trial periods when the decoder was trained and tested using either only left choice trials, right choice trials, rewarded trials, or unrewarded trials (mean ± 95% CI). All accuracies were significantly above chance (P < 0.0001). Decoding was performed with 10-fold CV. Chance decoding accuracy for each condition was obtained by shuffling the behavior labels across trials for each session (‘within-session’) or decoding unshuffled behavior labels from different sessions (‘cross-session’). The chance distributions are shown as kernel densities. These results indicate that the decoding of value-related signals from OFC is not reflecting those binary signals that may partially correlate with values (for example choice for ΔQ, and reward for ∑Q). Statistics are from mixed effects model (shuffling as the fixed effect, neural population as the random intercept, two-sided). ****P < 0.0001. Source data
Extended Data Fig. 7
Extended Data Fig. 7. Effects of inactivation in deep RL models on behavioral action policy with different fractions of inactivated recurrent units.
a, Sum of each type of history weights from the past 5 trials for control (black) and inactivation (red) trials (mean ± 95% CI). b, Size of history-independent action bias for control (black) and inactivation (red) trials (mean ± 95% CI). Different fractions of recurrent units were inactivated. For each fraction condition, neurons to be inactivated were randomly selected for each session. The random subsampling of neurons was repeated 50 times for each fraction condition. Source data
Extended Data Fig. 8
Extended Data Fig. 8. OFC inactivation during ITI or ready period impairs behavioral action policy based on reward history.
a, Optogenetic inactivation of OFC during 2 sec ITI (1–3 sec after choice). ChrimsonR-tdTomato: 9 mice, 60 sessions. tdTomato: 8 mice, 49 sessions. [1st row]: Inactivation period. [2nd row]: Mean regression weights for mice with ChrimsonR-tdTomato. Black, control trials; red, inactivation trials. [3rd row]: Sum of each type of history weights from the past 5 trials for mice with ChrimsonR-tdTomato or only tdTomato. Black, control trials; red, light-on trials. Different colors of thin lines indicate different mice. Horizontal bars indicate mean ± 95% CI. [4th row]: Inactivation effects on the size of history-independent action bias. Horizontal bars indicate mean ± 95% CI. Different colors of thin lines indicate different mice. Inactivation impaired reward history dependence (a: p = 0.0041, b: p = 2.26 × 10⁻⁴, c: p = 0.0027) and |Bias| (b: p = 0.013, c: p = 6.01 × 10⁻⁴). b, Optogenetic inactivation of OFC during 5 sec ITI (0-5 sec after choice). ChrimsonR-tdTomato: 8 mice, 47 sessions. tdTomato: 8 mice, 46 sessions. c, Optogenetic inactivation of OFC during the ready period. ChrimsonR-tdTomato: 10 mice, 62 sessions. tdTomato: 8 mice, 49 sessions. d, Effects of ITI+Ready inactivation on the choices 2 or 3 trials later. Sum of history weights between -2 and -5 trials was used for the +2 trial effect comparison, and the sum of history weights between -3 and -5 trials was used for the +3 trial effect comparison. Significant inactivation effect was restricted to the immediately following trial (Fig. 5c). e, Fractions of mouse choices that were correctly predicted by the history-based regression model for mice with ChrimsonR-tdTomato expression. Horizontal bars indicate mean ± 95% CI. f, Same as (e) for mice with tdTomato expression. All error bars are 95% CI. Statistics are from mixed effects model with Aligned-Rank-Transform (inactivation as the fixed effect, subject as the random slope, session as the random intercept, two-sided). n.s. P > 0.05, *P < 0.05, **P < 0.01, ***P < 0.001. Source data
Extended Data Fig. 9
Extended Data Fig. 9. Relationships between behavioral action policy and value coding in OFC neural activity at different trial periods.
a, Decoding accuracy of value-related signals across training days. Coding of Qch and ∑Q consistently increased during training across all trial periods. ΔQ signal during later trial periods decreased in early training sessions, possibly reflecting that OFC is not the primary site for within-trial maintenance of this information. Areas such as the retrosplenial cortex may be responsible for the within-trial maintenance,. OFC neurons were subsampled (55 cells/population) for decoding. Statistics are from mixed effects models with session as the fixed effect and neural population as the random intercept. Post-choice (ΔQ: p = 0.35, Qch: p = 2.07 × 10⁻²⁰, ∑Q: p = 3.05 × 10⁻¹²), ready (ΔQ: p = 0.33, Qch: p = 4.05 × 10⁻¹⁸, ∑Q: p = 5.65 × 10⁻⁷), pre-choice (ΔQ: p = 5.81 × 10⁻⁷, Qch: p = 4.63 × 10⁻¹⁴, ∑Q: p = 3.84 × 10⁻⁸). b, Relationships between the decoding accuracy and the strength of behavioral dependence on reward history (Sum of unsigned regression weights). Scatterplots with different colors for 14 different OFC populations. Statistics are from mixed effects models with accuracy as the fixed effect and neural population as the random intercept. Post-choice (ΔQ: p = 0.68, Qch: p = 2.07 × 10⁻¹⁷, ∑Q: p = 3.23 × 10⁻⁶), ready (ΔQ: p = 0.80, Qch: p = 2.33 × 10⁻¹¹, ∑Q: p = 0.081), pre-choice (ΔQ: p = 3.13 × 10⁻⁵, Qch: p = 6.93 × 10⁻¹⁰, ∑Q: p = 0.019). c, Angle between coding axes for shared neurons from adjacent sessions (2 days apart for OFC) was measured to quantify the similarity of population coding for value-related signals. Cosine similarity of the coding axes increases during training except for the ΔQ at ready and pre-choice periods (likely due to weak ΔQ signal during these trial periods as shown in (a)). Statistics are from mixed effects models with session pair as the fixed effect and neural population as the random intercept. Post-choice (ΔQ: p = 4.35 × 10⁻⁴, Qch: p = 1.09 × 10⁻¹², ∑Q: p = 3.99 × 10⁻⁷), ready (ΔQ: p = 0.37, Qch: p = 1.20 × 10⁻⁷, ∑Q: p = 5.94 × 10⁻³), pre-choice (ΔQ: p = 1.89 × 10⁻³, Qch: p = 8.63 × 10⁻⁹, ∑Q: p = 7.92 × 10⁻³). d, Relationships between the angle of coding axes for values and the angle of action policy axes for reward history in pairs of sessions. The similarity in coding axes correlates with the similarity in behavioral action policy except for ΔQ at ready and pre-choice periods (likely due to weak ΔQ signal at these trial periods). Statistics are from mixed effects models with coding axis angle as the fixed effect and neural population as the random intercept. Post-choice (ΔQ: p = 7.31 × 10⁻⁴, Qch: p = 1.34 × 10⁻⁸, ∑Q: p = 3.15 × 10⁻⁷), ready (ΔQ: p = 0.36, Qch: p = 8.14 × 10⁻⁸, ∑Q: p = 1.57 × 10⁻⁵), pre-choice (ΔQ: p = 0.54, Qch: p = 5.39 × 10⁻⁸, ∑Q: p = 2.77 × 10⁻⁵). All shadings indicate s.e.m. All regression lines and statistics are from mixed effects models (Methods). n.s. P > 0.05, **P < 0.01, ***P < 0.001, ****P < 0.0001. All tests are two-sided. Source data
Extended Data Fig. 10
Extended Data Fig. 10. Relationships between value coding axis and action policy axis are not due to the noisy estimates of axes in early training sessions.
a, Relationships between the similarity of value coding axes and the similarity of action policy axes for reward history are shown only for the session pairs with at least 10 days of training. The relationships remain after excluding early sessions with poor behavioral performance. Post-choice 0 ~ +1 sec (ΔQ: p = 9.92 × 10⁻³, Qch: p = 8.78 × 10⁻⁵, ∑Q: p = 2.21 × 10⁻³), Post-choice +1 ~ +2 sec (ΔQ: p = 2.09 × 10⁻³, Qch: p = 3.98 × 10⁻⁴, ∑Q: p = 4.25 × 10⁻³), ready (ΔQ: p = 0.12, Qch: p = 7.70 × 10⁻³, ∑Q: p = 2.03 × 10⁻⁴), pre-choice (ΔQ: p = 4.46 × 10⁻², Qch: p = 2.71 × 10⁻⁴, ∑Q: p = 1.25 × 10⁻³). b, Relationships between the similarity of value coding axes and the similarity of action policy axes for reward history are shown only for the session pairs with at least r = 0.2 decoding accuracy for both sessions in the pair. The relationships remain after excluding the pairs with noisy value coding axes. Post-choice 0 ~ +1 sec (ΔQ: p = 0.10, Qch: p = 1.27 × 10⁻⁴, ∑Q: p = 9.77 × 10⁻⁴), Post-choice +1 ~ +2 sec (ΔQ: p = 0.018, Qch: p = 4.15 × 10⁻³, ∑Q: p = 0.020). All regression lines and statistics are from mixed effects models (coding axis angle as the fixed effect and neural population as the random intercept, two-sided). n.s.: P > 0.05, *P < 0.05, **P < 0.01, ***P < 0.001, ****P < 0.0001. Source data

References

    1. Harlow HF. The formation of learning sets. Psychol. Rev. 1949;56:51–65. doi: 10.1037/h0062474. - DOI - PubMed
    1. Hospedales, T., Antoniou, A., Micaelli, P. & Storkey, S. Meta-learning in neural networks: a survey. Preprint at arXiv10.48550/arXiv.2004.05439 (2020). - PubMed
    1. Wang, J. X. et al. Learning to reinforcement learn. Preprint at arXiv10.48550/arXiv.1611.05763 (2016).
    1. Duan, Y. et al. RL2: fast reinforcement learning via slow reinforcement learning. Preprint at arXiv10.48550/arXiv.1611.02779 (2016).
    1. Wang JX, et al. Prefrontal cortex as a meta-reinforcement learning system. Nat. Neurosci. 2018;21:860–868. doi: 10.1038/s41593-018-0147-8. - DOI - PubMed