. 2023 Dec;3(12):1561-1575.
doi: 10.1038/s43587-023-00519-6. Epub 2023 Nov 13.

Senolytic therapy alleviates physiological human brain aging and COVID-19 neuropathology

Affiliations

Senolytic therapy alleviates physiological human brain aging and COVID-19 neuropathology

Julio Aguado et al. Nat Aging. 2023 Dec.

Abstract

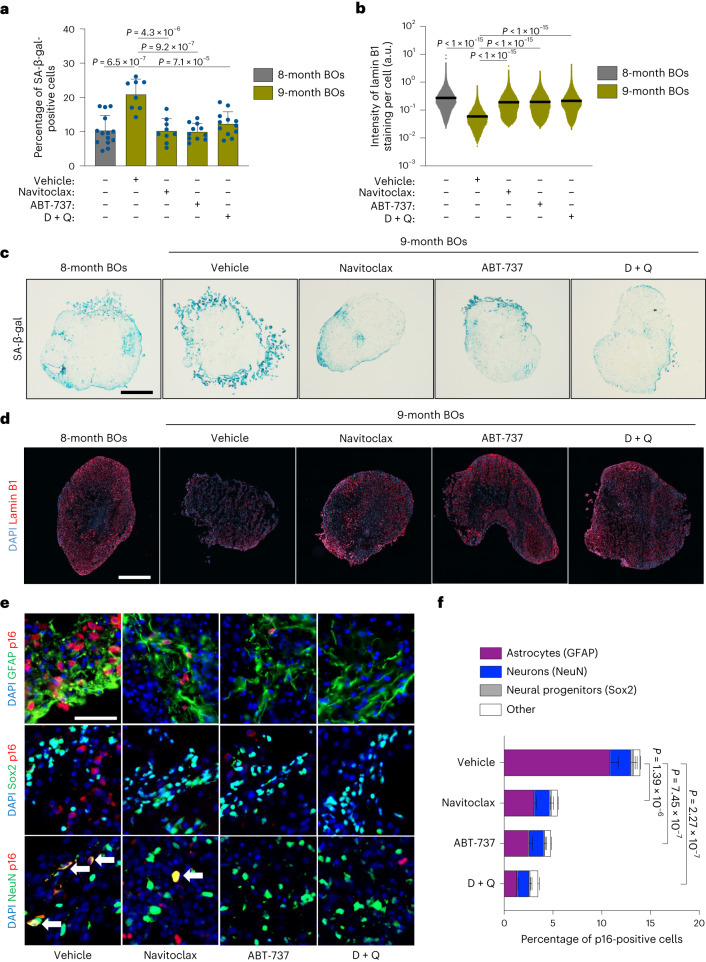
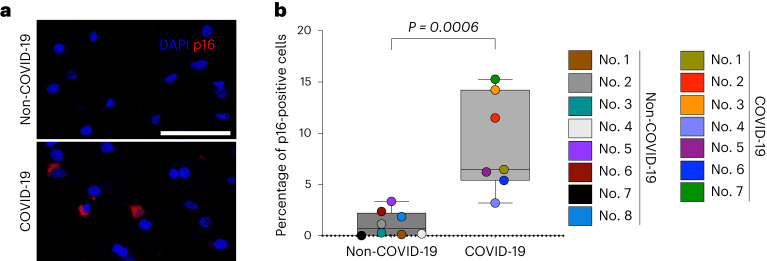
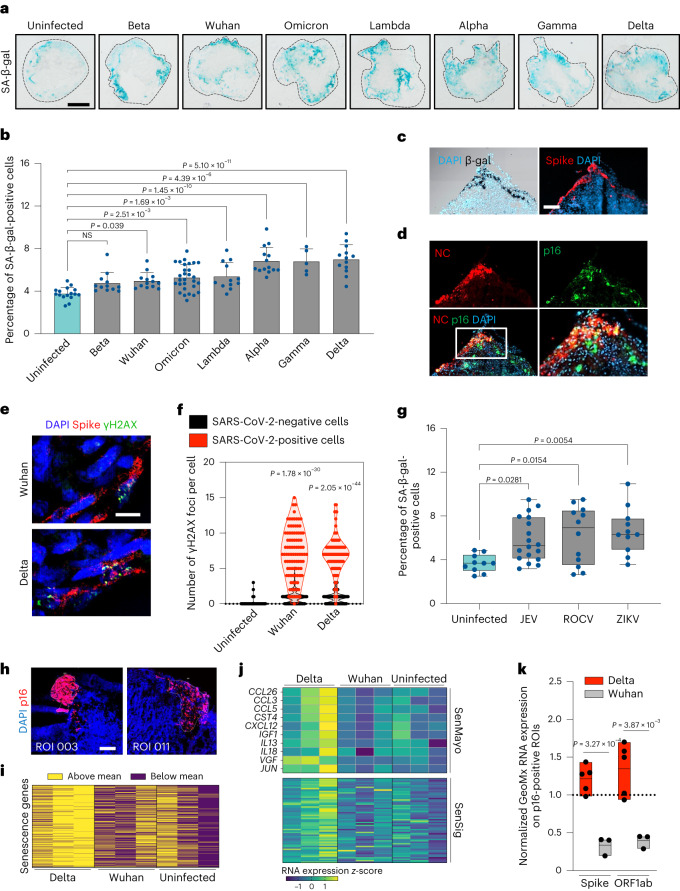
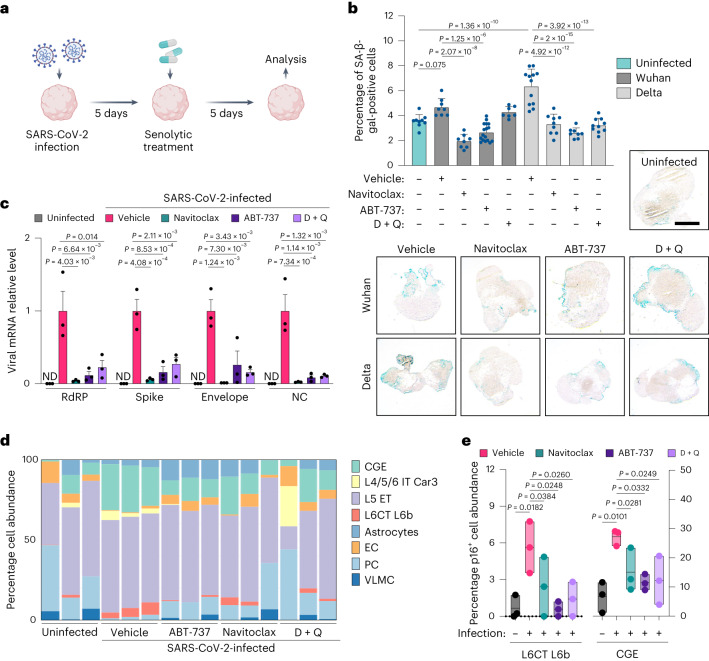
Aging is a major risk factor for neurodegenerative diseases, and coronavirus disease 2019 (COVID-19) is linked to severe neurological manifestations. Senescent cells contribute to brain aging, but the impact of virus-induced senescence on neuropathologies is unknown. Here we show that senescent cells accumulate in aged human brain organoids and that senolytics reduce age-related inflammation and rejuvenate transcriptomic aging clocks. In postmortem brains of patients with severe COVID-19 we observed increased senescent cell accumulation compared with age-matched controls. Exposure of human brain organoids to severe acute respiratory syndrome coronavirus 2 (SARS-CoV-2) induced cellular senescence, and transcriptomic analysis revealed a unique SARS-CoV-2 inflammatory signature. Senolytic treatment of infected brain organoids blocked viral replication and prevented senescence in distinct neuronal populations. In human-ACE2-overexpressing mice, senolytics improved COVID-19 clinical outcomes, promoted dopaminergic neuron survival and alleviated viral and proinflammatory gene expression. Collectively our results demonstrate an important role for cellular senescence in driving brain aging and SARS-CoV-2-induced neuropathology, and a therapeutic benefit of senolytic treatments.


Conflict of interest statement

The authors declare no competing interests.

Figures

Fig. 1
Fig. 1. Long-term senolytic treatment prevents selective accumulation of senescent cells in physiologically aged human BOs.
af, BOs were generated and grown in vitro for 8 months and subsequently exposed to two doses (one every 2 weeks) of either navitoclax (2.5 μM), ABT-737 (10 μM) or D + Q (D, 10 μM; Q, 25 μM) within the following month, after which organoids (n = 8–14) were collected for in situ analysis. a, SA-β-gal assay was performed on organoid sections. Each data point in the bar graph represents a single organoid analyzed. Data presented as mean ± s.d.; at least eight individual organoids were analyzed per condition; one-way analysis of variance (ANOVA) with Tukey’s multiple-comparison post hoc corrections. b, Lamin B1 staining was performed on organoid sections. Each data point in the scatter plot represents the integrated intensity of each cell within organoid sections. At least eight individual organoids were analyzed per condition; one-way ANOVA with Tukey’s multiple-comparison post hoc corrections. c,d, Representative images from quantifications shown in a,b, respectively. Scale bar, 0.3 mm. e, Representative immunofluorescent images of regions from organoids treated with the indicated senolytics and vehicle control. Samples were individually immunolabeled with antibodies against GFAP, Sox2 and NeuN and co-stained for p16. Arrows indicate coimmunoreactivity of NeuN and p16. Scale bar, 50 µm. f, Bar graphs showing colocalization quantification performed on organoid sections. Data presented as mean ± s.d.; three individual organoids were analyzed per condition; one-way ANOVA with Tukey’s multiple-comparison post hoc corrections. a.u., arbitrary units. Source data
Fig. 2
Fig. 2. Transcriptomic characterization of distinct senolytic interventions on brain aging hallmarks.
ag, BOs were generated and grown in vitro for 8 months and subsequently exposed to two doses (one every 2 weeks) of either navitoclax (2.5 μM), ABT-737 (10 μM) or D + Q (D, 10 μM; Q, 25 μM) within the following month, after which organoids were collected and subjected to bulk RNA-seq analysis. ac, Volcano plots showing vehicle-treated versus navitoclax- (a), ABT-737- (b) and D + Q-treated (c) BO differential expression of upregulated (blue) and downregulated (red) mRNAs (P < 0.05, log2FC > 0). d, Venn diagram showing differentially repressed senescence-associated mRNAs among senolytic-treated organoids, defined by significance P < 0.05 and log2FC > 0. e, GSEA was carried out using aging hallmark gene sets from the Molecular Signature Database. Statistically significant signatures were selected (P < 0.05, false discovery rate < 0.25) and placed in order of NES. Bars indicate pathways enriched in individual senolytic treatments compared with vehicle-treated BOs. f, Transcriptomic age (tAge) of organoids treated with either vehicle or senolytic compounds assessed using the brain multispecies aging clock. Three individual organoids were analyzed per condition. Box-and-whisker plot (minimum, 25th percentile; median, 75th percentile; maximum). g, Spearman correlation between gene expression changes induced by senolytics in aged organoids and signatures of aging and established lifespan-extending interventions based on functional enrichment output. NES calculated with GSEA were used to evaluate correlations between pairs of signatures. Source data
Fig. 3
Fig. 3. Brains of patients with COVID-19 exhibit increased accumulation of p16 senescent cells.
a, Immunofluorescence images showing DAPI (blue) and p16 (red) immunoreactivity in sections of frontal cortex regions from patients with severe COVID-19 and age-matched non-COVID-related controls. Scale bar, 50 μm. b, Box-and-whisker plots (minimum, 25th percentile; median, 75th percentile; maximum) showing percentage of p16-positive cells. Each data point represents a single patient analyzed, with a total of 2,794,379 individual brain cells across seven patients with COVID-19 and eight non-COVID-19. Two-tailed Student’s t-test. Source data
Fig. 4
Fig. 4. Neurotropic viral infections elicit virus-induced senescence in human BOs.
a, SARS-CoV-2 variant screening was performed on BOs and monitored for SA-β-gal activity at 5 dpi. Scale bar, 0.3 mm. b, Quantification of data presented in a. Bar graphs show the percentage of SA-β-gal-positive cells. Each data point in the bar graph represents a single organoid analyzed (n = 5–29). Data presented as mean ± s.d.; one-way ANOVA with Dunnett’s multiple-comparison post hoc corrections. c, Representative images of Delta-infected organoid sections stained for SA-β-gal and SARS-CoV-2 Spike protein. d, Representative images of the region shown in c coimmunolabeled for p16 and SARS-CoV-2 nucleocapsid (NC). c,d, One representative experiment out of two is shown. Scale bar, 100 µm. e, Organoids infected for 5 days with SARS-CoV-2 variants were stained for γH2AX and SARS-CoV-2 spike protein. Scale bar, 40 μm. f, Quantification of data presented in e. Scatter plot showing the number of γH2AX foci per cell in infected regions (red) versus uninfected counterparts (black). Each data point in the scatter plot represents a single cell analyzed; at least 400 cells per condition were analyzed; n = 3 BOs; two-tailed Student’s t-test. g, Human BOs were infected with JEV, ROCV and ZIKV and monitored for SA-β-gal activity at 5 dpi. Box plots show percentage of SA-β-gal-positive cells. Each data point represents a single organoid (n = 10–18) analyzed. Box-and-whisker plots (minimum, 25th percentile; median, 75th percentile; maximum); one-way ANOVA with multiple-comparison post hoc corrections. hk, Uninfected, Wuhan- and Delta-infected human BOs were subjected to ROI selection based on p16 protein expression for spatial profiling by the Nanostring GeoMX digital spatial profiler assay, and further sequenced for the GeoMx Human Whole Transcriptome Atlas. h, Representative p16-positive ROIs. Scale bar, 200 µm. i, Heatmap of polarity showing expression above (blue) and below (red) the mean for each differentially heightened SASP mRNA of Delta-infected, p16-positive ROIs. j, SenMayo and SenSig senescence signature heatmap gene expression of Delta-infected p16-positive cells. k, Floating bars (minimum, mean, maximum) showing expression enrichment of SARS-CoV-2 RNAs (Spike, ORF1ab) for each SARS-CoV-2 variant. Each data point in the box plot represents a normalized FC value of SARS-CoV-2 RNAs of p16-positive ROIs relative to p16-negative counterparts (indicated by grid line). n = 3–5 p16-positive ROIs were analyzed per condition; two-tailed Student’s t-test. NS, not significant. Source data
Fig. 5
Fig. 5. Senolytics clear virus-induced senescence in specific neuronal subtypes.
a, Schematic representation of experimental design pertaining to be. Human BOs were SARS-CoV-2 infected at MOI 1 for 5 days and subsequently exposed to the indicated senolytic treatments for five additional days. Analysis was performed at the end timepoint of the 10-day experiment. b, SA-β-gal activity was evaluated at 10 dpi. Bar graphs showing percentage of SA-β-gal-positive cells. Each data point in the bar graph represents a single organoid (n = 7–17) analyzed. Data presented as mean ± s.d.; one-way ANOVA with multiple-comparison post hoc corrections. Scale bar, 0.3 mm. c, Total RNA from individual organoids uninfected or infected with the SARS-CoV-2 Delta variant was used to quantify the indicated levels of viral RNAs, normalized to RPLP0 mRNA and compared with infected vehicle controls. Error bars represent s.e.m.; n = 3 independent organoids; one-way ANOVA with multiple-comparison post hoc corrections; ND, not detected; RdRP, RNA-dependent RNA polymerase. d, Stacked bars showing NanoString GeoMx deconvolved p16-positive ROI cell abundance using constrained log-normal regression from organoids either uninfected or infected with the SARS-CoV-2 Delta variant. L4/5/6 IT Car3, glutamatergic neurons; L5 ET, cortical layer 5 pyramidal neurons; L6CT L6b, corticothalamic (CT) pyramidal neurons in layer 6; CGE, GABAergic ganglionic eminence neurons; VLMC, vascular and leptomeningeal cells. e, Floating bar graphs (minimum, mean, maximum) showing percentage of deconvolved p16-positive neuronal populations significantly modulated following SARS-CoV-2 Delta variant infection and subsequent senolytic interventions. n = 3 independent ROIs per condition tested; *P < 0.05, one-way ANOVA with multiple-comparison post hoc corrections. Source data
Fig. 6
Fig. 6. Senolytic treatments mitigate COVID-19 brain pathology in vivo.
a, Schematic representation of experimental design pertaining to bh. K18-hACE2 transgenic mice were exposed to Delta variant infection on day 0 and subsequently treated with senolytics every other day starting on day 1. Mice were euthanized on day 5 for brain tissue characterization, as well as for end timepoint experiments to monitor clinical score and survival. b, Kaplan–Meier curve of uninfected mice (n = 3) and of infected mice treated with vehicle (n = 6), fisetin (n = 9), D + Q (n = 8) or navitoclax (n = 8). *P = 0.032 for vehicle versus fisetin curve comparison; **P = 0.0087 for vehicle versus D + Q curve comparison; log-rank (Mantel–Cox) test. c, Average combined behavioral and physical clinical score, over time, of uninfected mice (n = 3) and of SARS-CoV-2-infected mice treated with vehicle (n = 6), fisetin (n = 8), D + Q (n = 8) or navitoclax (n = 8). Error bars represent s.e.m.; color-coded *P < 0.05 for comparisons between vehicle and each color-coded senolytic treatment; one-way ANOVA with multiple-comparison post hoc corrections for every timepoint tested. d, Total RNA of individual brains from mice—either uninfected or Delta variant-infected and treated with senolytics—was used to quantify the indicated levels of viral RNAs and was normalized to Rplp0 mRNA and compared with infected vehicle controls. Error bars represent s.e.m.; n = 8 mouse brains per condition; one-way ANOVA with multiple-comparison post hoc corrections. e, Total RNA of individual brains from mice— either uninfected or infected with SARS-CoV-2 Delta variant and treated with various senolytic interventions—was used to quantify mRNA expression levels of the indicated senescence and SASP RNAs and was normalized to Rplp0 mRNA. Each column in the heatmap represents an individual mouse brain analyzed. f, Representative immunofluorescent images of brainstem sections from mice either uninfected or infected with the SARS-CoV-2 Delta variant and treated with the indicated senolytics. Samples were immunolabeled with antibodies against TH (red; scale bar, 100 µm) and GFAP (green; scale bar, 50 µm). g, Quantification of TH data presented in f. Bar graph showing the intensity of TH staining. Each data point in the bar graph represents average TH intensity analyzed per mouse brain (n = 3). Data presented as mean ± s.d.; ****P < 0.0001, one-way ANOVA with multiple-comparison post hoc corrections. h, Quantification of GFAP data presented in f. Dot plot shows the intensity of GFAP per cell. Each data point in the dot blot represents a single cell analyzed. ****P < 0.0001; three brains per condition were analyzed; one-way ANOVA with multiple-comparison post hoc corrections. Source data
Extended Data Fig. 1
Extended Data Fig. 1. Characterization of cellular senescence in physiologically aged human BOs.
(a) Scatter plot shows the number of SA-β-gal-positive cells per organoid. Each data point in the bar graph represents a single organoid analysed. Dotted lines represent the fitted non-linear regression curve. (b) Schematic representation of experimental design that applies to Figs. 1,2 and to Extended Data Fig. 1b-c. 8-month-old human BOs were exposed to two doses of the senolytic treatments navitoclax (2.5 μM), ABT-737 (10 μM) or D + Q (D: 10 μM; Q: 25 μM): the first one on day 1 and the second dose on day 16. Analysis was performed at the end time point of the 1-month experiment as well as at initial timepoint of 8 months organoid culture. (c) Bar graphs show the percentage of p16-positive cells co-localising with the indicated brain cell type markers. Each data point in the bar graph represents a single organoid analysed. Data are presented as mean values ± s.d.; 3 individual organoids were analysed per condition; one-way ANOVA with Dunnett’s multiple-comparison post-hoc corrections. Source data
Extended Data Fig. 2
Extended Data Fig. 2. Senolytic-driven transcriptomic changes in BOs and senescence single-cell analysis of postmortem human brain frontal cortex.
(a) Heat map shows senescence-associated RNA transcriptomic expression of downregulated mRNAs shared across all three senolytic interventions. (b) Functional enrichment analyses of gene expression signatures and multiple senolytic treatment of BOs. Heat map cells are coloured based on the normalized enrichment score (NES). (c) Box-and-whisker plots (Tukey’s minimum, 25th percentile, median, 75th percentile, Tukey’s maximum) shows the intensity in normalised arbitrary units (a.u.) of p16 protein. Each dot represents outlier cells of a total of 2,794,379 individual brain cells across 7 COVID-19 and 8 non-COVID-19 patients. p16-positive cells were assigned when a cell’s normalised intensity surpassed the value of 1,000. Source data
Extended Data Fig. 3
Extended Data Fig. 3. Characterization of neurotropic SARS-CoV-2-induced senescence.
(a) Representative images of neural progenitors (Sox2), neurons (NeuN), or astrocytes (GFAP) co-stained with SARS-CoV-2 nucleocapsid protein. Human BOs were 3 month-old at time of infection with the indicated SARS-CoV-2 variants at MOI 1 and collected at 5dpi. Scale bar, 50 µm. One representative experiment out of two is shown. (b) Stacked bar graphs show quantifications from a. (c,d) Microglia-containing organoids were generated as previously described, these organoids were matured for 3 months prior to SARS-CoV-2 infection at MOI 1 and collected at 5dpi. (c) Representative images of microglia (Iba1) co-stained with SARS-CoV-2 nucleocapsid protein. Scale bar, 50 µm. (d) Stacked bar graphs show quantifications from c. (e) Bar graphs show the percentage of p16- and p21-positive cells. Each data point in the bar graph represents a single organoid (n = 5-8) analysed at 5dpi. Data are presented as mean values ± s.d.; one-way ANOVA with Dunnett’s multiple-comparison post-hoc corrections. (f) Representative images of p16 and p21 co-stained with SARS-CoV-2 nucleocapsid and spike proteins. Scale bar, 50 µm. (g) Bar graphs show the percentage of SA-β-gal-positive cells. Each data point in the bar graph represents a single organoid (n = 9-29) analysed at 5 and 10dpi. Data are presented as mean values ± s.d.; one-way ANOVA with Dunnett’s multiple-comparison post-hoc corrections. (h) Total RNA from individual organoids infected with the indicated SARS-CoV-2 variants was used to quantify the indicated levels of viral RNAs and normalized to RPLP0 mRNA and compared to infected organoids at 1dpi. Error bars represent s.e.m.; n = 3 independent organoids; one-way ANOVA with multiple-comparison post-hoc corrections. (i) Bar graphs show the percentage of p16- and p21-positive cells within SARS-CoV-infected cells, and distal ( > 150 µm) and proximal ( < 150 µm) uninfected cells to SARS-CoV-2 infected cells positive for p16. Each data point in the bar graph represents a single organoid analysed. Data are presented as mean values ± s.d.; 3 individual organoids were analysed per condition; two-way ANOVA with multiple-comparison post-hoc corrections. Source data
Extended Data Fig. 4
Extended Data Fig. 4. Transcriptional characterization of virus-induced senescence.
(a) Venn diagram on the left shows 485 differentially expressed genes shared across SARS-CoV-2-infected organoids and postmortem brains of COVID-19 patients defined with a significance adjusted P < 0.05 and log2FC > 0. On the right panel, bar graph indicates the pathways enriched within this 485-gene cohort. Gene Set Enrichment Analysis was carried out using aging hallmark gene sets from the Molecular Signature Database. The statistically significant signatures were selected (P < 0.05, FDR < 0.25). (b) Volcano plots show uninfected versus either Wuhan or Delta-infected brain organoid differential expression of upregulated (blue) and downregulated (red) RNAs (P < 0.05, log2FC > 0). DEG analysis was performed from whole-organoid RNA-seq data and p16-positive senescent-cell regions of interest (ROIs) from NanoString spatial transcriptomic sequencing. (c) Representative images of SARS-CoV-2 nucleocapsid protein immunoreactivity on BOs infected with the indicated SARS-CoV-2 variants and analysed at 5 days post infection. Scale bar, 500 µm. (d) Bar graph shows quantifications of nucleocapsid-positive cells from BOs (n = 4-8) uninfected and infected with the indicated SARS-CoV-2 variants and analysed at 5 dpi. Each data point in the bar graph represents a single organoid analysed. Data are presented as mean values ± s.d.; one-way ANOVA with multiple-comparison post-hoc corrections. (e) SenSig senescence signature heat map gene expression of Delta-infected p16-positive cells. Source data
Extended Data Fig. 5
Extended Data Fig. 5. Effects of senolytic administration prior to SARS-CoV-2 infection.
(a) Principal component analysis from NanoString spatial transcriptomic sequencing of p16-positive cells in the subspace defined by these differentially-expressed genes showing clustering of uninfected and Wuhan-infected human BOs away from the Delta-infected counterparts. (b) Total RNA from individual organoids uninfected or infected with the SARS-CoV-2 Delta variant was used to quantify Lamin B1 and p21 mRNA expression levels and normalized to RPLP0 mRNA and compared to infected vehicle controls. Data are presented as mean values ± s.d.; n = 3 independent organoids; one-way ANOVA with multiple-comparison post-hoc corrections. (c) Schematic representation of experimental design that applies to d. Human BOs were exposed to the indicated senolytic treatments for 5 days and subsequently SARS-CoV-2-infected at multiplicity of infection 1 for 5 additional days. Analysis was performed at the end time point of the 10-day experiment. (d) SA-β-gal activity was evaluated at 10 days post infection. Bar graphs show the percentage of SA-β-gal-positive cells. Each data point in the bar graph represents a single organoid (n = 6-17) analysed. Data are presented as mean values ± s.d.; one-way ANOVA with multiple-comparison post-hoc corrections. Source data
Extended Data Fig. 6
Extended Data Fig. 6. Senolytics delay weight loss and reduce lung senescence in SARS-CoV-2-infected K18-hACE2 mice.
(a) Representative immunofluorescent images of viral nucleocapsid (NC) antigen in whole brain coronal sections of brains from SARS-CoV-2-infected K18-hACE2 transgenic mice (5 days post infection). CTX: Cerebral cortex; BS: Brainstem. (b) Percentage weight loss up to 7 days post infection. Uninfected mice (n = 3), and Delta SARS-CoV-2-infected mice treated with vehicle (n = 6), fisetin (n = 8), D + Q (n = 8), or navitoclax (n = 8). Error bars represent s.d. (c) Total RNA of individual lungs from mice uninfected or infected with the SARS-CoV-2 Delta variant and treated with various senolytic interventions was used to quantify the mRNA expression levels of the indicated senescence and SASP RNAs and was normalized to Rplp0 mRNA. Each column in the heatmap represents an individual mouse lung analysed. Source data

References

    1. Nalbandian A, et al. Post-acute COVID-19 syndrome. Nat. Med. 2021;27:601–615. doi: 10.1038/s41591-021-01283-z. - DOI - PMC - PubMed
    1. Choutka J, Jansari V, Hornig M, Iwasaki A. Unexplained post-acute infection syndromes. Nat. Med. 2022;28:911–923. doi: 10.1038/s41591-022-01810-6. - DOI - PubMed
    1. Taquet M, Geddes JR, Husain M, Luciano S, Harrison PJ. 6-Month neurological and psychiatric outcomes in 236 379 survivors of COVID-19: a retrospective cohort study using electronic health records. Lancet Psychiatry. 2021;8:416–427. doi: 10.1016/S2215-0366(21)00084-5. - DOI - PMC - PubMed
    1. Monje M, Iwasaki A. The neurobiology of long COVID. Neuron. 2022;110:3484–3496. doi: 10.1016/j.neuron.2022.10.006. - DOI - PMC - PubMed
    1. Ceban F, et al. Fatigue and cognitive impairment in post-COVID-19 syndrome: a systematic review and meta-analysis. Brain Behav. Immun. 2022;101:93–135. doi: 10.1016/j.bbi.2021.12.020. - DOI - PMC - PubMed

Substances