. 2023 Nov;29(11):2763-2774.
doi: 10.1038/s41591-023-02582-3. Epub 2023 Nov 13.

Dynamics and durability of HIV-1 neutralization are determined by viral replication

Affiliations

Dynamics and durability of HIV-1 neutralization are determined by viral replication

Philipp Schommers et al. Nat Med. 2023 Nov.

Abstract

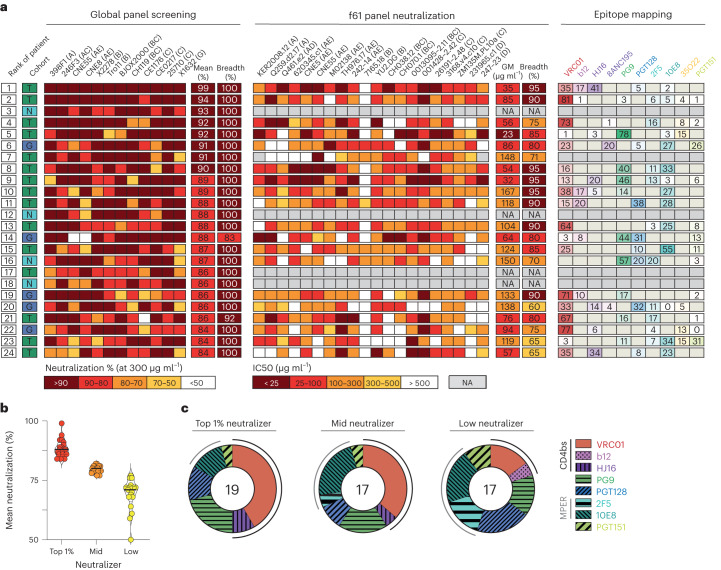
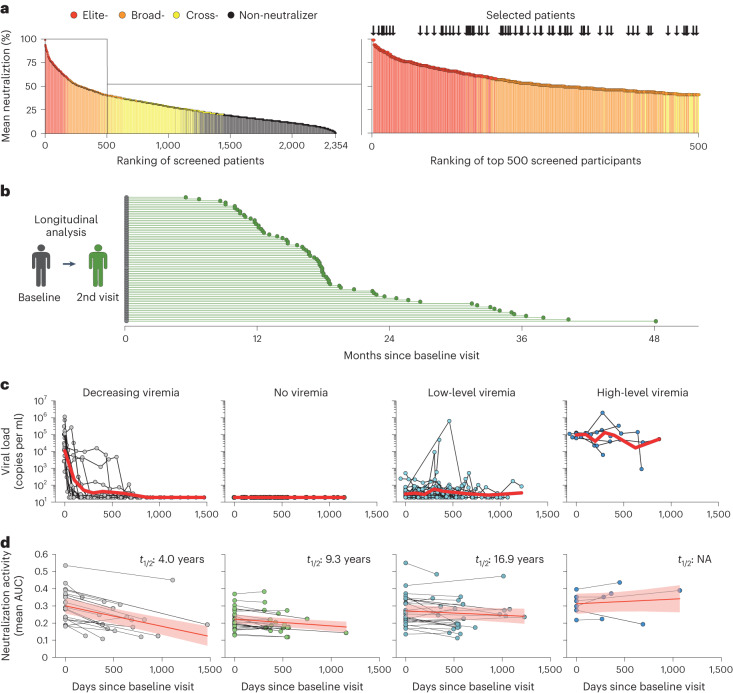
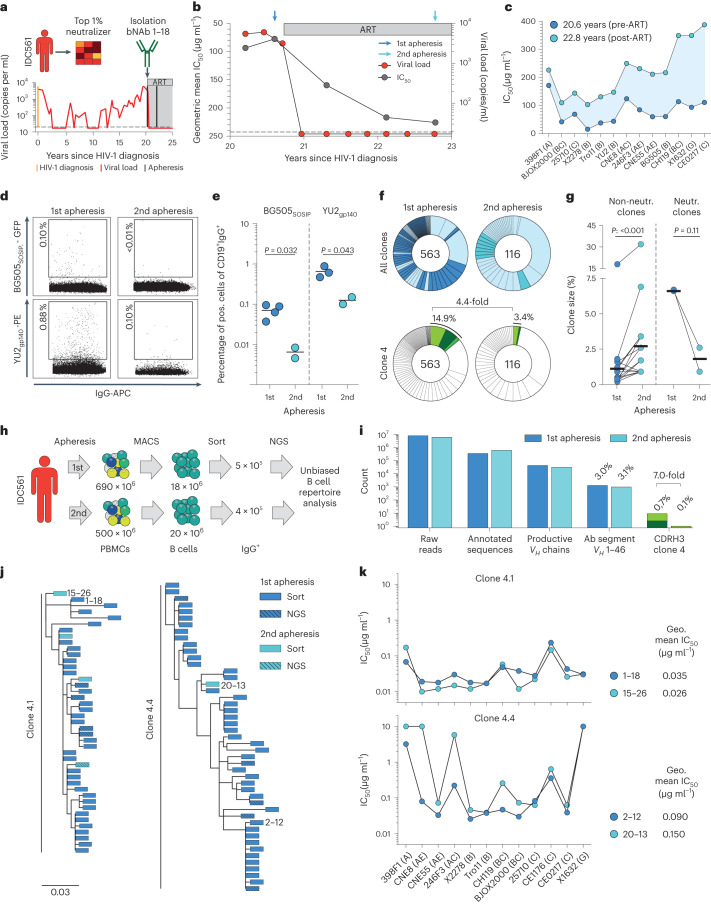
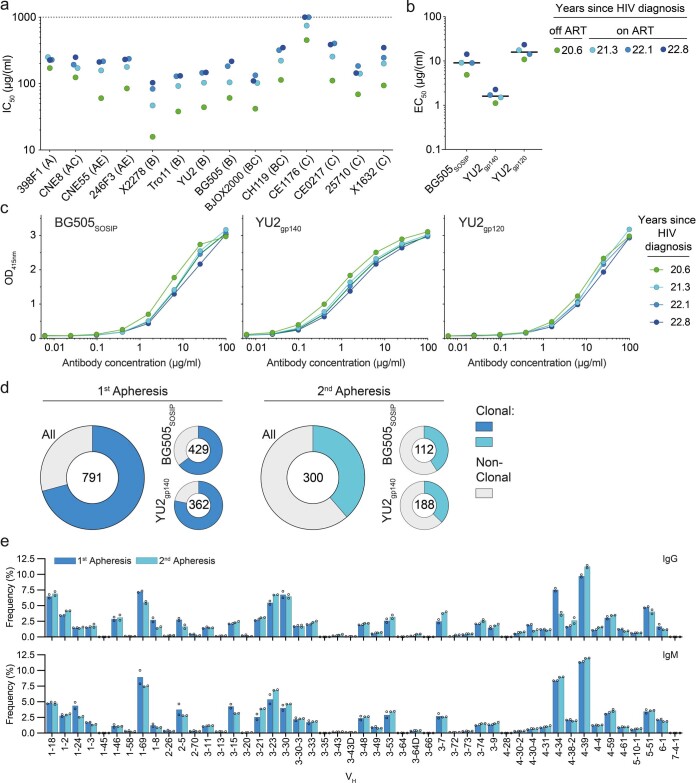
Human immunodeficiency virus type 1 (HIV-1)-neutralizing antibodies (nAbs) that prevent infection are the main goal of HIV vaccine discovery. But as no nAb-eliciting vaccines are yet available, only data from HIV-1 neutralizers-persons with HIV-1 who naturally develop broad and potent nAbs-can inform about the dynamics and durability of nAb responses in humans, knowledge which is crucial for the design of future HIV-1 vaccine regimens. To address this, we assessed HIV-1-neutralizing immunoglobulin G (IgG) from 2,354 persons with HIV-1 on or off antiretroviral therapy (ART). Infection with non-clade B viruses, CD4+ T cell counts <200 µl-1, being off ART and a longer time off ART were independent predictors of a more potent and broad neutralization. In longitudinal analyses, we found nAb half-lives of 9.3 and 16.9 years in individuals with no- or low-level viremia, respectively, and 4.0 years in persons who newly initiated ART. Finally, in a potent HIV-1 neutralizer, we identified lower fractions of serum nAbs and of nAb-encoding memory B cells after ART initiation, suggesting that a decreasing neutralizing serum activity after antigen withdrawal is due to lower levels of nAbs. These results collectively show that HIV-1-neutralizing responses can persist for several years, even at low antigen levels, suggesting that an HIV-1 vaccine may elicit a durable nAb response.


Conflict of interest statement

A patent application encompassing aspects of this work has been filed by the University of Cologne and lists P.S., H.G. and F.K. as inventors. P.S., H.G. and F.K. received payments from the University of Cologne for licensed antibodies. J.D.B. is on the scientific advisory boards of Apriori Bio, Invivyd, Aerium Therapeutics and the Vaccine Company. J.D.B., C.E.R. and A.S.D. receive royalty payments as inventors on Fred Hutch licensed patents related to viral DMS. A.S.D. is currently an employee of Apriori Bio, although his contributions to this manuscript were performed when he was an employee of Fred Hutch before he started work at Apriori Bio. The remaining authors declare no competing interests.

Figures

Fig. 1
Fig. 1. Neutralization screening of a large multinational cohort.
a, Isolated IgGs of 2,354 HIV-1-infected individuals from a multinational study were tested against the global panel. The neutralization against each of the 12 viruses received a score between 0 and 3. Scores were later added to build neutralization strata. b, Clinical and virological characteristics of individuals from the different countries. Numbers indicate the amount of people for whom the respective characteristic was available. c, Neutralization strata of all individuals and of each respective cohort. d, Violin plots of the neutralization of participants’ IgGs against the global panel pseudoviruses. Individuals were stratified according to the strata as shown in c. Black bars indicate median, and gray bars indicate the respective quartiles. e, Average neutralization of each cohort against the respective 12 global panel viruses. f, Violin plots show the average neutralization against the whole global panel (Germany, n = 1,294; Nepal, n = 422; Tanzania, n = 475 and Cameroon, n = 163). Black bars indicate median, and dotted bars indicate the respective quartiles. One-way ANOVA with Tukey’s correction for multiple comparisons was used to compare average neutralization between groups. *P = 0.021, ***P < 0.001. g, Fold change of the mean neutralization of the respective cohorts against the global panel, when normalized to the mean activity against all 12 strains (f).
Fig. 2
Fig. 2. Identification of elite neutralizers with extremely potent and broad serum activity.
a, Top 1% (n = 24) of all 2,354 tested individuals after ranking them according to their mean neutralization (%) against all 12 pseudoviruses. Left, results of the single dilution screening against the global panel. First column indicates the ranking of each individual. Second column indicates the respective cohort (green, Tanzania (T); turquoise, Nepal (N) and blue, Germany (G)). Middle, neutralization activity (IC50 (µg ml−1)) against the f61 fingerprint panel. Right, delineation scores of f61-panel-based computational epitope mapping. Values are rounded, which may result in totals of 101 or 99 for some lines/individuals. b, Strata that were used for epitope analysis in c. Shown is the average neutralizing activity against the global panel of 53 persons (top neutralizer, n = 19; mid neutralizer, n = 17 and low neutralizer, n = 17). Black bars show median average neutralization. Dotted bars show quartiles. c, Pie charts showing the number of individuals that were stratified as top-, mid- or low-neutralizers, based on their average neutralization (b). Slices represent the mapped epitopes. Delineation scores >30% were counted as mapped epitope per individual. Outer lines indicate epitope mapping toward the CD4-binding site (black bar) or the MPER region (gray bar). GM, geometric mean.
Fig. 3
Fig. 3. HIV-1 infection history determines the neutralizing activity.
a, Clinical characteristics of individuals. All individuals for whom the specific clinical information was available were included in the respective analysis. Columns indicate the percentage of elite neutralizer, broad neutralizer, cross-neutralizer or non-neutralizer in each respective group. Numbers in columns indicate the size of the respective group (C. Europe, Central Europe; E. Europe, Eastern Europe; C. Africa, Central Africa; BLoD, below the limit of detection). b, Multinomial logistic Cox-regression model to assess the impact of demographic characteristics and HIV-1 infection history on the neutralization capacity. Individuals for whom all factors were available have been included in this analysis (n = 942). Squares indicate the RRR together with the 95% confidence intervals.
Fig. 4
Fig. 4. Durability of HIV-1 neutralization is determined by the amount of antigen exposure.
a, Left, the ranking of all tested persons (n = 2,354) according to their average neutralization against all global panel strains in the screening. Colors refer to the respective neutralization strata of each person. Right, the top 500 persons. Arrows indicate persons that have been selected for further analysis (n = 71). b, Time in months between baseline visit (gray dots) and second visit (green dots). c, HIV-1 RNA plasma copies (copies per ml) of individuals between baseline and second visit. Individuals were grouped based on the cumulative viral load of each individual over time (decreasing viremia, n = 18; no viremia, n = 22; low-level viremia, n = 25 and high-level viremia, n = 6). Red lines show the geometric mean of viral loads. d, Neutralization dynamics of individuals between baseline and second visit. Dots are the mean AUCs of the in vitro IgG neutralization curves against the global panel pseudoviruses at each respective visit. Each pair of dots represents the neutralization dynamics of one person. Red lines show a learned linear mixed model describing AUC changes between the baseline and second visit. Light red areas indicate the 95% confidence bands. Half-lives (t1/2) were calculated from the slope of separate mixed models fitted to the binary logarithm of the mean AUC.
Fig. 5
Fig. 5. Neutralization dynamics in elite neutralizer IDC561.
a, Clinical data of individual IDC561. b, Mean IgG neutralization of IDC561’s IgG against an extended global panel (12 strains + YU2 + BG505) and viral loads over time. Dotted line indicates the limit of viral detection. c, Neutralization activity of IDC561’ IgG from the two apheresis timepoints against the extended global panel (excluding CE1176). d, Representative dot blots of BG505SOSIP.664- (top) or YU2gp140-reactive (bottom) IgG+ B cells at first and second apheresis, respectively. Numbers indicate the frequency of HIV-1 envelope-reactive IgG+ B cells from the parental gate. e, Frequency of BG505SOSIP.664- (top) or YU2gp140-reactive IgG+ B cells from the parental gate as found in individual sorts (BG505: first apheresis, n = 4 and second apheresis, n = 2; YU2: first apheresis, n = 3 and second apheresis, n = 2). Lines indicate mean percentage. Two-tailed t-test was used for comparison. f, Pie charts show the numbers of clonal heavy-chain sequences identified. Individual clones are represented by slices. Light blue slices: clones that have been identified at both aphereses. Green slices: clone 4. g, Clone size (% of all identified sequences) of clones identified at both timepoints (blue dots, first apheresis and turquoise dots, second apheresis; non-neutralizing clones, n = 27 pairs and neutralizing clones, n = 2 pairs). Black lines show mean percentage. Wilcoxon matched-pairs signed rank test and two-tailed t-test were used to compare non-neutralizing and neutralizing clones, respectively. h, Scheme of sample processing for the unbiased B cell repertoire analysis. i, Columns show the total count of sequences that resulted from our NGS-based unbiased B cell repertoire analysis. j, Phylogenetic tree of clones 4.1 and 4.4 members as identified by different methods from the first and second apheresis timepoints. Antibodies 1–18, 15–26, 2–12 and 20–12 are further shown in k. k, Activity of bNAbs identified from individual IDC561 against the global panel. Antibodies 1–18 and 2–12 were identified from the first apheresis. Antibodies 15–26 and 20–13 were identified from the second apheresis. Dots at 10 µg ml−1 indicate nonneutralized strains (IC50 > 10 µg ml−1). Geo, geometric; Neutr., neutralizing.
Fig. 6
Fig. 6. Longitudinal serum antibody repertoire of IDC561.
a, Deconvoluting the serum antibody repertoire with the combination of LC–MS/MS and sequential data sets. b, CDRH3 clonotypic composition and relative frequency of the anti-BG505SOSIP.664 plasma antibody repertoire. c, Time course of the relative abundance of clone 4 in IDC561 anti-BG505SOSIP.664 plasma (left y axis) and IgG neutralization activity against the global panel (right y axis). d, IGHV-gene usage of the anti-BG505SOSIP.664 serum IgG repertoire of individual IDC561.
Extended Data Fig. 1
Extended Data Fig. 1. Validation and optimization of single concentration neutralization screening.
(a) Global panel IgG neutralization of patient IgGs from elite- and broad neutralizers. Each dot represents neutralization of a single individual against a single pseudovirus. X-axis shows the 50% inhibitory concentration (IC50) values that were determined by IgG titration. Y-axis shows percent inhibition at 300 µg/ml. R2 was calculated using the Pearson correlation coefficient. P-value is two-tailed. (b) Top and bottom graphs show binding against YU2gp120 and BG505SOSIP.664, respectively, as measured by ELISA. Numbers indicate the number of individuals tested per group. Black bars indicate the median with the 95% confidence intervals. (c) Pearson’s correlation of the neutralization screening results between all 12 global panel strains (middle section) and between each strain to the mean of all global panel strains among all 2,354 tested individuals. Viruses were ranked from best to worst correlation of the single respective virus to the mean of all 12 viruses. (d) Overview of the combinations of the best correlating viruses as identified in c. (e) Pearson’s correlation of the mean of combinations of the best correlating viruses as depicted in c and d to the mean neutralization against all 12 pseudoviruses in 2,354 tested individuals. (f) Ranking of individuals according to the reduced pseudovirus sets. Individuals were ranked by their mean neutralization results against the best correlating virus mixes. Right bar indicates the ranking of individuals according to their mean neutralization against all 12 viruses. This ranking also sets the color per individual in the other ranking (white bars: individuals not among the top 100 participants when using mean of all 12 viruses).
Extended Data Fig. 2
Extended Data Fig. 2. Validation of f61-panel based epitope predictions.
(a) Broadly neutralizing antibody (bNAb) IC50 values (µg/ml) against wild type and mutated BG505T332N pseudovirus. First column indicates the epitopes of the respective tested bNAbs. (b) Participants’ IgG IC50 values (in µg/ml) against wildtype and mutated BG505T332N pseudovirus. First column indicates the neutralization rank of each individual among the 2,354 HIV infected individuals, followed by each participant’s IDs and each individuals IgGs IC50 (µg/ml) against wild type BG505T332N. Right panel shows the change in IgG sensitivity (fold change of IC50) for BG505T332N mutants compared with the wild type. Defined epitopes (fold change of ≥2 against a mutated BG505T332N pseudovirus) were marked in the respective colors. (c) Escape at all sites from participants’ IgGs in the BF520 Env ectodomain (for participants IDC508, IDF003, IDC561 and IDC513) as defined by the lentivirus deep mutational scanning assay and in the BG505 Env ectodomain (all other participants) as defined by the HIV DMS assay. Positive values represent sites where mutations cause escape. Prediction of f61-panel of the respective participant is shown on the left. Colored panel shows the respective epitopes of Env. The numbers at the bottom of each panel indicate the HIV-1 Env residues numbered according to HIV-1HXB2. IDC561 shows escape at binding sites of the CD4 binding site bNAb 1–18, isolated from this individual. Thus, IDC561 was counted as individual for which the predicted epitope was confirmed. (d) Pie charts show the results from the f61-panel based computational epitope prediction (left), from the BG505 mutation panel (middle) and from the deep mutational scanning (DMS, right). Slices indicate the fraction of individuals. Predicted scores >30% in f61 panel count as ‘defined’. Numbers indicate n of individuals tested. For the BG505 mutation panel, individuals for whom the f61 epitope prediction did not result in a defined epitope (n = 3) and individuals with only low potency against BG505 wild type (n = 4) were excluded for this analysis. (e) Pie chart shows combined results from the experimental validation of the f61 panel-based prediction by either the BG505 mutation panel or DMS. A predicted epitope was counted as validated when the epitope with highest f61 delineation score in each individual was also identified by at least one of the other assays. Slices indicate the fraction of individuals. Number indicates the number of individuals in whom f61-based prediction and at least one of the BG505 mutation panel or DMS resulted in a defined epitope.
Extended Data Fig. 3
Extended Data Fig. 3. Durability of HIV-1 neutralization is determined by the amount of antigen exposure.
(a) Clinical characteristics of the groups that were selected by differing viremia over time. P-values marked with ‘a’ were calculated by one-way ANOVA. P-values marked with ‘b’ were calculated using Pearson’s Chi-square test. (b) Neutralization activity against the global panel. Each dot represents a single participant’s IgGs against one virus. Black bars indicate the median. Gray bars indicate the upper and lower quartile. Depicted IC50 values at the top indicate the median IC50 of all individuals against all viruses. Breadth values indicate the median neutralization breadth of all individuals in the respective group. No significant differences were found between the median IC50s between each respective group (p > 0.05). (c) Neutralization dynamics of individuals between baseline and 2nd visit. Dots are the mean areas under the curves (AUC) of the in vitro IgG neutralization curves against the global panel pseudoviruses at each respective visit. Each pair of dots represent the neutralization dynamics of one participant. The red line shows a learned linear mixed model describing AUC changes between baseline- and 2nd visit. Light red areas indicate the 95% confidence bands. (d) Slope indicates the daily increase (positive values) or decrease (negative values) of neutralization activity in the respective groups. P-values indicate the significance of a comparison between the here used model of AUC changes over time and a model that ignores the time variable (R-function stats::anova). The left table shows models fitted to the mean AUC, which are used for visualization. The right table shows models fitted to the log2-transformed mean AUC, which are used for the calculation of half-life estimates. (e) Gray lines show learned linear mixed models describing AUC changes between baseline- and 2nd visit per virus. Red lines show the mean fitted line of all viruses.
Extended Data Fig. 4
Extended Data Fig. 4. HIV-1 neutralization dynamics between 2nd and 3rd visit.
(a) Time in months between baseline visit (gray dots), 2nd visit (green dots) and 3rd visit (turquoise dots). 44 individuals had blood draws at 3 visits. (b) Neutralization dynamics of individuals between 2nd and 3rd visit. Dots are the mean areas under the curves (AUC) of the IgG neutralization curves against the global panel pseudoviruses at each respective visit. Each pair of dots represent the neutralization dynamics of one individual. The red line shows a learned linear mixed model describing AUC changes between 2nd and 3rd visit. Light red areas indicate the 95% confidence bands. (c) Fitted linear mixed models in detail. Slope indicates the daily increase (positive values) or decrease (negative values) of neutralization activity in the respective groups. P-values indicate the significance of a comparison between the here used model of AUC changes over time and a model that ignores the time variable (R-function stats::anova). The left table shows models fitted to the mean AUC, which are used for visualization. The right table shows models fitted to the log2-transformed mean AUC, which are used for the calculation of half-life estimates. (d) Neutralization dynamics of participants between 2nd visit and 3rd visit. Dots are the mean areas under the neutralization curves (AUC) of the in vitro IgG neutralization curves against the global panel pseudoviruses at each respective visit. Each pair of dots represent the neutralization dynamics of one participant. Red lines show a learned linear mixed model describing AUC changes between baseline- and 2nd visit. Light red areas indicate the 95% confidence bands. Half-lifes (t1/2) were calculated from the slope of separate mixed models fitted to the binary logarithm of the mean AUC.
Extended Data Fig. 5
Extended Data Fig. 5. Neutralization dynamics in elite neutralizer IDC561.
(a) Neutralization activity of IDC561 IgG against the global panel, YU2 and BG505 at four different time points. (b) Half maximal effective concentration (50% effective concentration (EC50)) of individual IDC561’s IgGs from different timepoints against the indicated HIV-1 Env antigens as determined by ELISA. Each dot represents the mean EC50 of two individual experiments. Line indicates the median EC50. (c) ELISA binding curves of (B) (d) Large pie charts show the numbers of heavy-chain sequences identified by single cell sorting. Smaller pie charts indicate the amount of total and clonal heavy-chain sequences as identified by single cell sorting with the respective HIV-1 Env bait. (e) Comparison of total B cell repertoire of IDC561 at the 1st and 2nd apheresis timepoints. Top panel shows frequency of IgG heavy chain variable region (VH)-genes. Bottom panel shows IgM VH-genes. Dots show results of replicates for which two independently sorted batches of IgG+ and IgM+ B cells, respectively, were used.
Extended Data Fig. 6
Extended Data Fig. 6. Gating strategy for HIV-1 specific single b cell sorting.
Example of the gating strategy used for a single cell sorting of BG505SOSIP.664- (a) or YU2gp140-reactive (b) IgG+ b cells. * biotinylated YU2gp140 labeled with Streptavidin-PE.
Extended Data Fig. 7
Extended Data Fig. 7. LC-MS/MS detection of clone 4 from individual IDC561.
(a) Representative tryptic peptides of 1–18 mAbs detected by LC-MS/MS. Human plasma was mixed with purified monoclonal 1–18 antibody at 1:10 or 1:100, mass ratio. Anti- BG505SOSIP.664 antibodies were purified by affinity chromatography and tryptic peptides derived from CDR1, CDR2, CDR3 region of 1–18 mAbs were identified by LC-MS/MS. The unique CDRH1 peptide ADDDPYTDDDTFTK was also detected at a 1:1,000 dilution with a low XIC value. (b) Unique tryptic CDRH1 and CDRH3 peptides derived from Clone 4 detected by LC-MS/MS at different timepoints.

References

    1. Zinkernagel RM, et al. Neutralizing antiviral antibody responses. Adv. Immunol. 2001;79:1–53. doi: 10.1016/S0065-2776(01)79001-3. - DOI - PMC - PubMed
    1. Zohar T, Alter G. Dissecting antibody-mediated protection against SARS-CoV-2. Nat. Rev. Immunol. 2020;20:392–394. doi: 10.1038/s41577-020-0359-5. - DOI - PMC - PubMed
    1. Corti D, Lanzavecchia A. Broadly neutralizing antiviral antibodies. Annu. Rev. Immunol. 2013;31:705–742. doi: 10.1146/annurev-immunol-032712-095916. - DOI - PubMed
    1. Wei X, et al. Antibody neutralization and escape by HIV-1. Nature. 2003;422:307–312. doi: 10.1038/nature01470. - DOI - PubMed
    1. Landais E, Moore PL. Development of broadly neutralizing antibodies in HIV-1 infected elite neutralizers. Retrovirology. 2018;15:61. doi: 10.1186/s12977-018-0443-0. - DOI - PMC - PubMed