. 2023 Dec;29(12):3212-3223.
doi: 10.1038/s41591-023-02611-1. Epub 2023 Nov 13.

Viral and host mediators of non-suppressible HIV-1 viremia

Affiliations

Viral and host mediators of non-suppressible HIV-1 viremia

Abbas Mohammadi et al. Nat Med. 2023 Dec.

Abstract

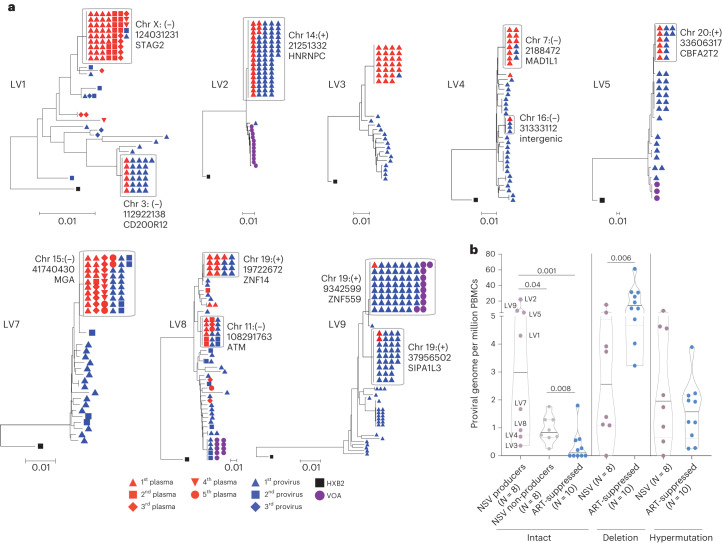
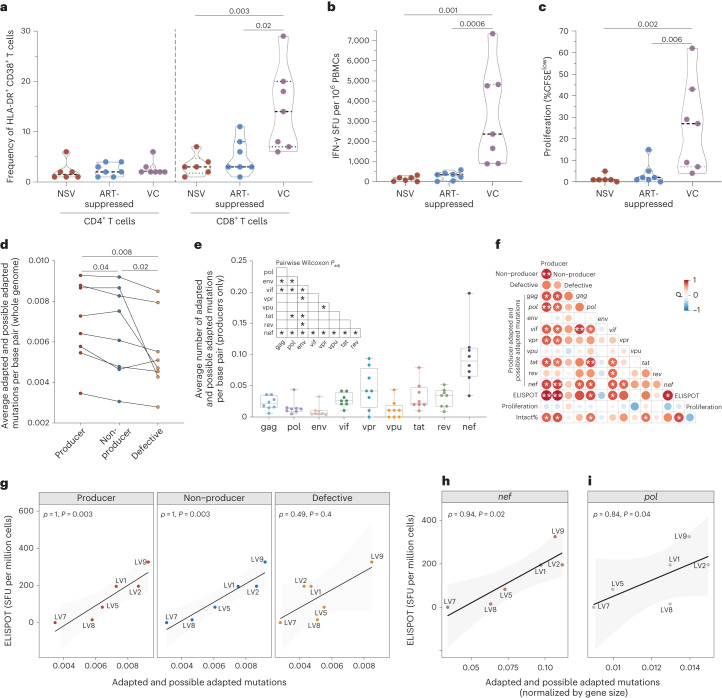
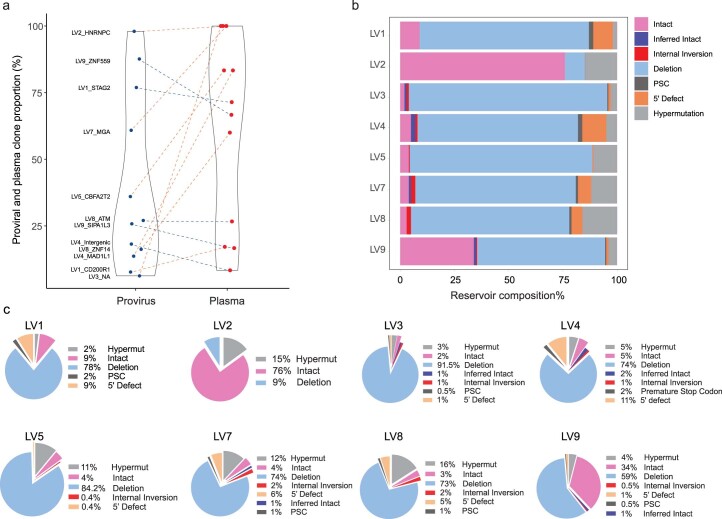
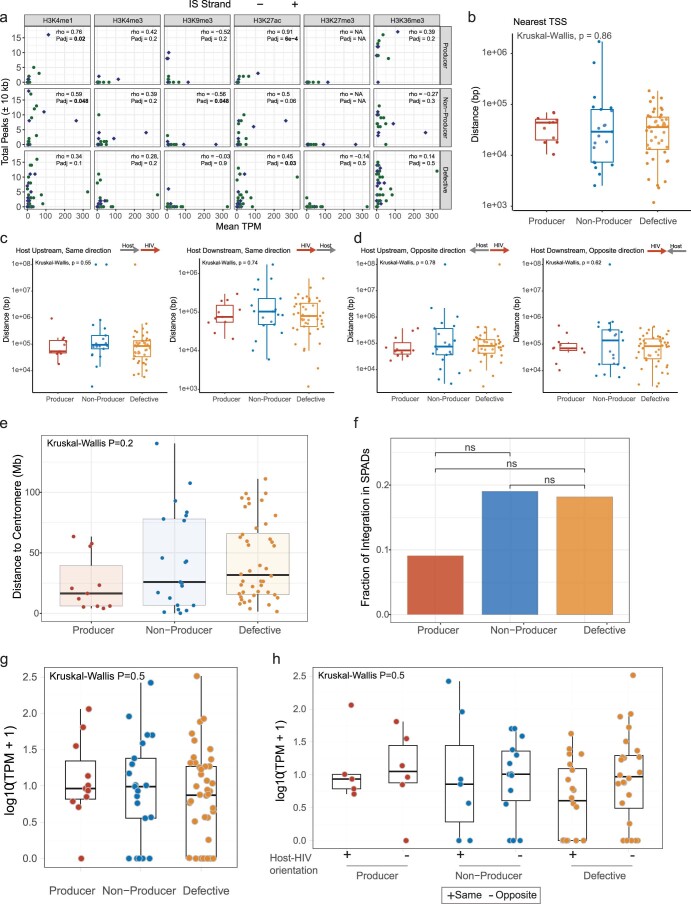
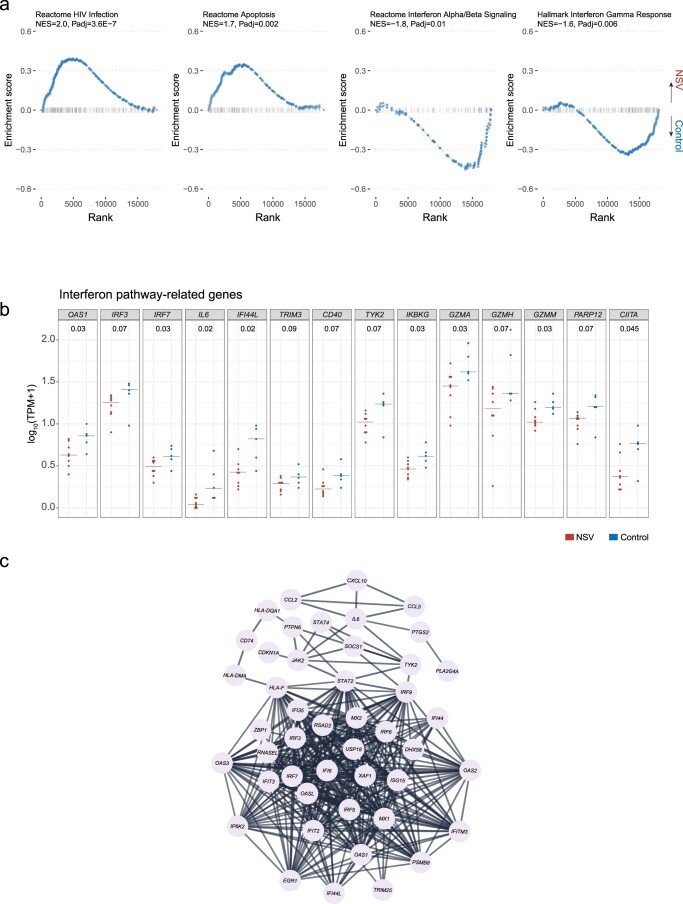
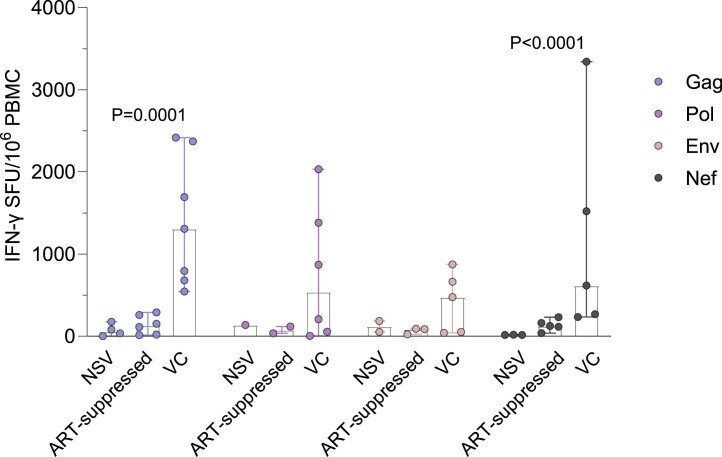
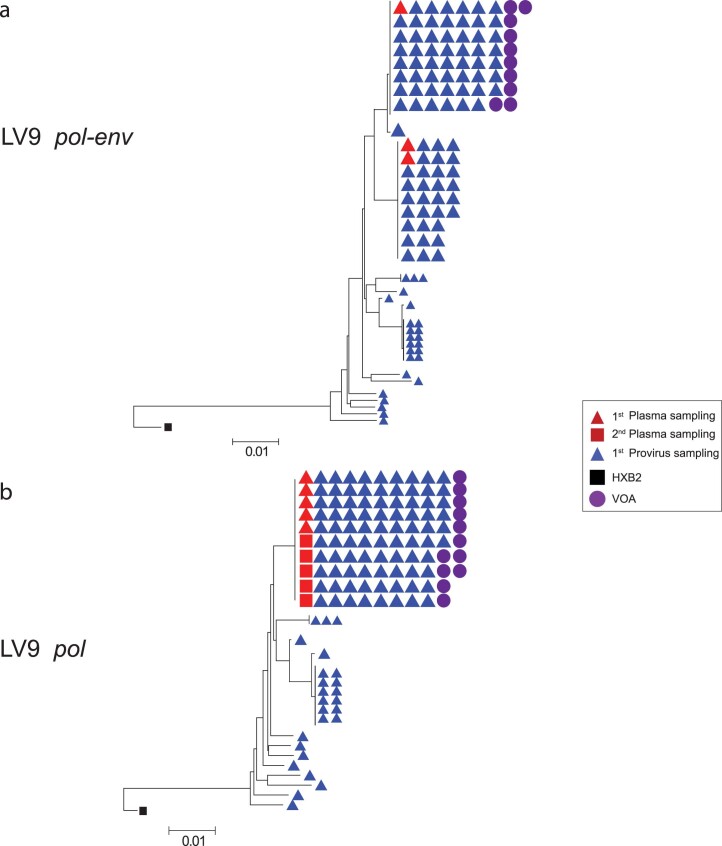
Non-suppressible HIV-1 viremia (NSV) is defined as persistent low-level viremia on antiretroviral therapy (ART) without evidence of ART non-adherence or significant drug resistance. Unraveling the mechanisms behind NSV would broaden our understanding of HIV-1 persistence. Here we analyzed plasma virus sequences in eight ART-treated individuals with NSV (88% male) and show that they are composed of large clones without evidence of viral evolution over time in those with longitudinal samples. We defined proviruses that match plasma HIV-1 RNA sequences as 'producer proviruses', and those that did not as 'non-producer proviruses'. Non-suppressible viremia arose from expanded clones of producer proviruses that were significantly larger than the genome-intact proviral reservoir of ART-suppressed individuals. Integration sites of producer proviruses were enriched in proximity to the activating H3K36me3 epigenetic mark. CD4+ T cells from participants with NSV demonstrated upregulation of anti-apoptotic genes and downregulation of pro-apoptotic and type I/II interferon-related pathways. Furthermore, participants with NSV showed significantly lower HIV-specific CD8+ T cell responses compared with untreated viremic controllers with similar viral loads. We identified potential critical host and viral mediators of NSV that may represent targets to disrupt HIV-1 persistence.


Conflict of interest statement

J.R.C.M. has received funding from Gilead Sciences for investigator-initiated research paid to his institution. P.L.A. has received past consulting fees from Gilead, ViiV and Merck and research funding from Gilead paid to institution, unrelated to this work. G.D.G. has received grant funding from Merck. J.Z.L. has consulted for Abbvie and received grant funding from Merck. The other authors declare no competing interests.

Figures

Fig. 1
Fig. 1. Example participant with non-suppressible viremia (LV1).
a, Viral loads and CD4+ T cell count from the time of virologic suppression. Downward blue and orange arrows indicate timing of drug resistance and plasma drug level testing, respectively. Sampling times for viral genetic analyses are in black arrows. Antiretroviral resistance mutations from both clinical testing and the largest plasma clone from single-genome sequencing are shown in the table insert. The "(C)" denotes a clinical resistance testing result. b, Neighbor joining trees of proviral and plasma pol-env sequences in blue and red, respectively. Producers defined as proviruses with exact matches to plasma HIV-1 RNA sequences. Non-producers are proviruses that do not match any plasma HIV-1 RNA sequences. Shape indicates sampling time point, corresponding to black arrows in a. RPV, rilpivirine; TDF, tenofovir disoproxil fumarate; FTC, emtricitabine; ATV/r, atazanavir/ritonavir; TAF, tenofovir alafenamide; DTG, dolutegravir; DRV/r, darunavir/ritonavir; NRTI, nucleoside reverse transcriptase inhibitors; NNRTI, non-nucleoside reverse transcriptase inhibitors; IN, integrase; PI, protease inhibitor.
Fig. 2
Fig. 2. Sequencing overview of the non-suppressible viremia cohort.
a, Neighbor joining trees show intact proviral and plasma sequences from different time points. The host integration sites of the producer proviruses are labeled. b, Comparison of reservoir size (number of proviral sequences per million cells) for producer proviruses versus non-producer proviruses in participants with NSV versus intact proviral reservoir size of ART-suppressed individuals. Median and interquartile ranges are labeled in the violin plot. Two-sided Wilcoxon matched-pairs signed-rank test and Mann–Whitney U tests were used for comparisons.
Fig. 3
Fig. 3. Integration sites and chromatin features of HIV-1 proviruses.
a, Circos plot showing the location of each integration site across human chromosomes. b, Karyotyping heatmap showing the percentage of integration sites in each human chromosome for different classes of proviruses. Fisher’s exact test was used. c, Number of peaks for key histone marks in 10-kb regions flanking the proviral integration sites. Center lines represent medians. We used Tukey boxplots, in which boxes represent median values and first–third quartiles. Two-sided Kruskal–Wallis test was used to evaluate if there was significant differences among three groups and if so, two-sided Mann–Whitney U test was used to compare between-group differences. d, Correlation between enrichment of H3K36me3 histone marks near producer proviral integration sites and plasma clone viral loads (viral load multiplied by fraction of plasma sequences matching the producer provirus). Host gene integration sites are labeled. Two-sided Spearman correlation test was used. VL, viral load.
Fig. 4
Fig. 4. Transcriptomic analysis of CD4+ T cells from participants with NSV.
a, Volcano plot shows DEGs in participants with NSV versus ART-suppressed individuals. Red and blue colors highlight differential statistical significance. Adjustments were made for multiple comparisons using the Benjamini–Hochberg method built in the DESeq2 package. b, Normalized enrichment score (NES) reflects the degree to which a set of genes is overrepresented among genes that are differentially expressed between participants with NSV and ART-suppressed control participants. Bar plot represents positively (red) and negatively (blue) correlated pathways. Adjustments were made for multiple comparisons using the Benjamini–Hochberg method. c, Genes related to apoptosis/cell death enriched in participants with NSV. d, Comparison of anti-apoptotic and pro-apoptotic gene transcription levels between NSV and ART-suppressed control group. Two-sided Mann–Whitney U tests were used for comparisons. TPM, transcripts per million.
Fig. 5
Fig. 5. HIV-specific CD8+ T cell response and HLA class I escape mutations.
a, Frequency of HLA-DR+CD38+ in CD4+ and CD8+ T cells. b, HIV-specific CD8+ T cell ELISPOT responses in NSV, ART-suppressed, and viremic controller (VC) cohorts. SFU, spot forming units. c, HIV-specific CD8+ T cell proliferation responses. Medians and interquartile ranges are shown in the violin plots. Two-sided Mann–Whitney U test was used. d, Average numbers of adapted and possible adapted HLA escape mutations per base across producer, non-producer and defective proviral sequences. Wilcoxon matched-pairs signed-rank testing was used. e, Average number of mutations per base pair for each HIV-1 gene in producer proviruses (n = 8). Two-sided pairwise Wilcoxon signed-rank test was used, and adjustments were made for multiple comparisons using the Benjamini–Hochberg method. In the boxplots, center lines indicated median, box limits indicated upper and lower quartiles and whiskers indicated minimal and maximal values. f, Spearman correlation between adapted and possible adapted mutations in different HIV-1 genes in producer proviruses alongside CD8+ T cell proliferation activity and percent intact provirus. g, Spearman correlation between adapted and possible adapted mutations in three proviral classes and CD8+ T cell activity (ELISPOT). h,i, Spearman correlation between CD8+ T cell activity (ELISPOT) versus average adapted and possible adapted mutations in nef (h) and pol (i) in producer proviruses (normalized for gene size). Spearman correlation test was used. NS, not significant; *P < 0.05, **P < 0.01.
Extended Data Fig. 1
Extended Data Fig. 1. Viral load and CD4+ T cell count for seven NSV participants (Supplementary to Fig. 1).
The table in each figure panel shows presence or absence of drug resistance mutations from both clinical testing and the largest plasma clone from single-genome sequencing. The "(C)" denotes a clinical resistance testing result.
Extended Data Fig. 2
Extended Data Fig. 2. Reservoir size and composition for non-suppressible viremia participants (Supplementary to Fig. 2).
(a) Comparison of proportion of the proviral and plasma HIV sequences comprised of each producer clone. Red dotted lines represent higher plasma clone frequency and blue dotted lines present higher proviral clone frequency. (b) and (c) Percentage of intact and defective proviral species for each NSV participant.
Extended Data Fig. 3
Extended Data Fig. 3. Integration site features (Supplementary to Fig. 3).
(a) Correlation between enrichment of histone marks in producer integration sites and transcripts per million (TPM) from CD4+ T cell bulk RNA-seq results of each corresponding host gene harboring a provirus. On x-axis, total peak numbers in ± 10 kb flanking regions of n = 11 producer, n = 21 nonproducer and n = 44 defective integration sites from NSV samples were compared to each host gene TPM in their CD4 + T cells on y-axis. Two-sided Spearman correlation tests were used for the comparisons. (b) The distance of integration sites in each class of proviruses to the nearest transcriptional start sites (TSS). (c) The distance between the integration site to the TSS when HIV-1 or host genes are in the same orientation. (d) The distance between the integration site to the TSS when HIV-1 or host genes are in the opposite orientation. For figures b-d, n = 11 producer, n = 21 nonproducer and n = 44 defective integration sites from NSV samples were compared to each other. (e) The distance from the integration sites of different proviral classes to the centromere. Two-sided Kruskal-Wallis and Mann-Whitney U tests were used for comparisons. (f) Fraction of integration sites in speckle-associated domains (SPADs). Chi-squared test was used for comparisons. (g) Transcriptomic level of HIV host genes for producers, non-producers and defectives. For (e)-(g), n = 11 producer, n = 21 nonproducer and n = 44 defective integration sites from NSV samples were compared to each other. (h) Transcriptomic level of host genes for producers, non-producers and defectives categorized by directionality to closest host genes. We compared the number of transcripts per million cells for the host gene of each integrated provirus, including categorizing by the relative direction of the provirus to the host gene. “+” represents human and HIV genome in the same and “- “represents human and HIV in the opposite orientation of their transcriptions. Total of n = 11 producer (5 integrations site in the same and 6 in the opposite orientation), n = 21 nonproducer (7 integrations site in the same and 14 in the opposite orientation) and n = 44 defective (20 integrations site in the same and 24 in the opposite orientation) integration sites from NSV samples were compared to each other. All the boxplots in this figure are in the format of the Tukey boxplot, with the center line indicating median, box limits indicating upper and lower quartiles and the whiskers indicating 1.5x interquartile range. Two-sided Kruskal-Wallis or Mann-Whitney U tests was used for comparisons, if not otherwise specified. For P values, ns, not significant.
Extended Data Fig. 4
Extended Data Fig. 4. Transcriptomic analysis of CD4 + T cells from NSV and ART-suppressed participants (Supplementary to Fig. 4).
(a) Gene Set Enrichment Analysis (GSEA) plots show selected pathways that were up- or down-regulated in NSV vs. ART-suppressed (control) groups. Adjustments were made for multiple comparisons using the Benjamini-Hochberg method. (b) Two-sided Wilcoxon rank sum test was used to evaluate interferon (IFN)-related gene expression levels between NSV and control groups. Bars represent median values. (c) Gene network related to IFN signaling enriched in the control group generated by STRING analysis.
Extended Data Fig. 5
Extended Data Fig. 5. Soluble inflammatory markers in NSV versus ART-suppressed participants.
(a) IL-10. (b) IL-6. (c) IFN-γ, (d) TGF-β1, (e) TGF-β2, (f) TGF-β3, (g) TNF-RI, (h) TNF-RII, (i) CD-163, (j) D-Dimer, (k) CRP and (l) soluble CD14 in NSV and ART-suppressed cohorts. Center lines indicated median levels and dotted lines indicated the first and third quartiles. The two-sided Mann-Whitney U test was used for comparisons.
Extended Data Fig. 6
Extended Data Fig. 6. Viral load and CD4 + T cell features among NSV, ART-suppressed, and viremic controller cohorts.
(a) Viral load of participants in NSV, ART-suppressed and viremic controller (VC) cohorts. (b) Mean fluorescence intensity (MFI) values of CD4 in NSV, ART-suppressed, and VC cohorts. (c) Frequency of CD4 + T cells. Center lines indicated median levels and dotted lines indicated the first and third quartiles. Two-sided Mann-Whitney U test was used.
Extended Data Fig. 7
Extended Data Fig. 7. HIV-specific CD8+ T cell response among NSV, ART-suppressed, and viremic controller cohorts.
For Gag-specific CD8+ T cell response, we had n = 4, n = 6 and n = 8 responses for NSV, ART-suppressed and VC samples, respectively. For Pol-specific response, we had n = 1, n = 2 and n = 7 responses from NSV, ART-suppressed and VC samples, respectively. For Env-specific response, we had n = 2, n = 3 and n = 6 responses from NSV, ART-suppressed and VC samples, respectively. For Nef-specific response, we had n = 3, n = 5 and n = 6 responses from NSV, ART-suppressed and VC samples, respectively. Bars represented median values and error bars indicated 95% confidence interval. Two-sided Kruskal-Wallis test was used to detect differences among three different cohorts. SFU, spot forming unit.
Extended Data Fig. 8
Extended Data Fig. 8. HLA class I escape mutations by different HIV-1 genes.
Average number of adapted and possible adapted HLA escape mutations in producer, non-producer, and defective proviral sequences across the HIV-1 genome (normalized for gene size) among eight participants with NSV. Center lines in boxplots indicated median, box limits indicated upper and lower quartiles and the whiskers indicated minimal and maximal values. Friedman test was conducted within each gene area and Nemenyi post-hoc pair-wise tests were performed to evaluate the difference between two different proviral groups.
Extended Data Fig. 9
Extended Data Fig. 9. Location of deletions in the 5’ leader sequence in three NSV participants.
Deletions are shown in the black regions at the bottom. Ψ, PSI element; SL1, stem loop; SL2, stem loop; DIS, dimerization initiation site; MSD, major splicing donor.
Extended Data Fig. 10
Extended Data Fig. 10. Neighbor joining trees of LV9 trimmed either to the pol-env or pol regions.
(a) Proviral and plasma sequences trimmed to the pol-env region. This panel is reproduced from Fig. 2a. (b) Proviral and plasma sequences trimmed on the pol region alone showing an inability to discriminate between two clonal populations seen with pol-env sequencing.

Update of

  • Viral and Host Mediators of Non-Suppressible HIV-1 Viremia.
    Mohammadi A, Etemad B, Zhang X, Li Y, Bedwell GJ, Sharaf R, Kittilson A, Melberg M, Wong C, Fajnzylber J, Worrall DP, Rosenthal A, Jordan H, Jilg N, Kaseke C, Giguel F, Lian X, Deo R, Gillespie E, Chishti R, Abrha S, Adams T, Siagian A, Anderson PL, Deeks SG, Lederman MM, Yawetz S, Kuritzkes DR, Lichterfeld MD, Tsibris A, Carrington M, Brumme ZL, Castillo-Mancilla JR, Engelman AN, Gaiha GD, Li JZ. Mohammadi A, et al. medRxiv [Preprint]. 2023 Mar 31:2023.03.30.23287124. doi: 10.1101/2023.03.30.23287124. medRxiv. 2023. Update in: Nat Med. 2023 Dec;29(12):3212-3223. doi: 10.1038/s41591-023-02611-1. PMID: 37034605 Free PMC article. Updated. Preprint.

References

    1. Halvas EK, et al. HIV-1 viremia not suppressible by antiretroviral therapy can originate from large T cell clones producing infectious virus. J. Clin. Invest. 2020;130:5847–5857. - PMC - PubMed
    1. Laprise C, de Pokomandy A, Baril JG, Dufresne S, Trottier H. Virologic failure following persistent low-level viremia in a cohort of HIV-positive patients: results from 12 years of observation. Clin. Infect. Dis. 2013;57:1489–1496. - PubMed
    1. Ryscavage P, Kelly S, Li JZ, Harrigan PR, Taiwo B. Significance and clinical management of persistent low-level viremia and very-low-level viremia in HIV-1-infected patients. Antimicrob. Agents Chemother. 2014;58:3585–3598. - PMC - PubMed
    1. Redd AD, et al. ART adherence, resistance, and long-term HIV viral suppression in postpartum women. Open Forum Infect. Dis. 2020;7:ofaa346. - PMC - PubMed
    1. Dharan NJ, Cooper DA. Long-term durability of HIV viral load suppression. Lancet HIV. 2017;4:e279–e280. - PubMed