. 2023 Dec;624(7990):92-101.
doi: 10.1038/s41586-023-06723-z. Epub 2023 Nov 13.

Integrated global assessment of the natural forest carbon potential

Lidong Mo #  1 Constantin M Zohner #  2 Peter B Reich  3   4   5 Jingjing Liang  6 Sergio de Miguel  7   8 Gert-Jan Nabuurs  9 Susanne S Renner  10 Johan van den Hoogen  11 Arnan Araza  9 Martin Herold  12 Leila Mirzagholi  11 Haozhi Ma  11 Colin Averill  11 Oliver L Phillips  13 Javier G P Gamarra  14 Iris Hordijk  11 Devin Routh  15 Meinrad Abegg  16 Yves C Adou Yao  17 Giorgio Alberti  18   19 Angelica M Almeyda Zambrano  20 Braulio Vilchez Alvarado  21 Esteban Alvarez-Dávila  22 Patricia Alvarez-Loayza  23 Luciana F Alves  24 Iêda Amaral  25 Christian Ammer  26 Clara Antón-Fernández  27 Alejandro Araujo-Murakami  28 Luzmila Arroyo  28 Valerio Avitabile  29 Gerardo A Aymard  30   31 Timothy R Baker  13 Radomir Bałazy  32 Olaf Banki  33 Jorcely G Barroso  34 Meredith L Bastian  35   36 Jean-Francois Bastin  37 Luca Birigazzi  38 Philippe Birnbaum  39   40   41 Robert Bitariho  42 Pascal Boeckx  43 Frans Bongers  9 Olivier Bouriaud  44 Pedro H S Brancalion  45 Susanne Brandl  46 Francis Q Brearley  47 Roel Brienen  13 Eben N Broadbent  20 Helge Bruelheide  48   49 Filippo Bussotti  50 Roberto Cazzolla Gatti  51 Ricardo G César  45 Goran Cesljar  52 Robin L Chazdon  53   54 Han Y H Chen  55 Chelsea Chisholm  11 Hyunkook Cho  56 Emil Cienciala  57   58 Connie Clark  59 David Clark  60 Gabriel D Colletta  61 David A Coomes  62 Fernando Cornejo Valverde  63 José J Corral-Rivas  64 Philip M Crim  65   66 Jonathan R Cumming  65 Selvadurai Dayanandan  67 André L de Gasper  68 Mathieu Decuyper  9 Géraldine Derroire  69 Ben DeVries  70 Ilija Djordjevic  71 Jiri Dolezal  72   73 Aurélie Dourdain  69 Nestor Laurier Engone Obiang  74 Brian J Enquist  75   76 Teresa J Eyre  77 Adandé Belarmain Fandohan  78 Tom M Fayle  79   80 Ted R Feldpausch  81 Leandro V Ferreira  82 Leena Finér  83 Markus Fischer  84 Christine Fletcher  85 Lorenzo Frizzera  86 Damiano Gianelle  86 Henry B Glick  87 David J Harris  88 Andrew Hector  89 Andreas Hemp  90 Geerten Hengeveld  9 Bruno Hérault  91   92 John L Herbohn  93 Annika Hillers  94   95 Eurídice N Honorio Coronado  96 Cang Hui  97   98 Thomas Ibanez  99 Nobuo Imai  100 Andrzej M Jagodziński  101   102 Bogdan Jaroszewicz  103 Vivian Kvist Johannsen  104 Carlos A Joly  105 Tommaso Jucker  106 Ilbin Jung  56 Viktor Karminov  107 Kuswata Kartawinata  108 Elizabeth Kearsley  109 David Kenfack  110 Deborah K Kennard  111 Sebastian Kepfer-Rojas  104 Gunnar Keppel  112 Mohammed Latif Khan  113 Timothy J Killeen  28 Hyun Seok Kim  114   115   116   117 Kanehiro Kitayama  118 Michael Köhl  119 Henn Korjus  120 Florian Kraxner  121 Dmitry Kucher  122 Diana Laarmann  120 Mait Lang  120 Huicui Lu  123 Natalia V Lukina  124 Brian S Maitner  75 Yadvinder Malhi  125 Eric Marcon  126 Beatriz Schwantes Marimon  127 Ben Hur Marimon-Junior  127 Andrew R Marshall  93   128   129 Emanuel H Martin  130 Jorge A Meave  131 Omar Melo-Cruz  132 Casimiro Mendoza  133 Irina Mendoza-Polo  134 Stanislaw Miscicki  135 Cory Merow  53 Abel Monteagudo Mendoza  136   137 Vanessa S Moreno  45 Sharif A Mukul  93   138 Philip Mundhenk  119 María Guadalupe Nava-Miranda  139   140 David Neill  141 Victor J Neldner  77 Radovan V Nevenic  71 Michael R Ngugi  77 Pascal A Niklaus  142 Jacek Oleksyn  101 Petr Ontikov  107 Edgar Ortiz-Malavasi  21 Yude Pan  143 Alain Paquette  144 Alexander Parada-Gutierrez  28 Elena I Parfenova  145 Minjee Park  6   114 Marc Parren  146 Narayanaswamy Parthasarathy  147 Pablo L Peri  148 Sebastian Pfautsch  149 Nicolas Picard  150 Maria Teresa F Piedade  151 Daniel Piotto  152 Nigel C A Pitman  23 Axel Dalberg Poulsen  88 John R Poulsen  58   153 Hans Pretzsch  154   155 Freddy Ramirez Arevalo  156 Zorayda Restrepo-Correa  157 Mirco Rodeghiero  86   158 Samir G Rolim  152 Anand Roopsind  159 Francesco Rovero  160   161 Ervan Rutishauser  162 Purabi Saikia  163 Christian Salas-Eljatib  164   165 Philippe Saner  166 Peter Schall  26 Mart-Jan Schelhaas  9 Dmitry Schepaschenko  121   167 Michael Scherer-Lorenzen  168 Bernhard Schmid  169 Jochen Schöngart  151 Eric B Searle  144 Vladimír Seben  170 Josep M Serra-Diaz  171   172 Douglas Sheil  146   173 Anatoly Z Shvidenko  121 Javier E Silva-Espejo  174 Marcos Silveira  175 James Singh  176 Plinio Sist  91 Ferry Slik  177 Bonaventure Sonké  178 Alexandre F Souza  179 Krzysztof J Stereńczak  31 Jens-Christian Svenning  180   181 Miroslav Svoboda  182 Ben Swanepoel  183 Natalia Targhetta  151 Nadja Tchebakova  145 Hans Ter Steege  33   184 Raquel Thomas  185 Elena Tikhonova  124 Peter M Umunay  186 Vladimir A Usoltsev  187 Renato Valencia  188 Fernando Valladares  189 Fons van der Plas  190 Tran Van Do  191 Michael E van Nuland  192 Rodolfo M Vasquez  136 Hans Verbeeck  109 Helder Viana  193   194 Alexander C Vibrans  68   195 Simone Vieira  196 Klaus von Gadow  197 Hua-Feng Wang  198 James V Watson  199 Gijsbert D A Werner  200 Susan K Wiser  201 Florian Wittmann  202 Hannsjoerg Woell  203 Verginia Wortel  204 Roderik Zagt  205 Tomasz Zawiła-Niedźwiecki  206 Chunyu Zhang  207 Xiuhai Zhao  207 Mo Zhou  6 Zhi-Xin Zhu  198 Irie C Zo-Bi  92 George D Gann  208 Thomas W Crowther  209
Affiliations

Integrated global assessment of the natural forest carbon potential

Lidong Mo et al. Nature. 2023 Dec.

Abstract

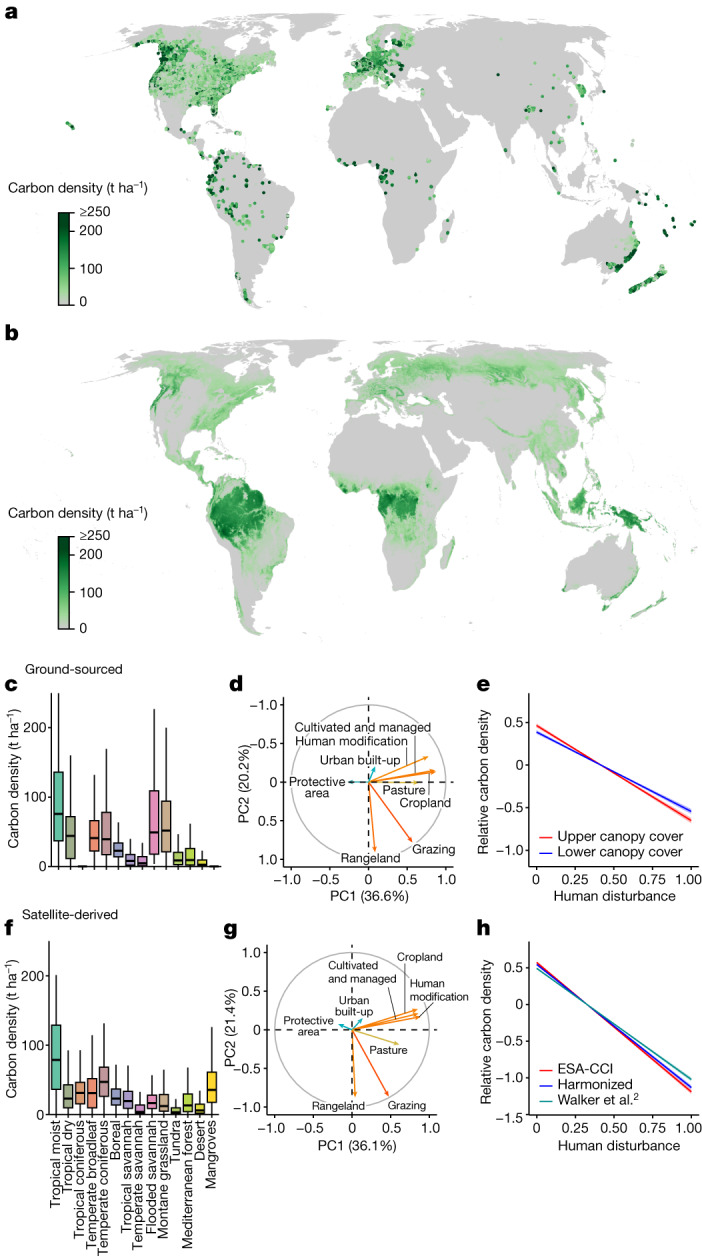
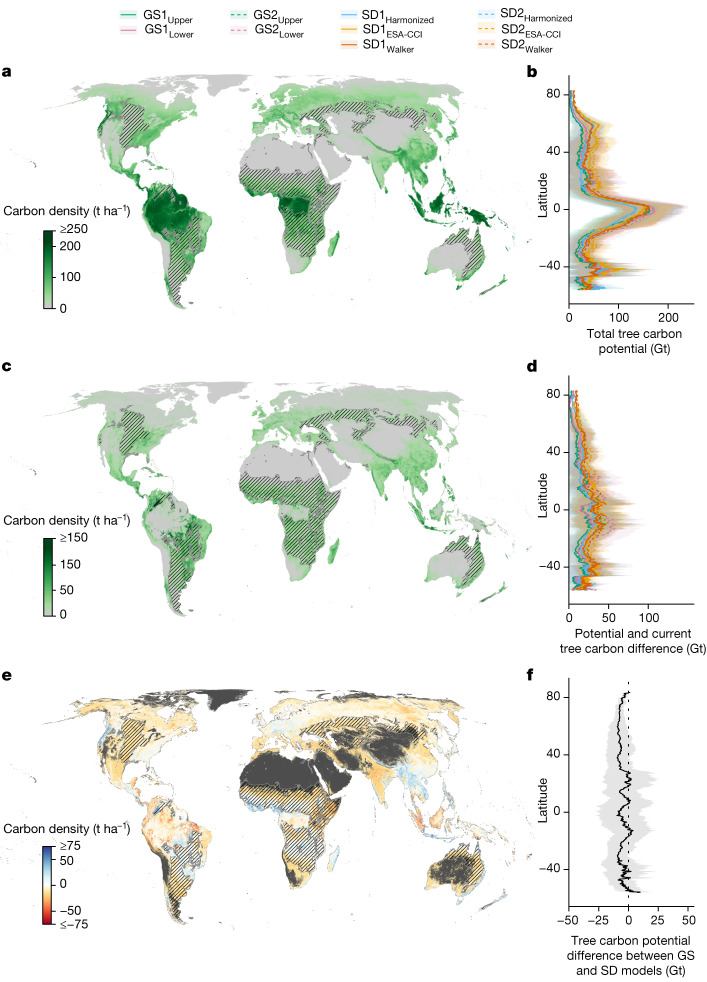
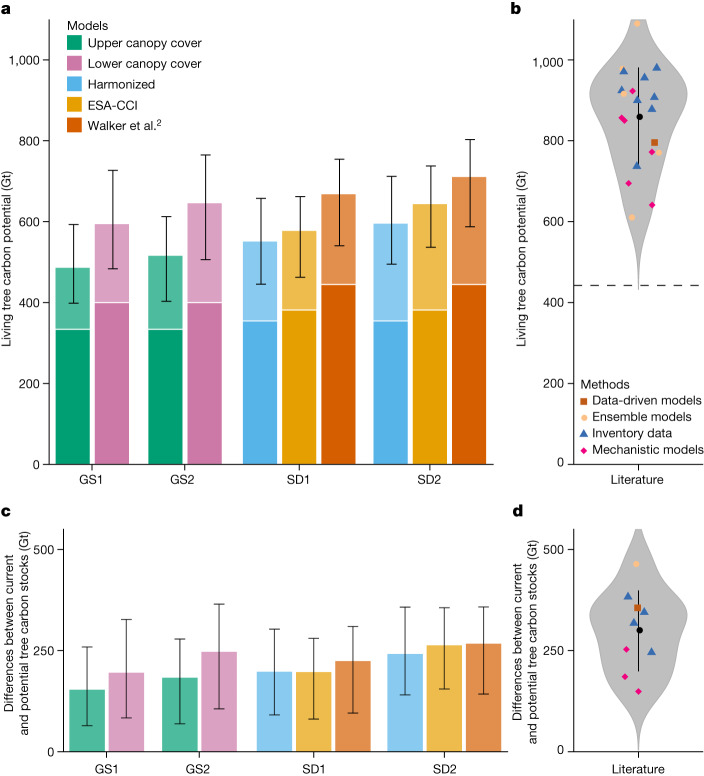
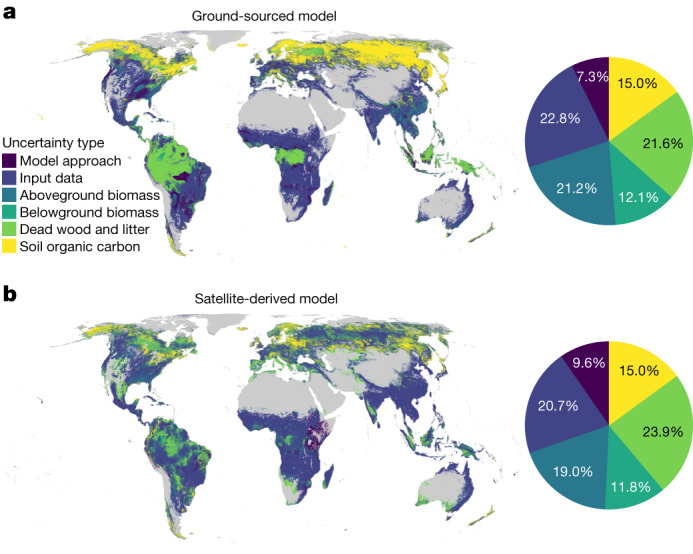
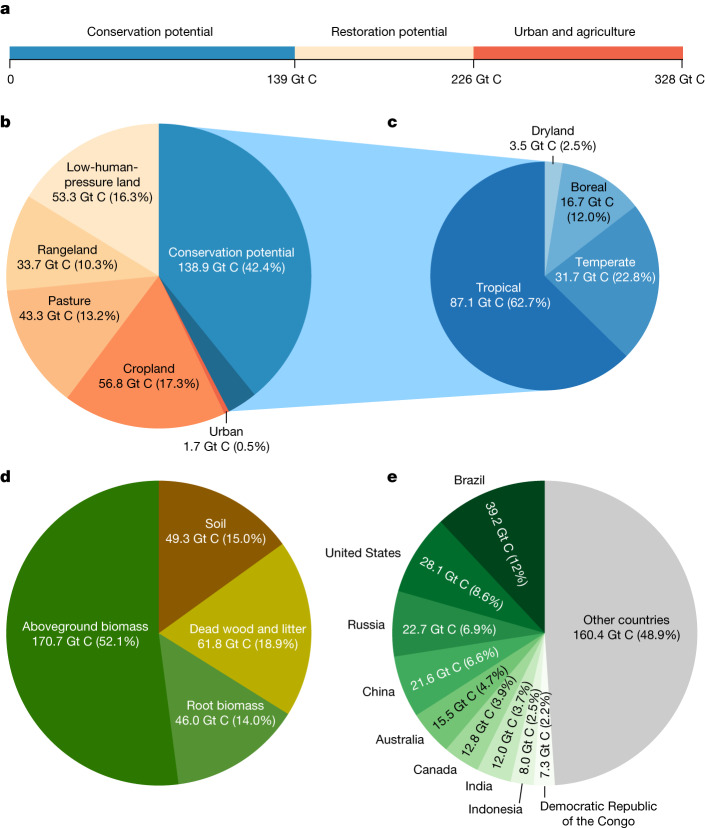
Forests are a substantial terrestrial carbon sink, but anthropogenic changes in land use and climate have considerably reduced the scale of this system1. Remote-sensing estimates to quantify carbon losses from global forests2-5 are characterized by considerable uncertainty and we lack a comprehensive ground-sourced evaluation to benchmark these estimates. Here we combine several ground-sourced6 and satellite-derived approaches2,7,8 to evaluate the scale of the global forest carbon potential outside agricultural and urban lands. Despite regional variation, the predictions demonstrated remarkable consistency at a global scale, with only a 12% difference between the ground-sourced and satellite-derived estimates. At present, global forest carbon storage is markedly under the natural potential, with a total deficit of 226 Gt (model range = 151-363 Gt) in areas with low human footprint. Most (61%, 139 Gt C) of this potential is in areas with existing forests, in which ecosystem protection can allow forests to recover to maturity. The remaining 39% (87 Gt C) of potential lies in regions in which forests have been removed or fragmented. Although forests cannot be a substitute for emissions reductions, our results support the idea2,3,9 that the conservation, restoration and sustainable management of diverse forests offer valuable contributions to meeting global climate and biodiversity targets.


Conflict of interest statement

The authors declare the following competing interests: T.W.C. serves as the chair of the UN Decade on Ecosystem Restoration, the chair of Restor.eco and he is an advisor to 1T.org. All are unpaid positions that aim to promote the equitable conservation and restoration of nature. R.L.C. is an advisor to 1T.org. J.-C.S. serves pro bono in the supervisory board for Rewilding Europe (non-governmental organisation), which is operating several interconnected initiatives to help make Europe a wilder place. P.H.S.B. is partner at Re.green, a company dedicated to restoring native ecosystems. S.A.M. at present serves as the executive director of BioCarbon International, a global think tank dedicated to achieving carbon neutrality through nature-based solutions. The position S.A.M. holds is voluntary and has no relation with the findings of the study.

Figures

Fig. 1
Fig. 1. The global distribution of tree carbon observations and the impact of human disturbances.
a, Map of ground-sourced aboveground tree carbon observations (GFBI data; aggregated to 30-arcsec (1-km2) resolution). b, Satellite-derived ESA-CCI map of current aboveground tree carbon stocks (1-km resolution). c,f, Observed biome-level tree carbon densities in existing forests based on ground-sourced (c) and satellite-derived (f) data. d,g, Principal component analysis (top two principal components shown) of the eight human-activity variables either directly or indirectly reflecting human-caused forest disturbances or the lack thereof, such as land-use change, human modification, cultivated and managed vegetation and wilderness area, to detect the effect of human disturbance on tree carbon densities for the ground-sourced (d) and satellite-derived data (g). e,h, Partial regression of the global variation in forest carbon density along the human-disturbance gradient (represented by the first principal component of the eight human-activity variables; see panels d and g) for the ground-sourced (e) and satellite-derived data (h), controlling for 40 environmental covariates. Relative carbon density is the observed carbon density divided by the global average.
Fig. 2
Fig. 2. The natural tree carbon potential under current climate conditions in the absence of humans.
a,b, The total living tree carbon potential of 600 Gt C within the natural canopy cover area of 4.4 billion ha2. c,d, The differences between current and potential tree carbon stocks, totalling 217 Gt C. e,f, The difference of tree carbon potential between the GS and SD models, subtracting the mean values of the six SD models from the mean values of the four GS models. Blue colours indicate that the GS models predict higher potential than the SD models, whereas red colours indicate the opposite. b,d,f, Latitudinal distributions (mean ± standard deviation) of the total tree carbon potential for the GS1, GS2, SD1 and SD2 models (b), the difference between current and potential tree carbon (d) and the difference of tree carbon potential between the GS and SD models (f). Maps represent the average estimates across all GS and SD models and are projected at 30-arcsec (about 1-km2) resolution. We show dryland and savannah biomes with stripes to denote that many of these areas are not appropriate for forest restoration. Where trees would naturally exist, they often exist far below 100% canopy cover, and restoration of forest cover should be limited to natural conditions.
Fig. 3
Fig. 3. The living tree carbon potential estimated from the ground-sourced (GS1 and GS2) and satellite-derived (SD1 and SD2) models.
a, Total estimated living tree biomass potential of the GS1, GS2, SD1 and SD2 models. Error bars represent the lower and upper boundaries based on the 5% and 95% quantiles from a bootstrapping procedure. Colours represent the different input datasets, that is, upper or lower canopy cover boundaries (GS models) and ESA-CCI, Walker et al. or harmonized (SD models). Light colours above white lines indicate the difference between current and potential tree carbon stocks. b, Meta-analysis showing literature estimates of living tree carbon potential based on ensemble models,,, inventory data,– and mechanistic or data-driven models. The horizontal dashed line represents the average existing living tree carbon of 443 Gt C estimated in these publications. c, Differences between current and potential tree carbon stocks. d, Literature estimates for the difference between current and potential tree carbon stocks from ref.  (ensemble models), refs. ,,, (inventory data), refs. , (mechanistic models) and ref.  (data-driven models).
Fig. 4
Fig. 4. Sources of uncertainty in forest carbon potential for the GS and SD models.
a,b, Relative contribution of individual uncertainty sources to the overall uncertainty in carbon potential for the GS (a) and SD (b) models: (1) model approach (type 1 versus type 2 models); (2) input data (current aboveground tree carbon input, that is, upper and lower canopy cover boundaries for GS models and ESA-CCI, Walker et al. and harmonized for SD models); (3) aboveground biomass potential estimates (bootstrapping); (4) belowground biomass (accounting for uncertainties in both root mass fraction and aboveground biomass); (5) dead wood and litter (accounting for uncertainties in both dead wood and litter-to-tree biomass ratios and tree biomass); and (6) soil organic carbon potential. The maps show the top uncertainty source within each pixel. The pie charts show the relative contribution of uncertainties worldwide.
Fig. 5
Fig. 5. Contribution of land-use types, forest types, carbon pools and countries to the difference between current and potential ecosystem-level carbon stocks.
a, Of the 328 Gt C discrepancy between current and potential carbon stocks, 226 Gt C is found outside urban and agricultural (cropland and pasture) areas, with 61% in forested regions in which the recovery of degraded ecosystems can promote carbon capture (conservation potential) and 39% in regions in which forests have been removed (restoration potential). b, Relative contribution of forest degradation (conservation potential; blue area) and land-cover change (orange colours) to the difference between current and potential ecosystem-level carbon stocks. The darker blue area represents the conservation potential of 10.5 Gt C in forest plantation regions. c, Relative contribution of tropical, temperate, boreal and dryland forests to the total forest conservation potential. d, Relative contribution of the three main carbon pools (living biomass, dead wood and litter, and soil) to the difference between current and potential carbon stocks. e, The nine countries contributing more than 50% to the difference between current and potential carbon stocks.

References

    1. Pan Y, Birdsey RA, Phillips OL, Jackson RB. The structure, distribution, and biomass of the world’s forests. Annu. Rev. Ecol. Evol. Syst. 2013;44:593–622. doi: 10.1146/annurev-ecolsys-110512-135914. - DOI
    1. Walker W, et al. The global potential for increased storage of carbon on land. Proc. Natl Acad. Sci. 2022;119:e2111312119. doi: 10.1073/pnas.2111312119. - DOI - PMC - PubMed
    1. Bastin JF, et al. The global tree restoration potential. Science. 2019;364:76–79. doi: 10.1126/science.aax0848. - DOI - PubMed
    1. Erb K-H, et al. Unexpectedly large impact of forest management and grazing on global vegetation biomass. Nature. 2018;553:73–76. doi: 10.1038/nature25138. - DOI - PMC - PubMed
    1. Roebroek CTJ, Duveiller G, Seneviratne SI, Davin EL, Cescatt A. Releasing global forests from human management: How much more carbon could be stored? Science. 2023;380:749–753. doi: 10.1126/science.add5878. - DOI - PubMed

Publication types

MeSH terms