. 2023 Oct 25;13(21):3321.
doi: 10.3390/ani13213321.

Integrative Analysis of Transcriptomic and Lipidomic Profiles Reveals a Differential Subcutaneous Adipose Tissue Mechanism among Ningxiang Pig and Berkshires, and Their Offspring

Affiliations

Integrative Analysis of Transcriptomic and Lipidomic Profiles Reveals a Differential Subcutaneous Adipose Tissue Mechanism among Ningxiang Pig and Berkshires, and Their Offspring

Xiaoxiao Deng et al. Animals (Basel). .

Abstract

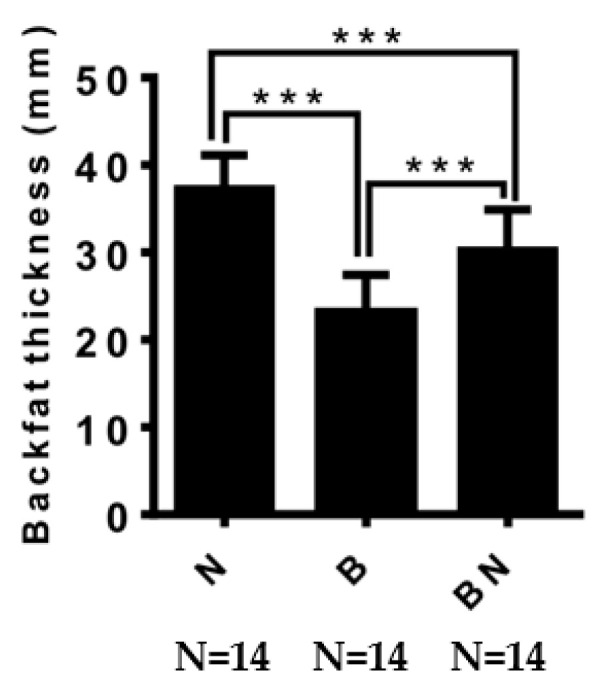
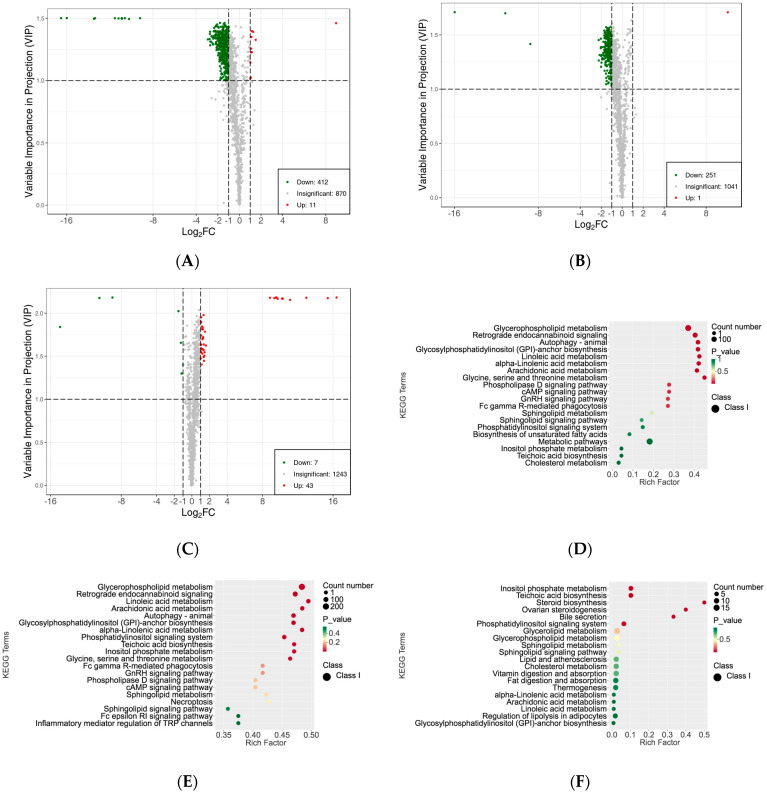
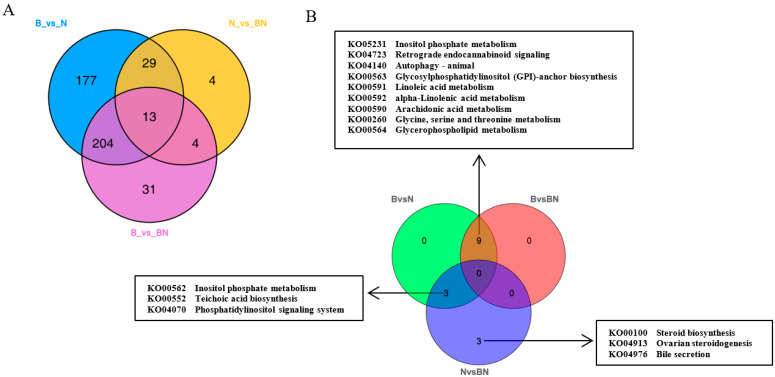
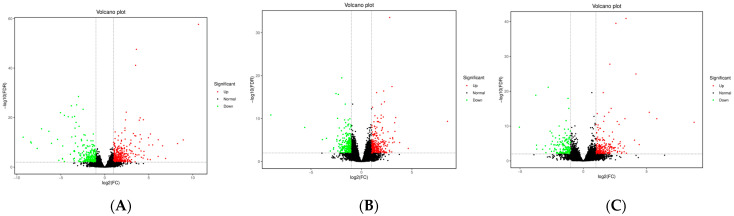
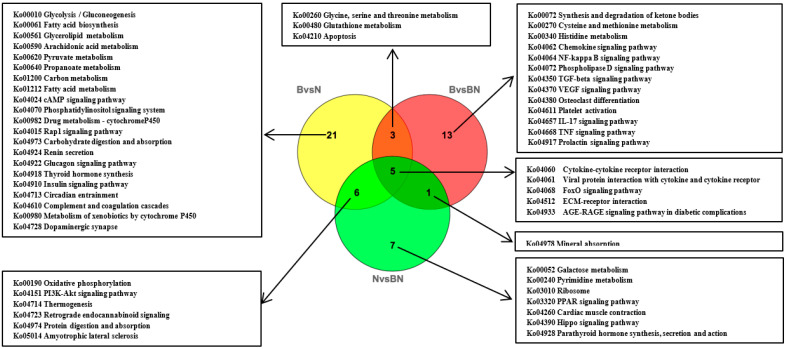
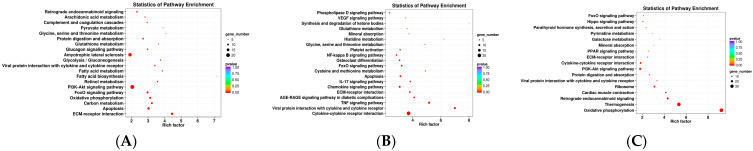
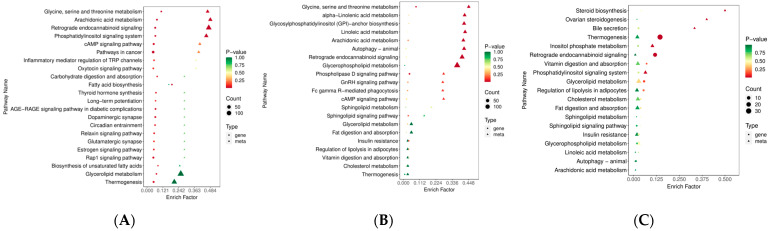
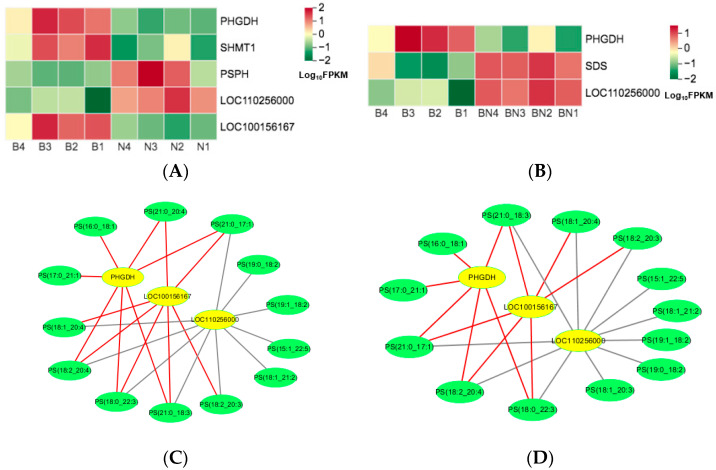
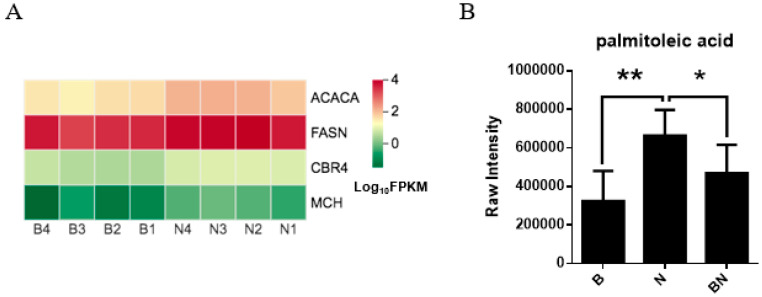
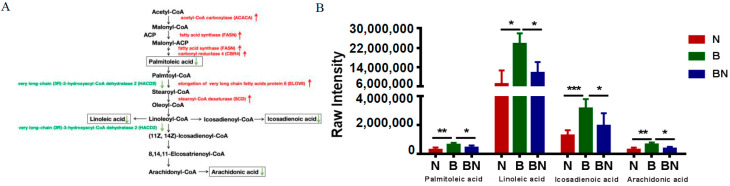
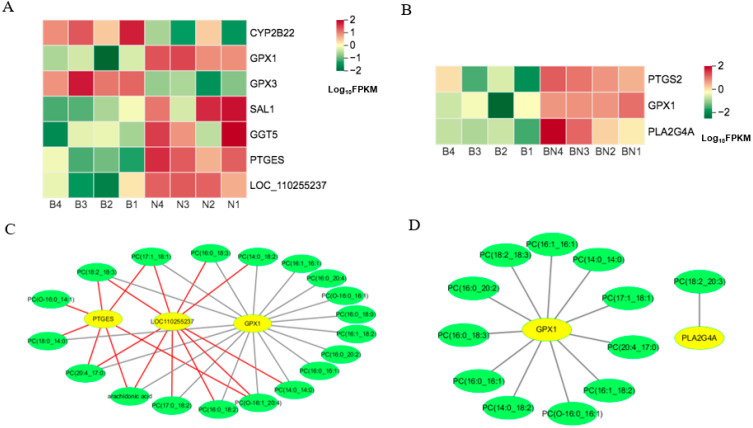
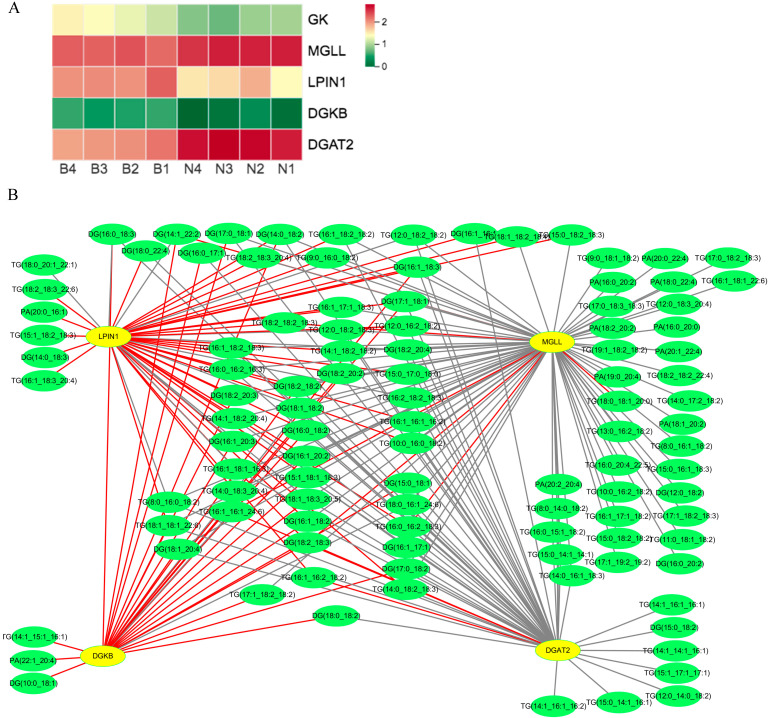
Adipose tissue composition contributes greatly to the quality and nutritional value of meat. Transcriptomic and lipidomic techniques were used to investigate the molecular mechanisms of the differences in fat deposition in Ningxiang pigs, Berkshires and F1 offspring. Transcriptomic analysis identified 680, 592, and 380 DEGs in comparisons of Ningxiang pigs vs. Berkshires, Berkshires vs. F1 offspring, and Ningxiang pigs vs. F1 offspring. The lipidomic analysis screened 423, 252, and 50 SCLs in comparisons of Ningxiang pigs vs. Berkshires, Berkshires vs. F1 offspring, and Ningxiang pigs vs. F1 offspring. Lycine, serine, and the threonine metabolism pathway, fatty acid biosynthesis and metabolism-related pathways were significantly enriched in comparisons of Berkshires vs. Ningxiang pigs and Berkshires vs. F1 offspring. The DEGs (PHGDH, LOC110256000) and the SCLs (phosphatidylserines) may have a great impact on the glycine, serine, and the threonine metabolism pathway. Moreover, the DEGs (FASN, ACACA, CBR4, SCD, ELOV6, HACD2, CYP3A46, CYP2B22, GPX1, and GPX3) and the SCLs (palmitoleic acid, linoleic acid, arachidonic acid, and icosadienoic acid) play important roles in the fatty acid biosynthesis and metabolism of fatty acids. Thus, the difference in fat deposition among Ningxiang pig, Berkshires, and F1 offspring may be caused by differences in the expression patterns of key genes in multiple enriched KEGG pathways. This research revealed multiple lipids that are potentially available biological indicators and screened key genes that are potential targets for molecular design breeding. The research also explored the molecular mechanisms of the difference in fat deposition among Ningxiang pig, Berkshires, and F1 pigs, and provided an insight into selection for backfat thickness and the fat composition of adipose tissue for future breeding strategies.

Keywords: KEGG pathways; lipidomic; pigs; subcutaneous adipose tissue; transcriptomic.


Conflict of interest statement

The authors declare no conflict of interest.

Figures

Figure 1
Figure 1
The difference in backfat thickness among Ningxiang pigs, Berkshires, and F1 offspring. B, Berkshires; N, Ningxiang pig; BN, F1 offspring. *** represent p < 0.001.
Figure 2
Figure 2
Differences in the lipidomic profiles of the subcutaneous adipose tissue. (AC) Volcano plots of SCLs for the subcutaneous adipose tissue in Berkshires vs. Ningxiang pigs (A), Berkshires vs. F1 offspring (B), Ningxiang pigs vs. F1 offspring (C), green dots represent downregulated SCLs, red dots represent upregulated SCLs. (DF) Diagrams of the degree of KEGG pathway enrichment of SCLs in the subcutaneous adipose tissue from the group of Berkshires vs. Ningxiang pigs (D), Berkshires vs. F1 offspring (E), and Ningxiang pigs vs. F1 offspring (F). Eighteen samples of subcutaneous adipose from six Ningxiang pigs, six Berkshires, and six F1 pigs, respectively, were used to detect lipidomic profile.
Figure 3
Figure 3
(A) Venn diagram of the SCLs identified by lipidomic analysis in the groups of Berkshires vs. Ningxiang pigs, in Berkshires vs. F1 offspring, and in Ningxiang pigs vs. F1 offspring. (B) Venn diagram analysis of KEGG pathways (p < 0.05) based on the SCLs in Berkshires vs. Ningxiang pigs, in Berkshires vs. F1 offspring, and in Ningxiang pigs vs. F1 offspring. Eighteen samples of subcutaneous adipose from six Ningxiang pigs, six Berkshires and six F1 pigs, respectively, were used to detect lipidomic profile. B, Berkshires; N, Ningxiang pig; BN, F1 offspring.
Figure 4
Figure 4
Volcano plots of DEGs for the subcutaneous adipose tissue in the groups of Berkshires vs. Ningxiang pigs (A), Ningxiang pigs vs. F1 offspring (B), and Berkshires vs. F1 offspring (C). Twelve samples of subcutaneous adipose from four Ningxiang pigs, four Berkshires, and four F1 pigs, respectively, were used to detect transcriptomic profile.
Figure 5
Figure 5
Venn diagram of the KEGG pathway analysis (p < 0.05) based on DEGs in Berkshires vs. Ningxiang pigs, F1 offspring vs. Berkshires, and Ningxiang pigs vs. F1 offspring, based on transcriptomic data. B, Berkshires; N, Ningxiang pigs; BN, F1 offspring. Twelve samples of subcutaneous adipose from four Ningxiang pigs, four Berkshires, and four F1 pigs, respectively, were used to detect transcriptomic profile.
Figure 6
Figure 6
The diagrams for the KEGG pathway enrichment of DEGs in Berkshires vs. Ningxiang pigs (A), Ningxiang pigs vs. F1 offspring (B), and Berkshires vs. F1 offspring (C). Twelve samples of subcutaneous adipose from four Ningxiang pigs, four Berkshires, and four F1 pigs, respectively, were used to detect the transcriptomic profile.
Figure 7
Figure 7
The diagrams for the degree of KEGG pathway enrichment of the DEGs and SCLs in the subcutaneous adipose tissue from Berkshires vs. Ningxiang pigs (A), Berkshires vs. F1 offspring (B), Ningxiang pigs vs. F1 offspring (C).
Figure 8
Figure 8
Heat maps of DEGs for the KO00260 pathway in Berkshires vs. Ningxiang pigs (A) and Berkshires vs. F1 offspring (B), respectively. B, Berkshires; N, Ningxiang pigs; BN, F1 offspring. Correlation network diagram for the KO00260 (the lycine, serine and threonine metabolism) pathways in Berkshires vs. Ningxiang pigs (C) and Berkshires vs. F1 offspring (D), respectively. Yellow circles represent genes, green circles represent lipids, red lines represent positive correlations, gray lines represent negative correlations.
Figure 9
Figure 9
(A) Heat maps of the DEGs for the KO00061 (fatty acid biosynthesis) pathways in Berkshires vs. Ningxiang pigs. B, Berkshires; N, Ningxiang pigs. (B) The column chart of palmitoleic acid, in Berkshires pigs vs. Ningxiang pigs. B, Berkshires; N, Ningxiang pigs; BN, F1 offspring. * represents p < 0.05, ** represents p < 0.01.
Figure 10
Figure 10
(A) The DEGs and SCLs related to the KO01040 (biosynthesis of unsaturated fatty acids) in Berkshires vs. Ningxiang pigs. Red represents upregulation, green represents downregulation. (B) The column chart of the SCLs related to the KEGG pathway (kO01040) in Berkshires, Ningxiang pigs, and F1 pigs. * represents p < 0.05, ** represents p < 0.01, *** represents p < 0.001.
Figure 11
Figure 11
(A,B) Heat maps of the DEGs for the KO00590 pathway in Berkshires vs. Ningxiang pigs (A) and Berkshires vs. F1 offspring (B). B, Berkshires; N, Ningxiang pigs; BN, F1 offspring. Correlation network diagram for the KO00590 pathway in Berkshires vs. Ningxiang pigs (C) and Berkshires vs. F1 offspring (D). Yellow circles represent genes, green circles represent lipids, red lines represent positive correlations and gray lines represent negative correlations.
Figure 12
Figure 12
(A) Heat maps of the DEGs for the KO00561 pathway in Berkshires vs. Ningxiang pigs. B, Berkshires; N, Ningxiang pigs; BN, F1 offspring. (B) Correlation network diagram for the KO00561 pathway in Berkshires vs. Ningxiang pigs. Yellow circles represent genes, green circles represent lipids, red lines represent positive correlations, and gray lines represent negative correlations.
Figure 13
Figure 13
(A) Histogram of RNA-seq and RT−qPCR expression levels. The X−axis represents the 12 selected DEGs, and the Y-axis represents the expression levels of DEGs from RNA−seq and RT−qPCR. (B) The linear regression analysis of expression level between RNA−seq and RT−qPCR data. Eighteen samples of subcutaneous adipose from six Ningxiang pigs, six Berkshires and six F1 pigs, respectively, were used to conduct RT−qPCR.

Similar articles

Cited by

References

    1. Kershaw E.E., Flier J.S. Adipose tissue as an endocrine organ. J. Clin. Endocrinol. Metab. 2004;89:2548–2556. doi: 10.1210/jc.2004-0395. - DOI - PubMed
    1. Barea R., Nieto R., Aguilera J.F. Effects of the dietary protein content and the feeding level on protein and energy metabolism in Iberian pigs growing from 50 to 100 kg body weight. Animal. 2007;1:357–365. doi: 10.1017/S1751731107666099. - DOI - PubMed
    1. Wood J.D., Enser M., Fisher A.V., Nute G.R., Sheard P.R., Richardson R.I., Hughes S.I., Whittington F.M. Fat deposition, fatty acid composition and meat quality: A review. Meat Sci. 2008;78:343–358. doi: 10.1016/j.meatsci.2007.07.019. - DOI - PubMed
    1. Barea R., Isabel B., Nieto R., López-Bote C., Aguilera J.F. Evolution of the fatty acid profile of subcutaneous back-fat adipose tissue in growing Iberian and Landrace × Large White pigs. Animal. 2013;7:688–698. doi: 10.1017/S175173111200184X. - DOI - PubMed
    1. Zhang Z.W., Liao Q.C., Sun Y., Pan T.L., Liu S.Q., Miao W.W., Li Y.X., Zhou L., Xu G.X. Lipidomic and Transcriptomic Analysis of the Longissimus Muscle of Luchuan and Duroc Pigs. Front. Nutr. 2021;8:667622. doi: 10.3389/fnut.2021.667622. - DOI - PMC - PubMed

LinkOut - more resources