

The Application of Synthetic Flavors in Zebrafish (Danio rerio) Rearing with Emphasis on Attractive Ones: Effects on Fish Development, Welfare, and Appetite
- PMID: 37958124
- PMCID: PMC10647473
- DOI: 10.3390/ani13213368
The Application of Synthetic Flavors in Zebrafish (Danio rerio) Rearing with Emphasis on Attractive Ones: Effects on Fish Development, Welfare, and Appetite
Abstract
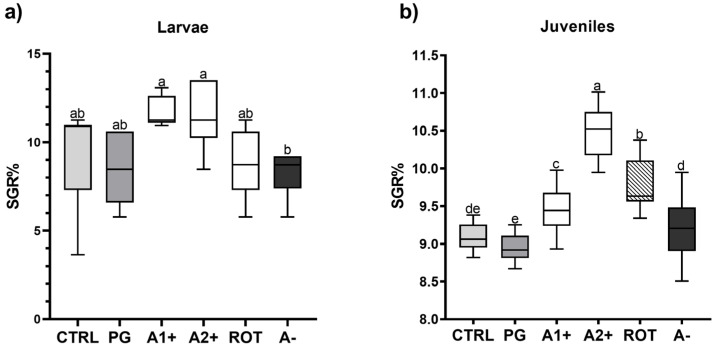
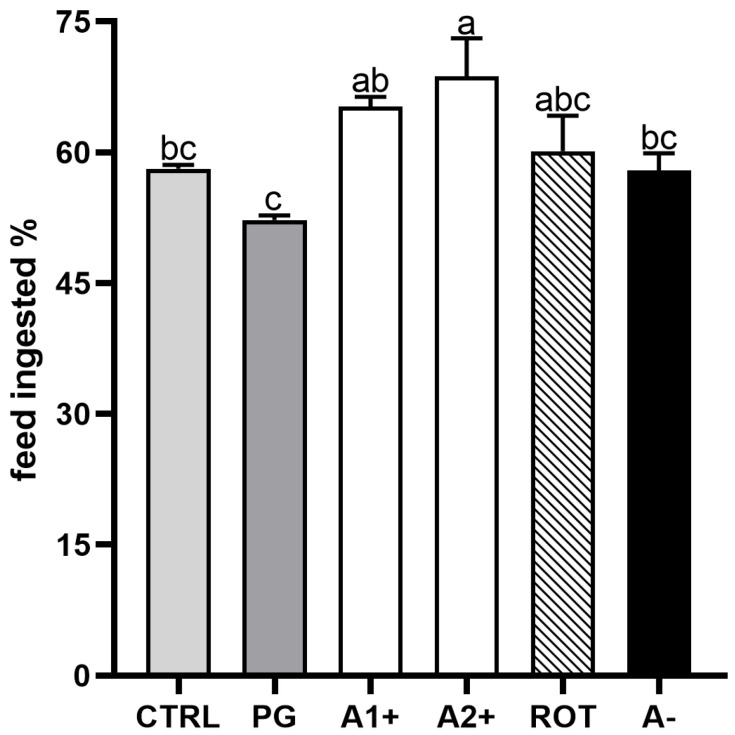
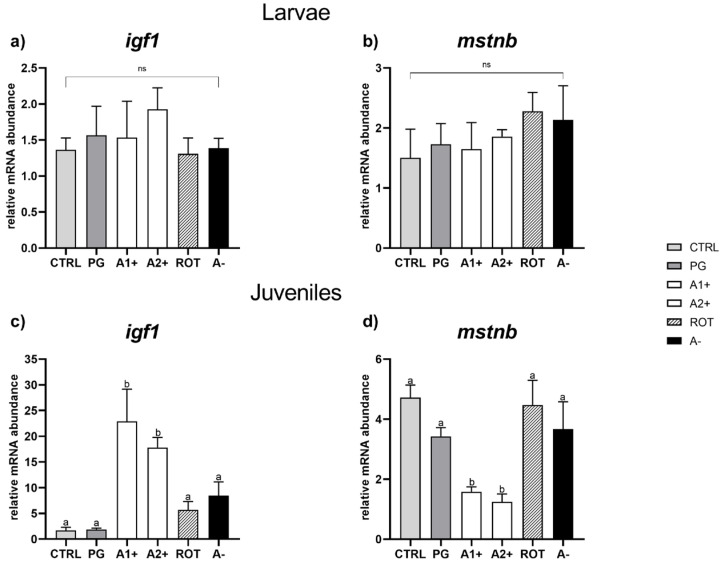
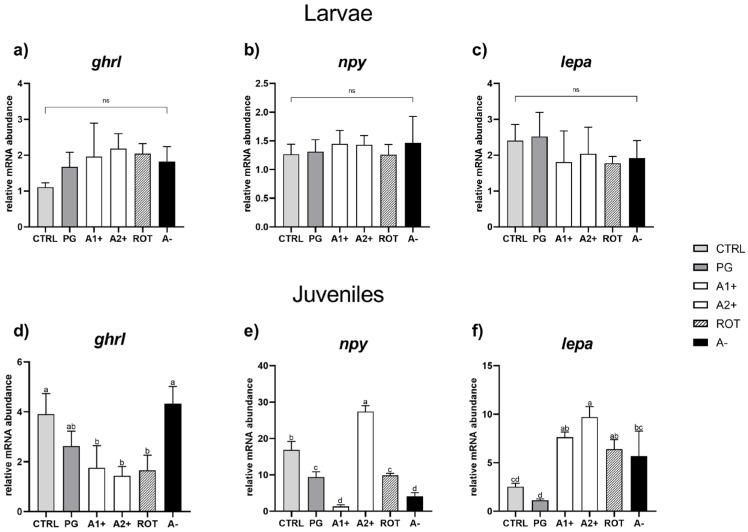
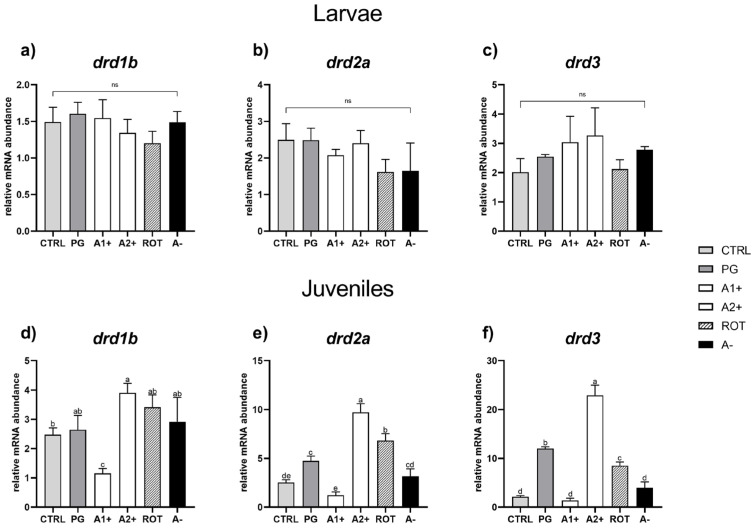
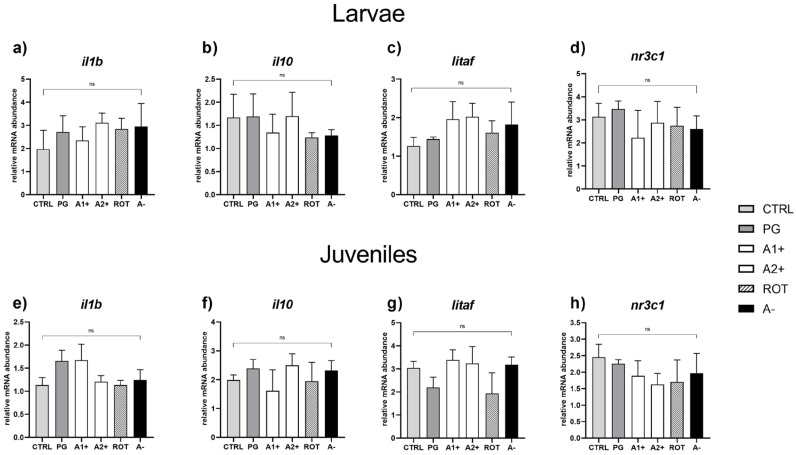
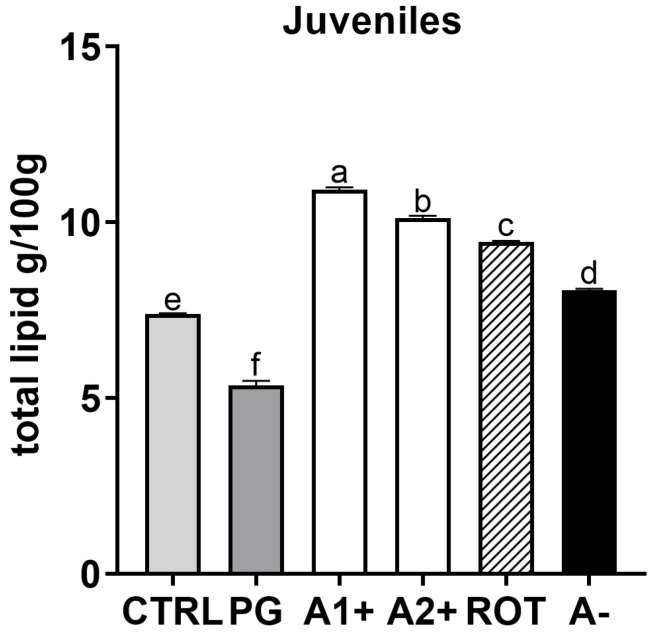
The aim of the present study was to test synthetic flavors as potential feed attractants in zebrafish (Danio rerio) during early development. Six experimental groups were set up in triplicate: (i) a CTRL group fed a zebrafish commercial diet; (ii) a PG group fed a control diet added with Propylene Glycol (PG); (iii) A1+ and A2+ groups fed a control diet added with 1% of the two attractive flavors (A1+ cheese odor made by mixing Propylene Glycol (PG) with the aromatic chemicals trimethyamine, 2-acetylpyrazine, 2-acetylpyridine, and dimethyl sulfide; and A2+ caramel odor, made of PG mixed with the aromatic chemicals vanillin, maltol, cyclotene, acetoin, butyric acid, and capric acid with traces of both gamma-octalactone and gamma-esalactone) or the repulsive flavor (A- coconut odor, made by mixing PG with the aromatic chemicals gamma-eptalactone, gamma-nonalactone, delta-esalactone, and vanillin with trace of both delta-octalactone and maltol), respectively; (iv) an ROT group fed the two attractive diets, each administered singularly in a weekly rotation scheme. All the tested synthetic flavors did not affect the overall health of larval and juvenile fish and promoted growth. Due to the longer exposure time, results obtained from the juvenile stage provided a clearer picture of the fish responses: zebrafish fed both attractive diets showed higher appetite stimulus, feed ingestion, and growth, while the brain dopaminergic activity suggested the A2+ diet as the most valuable solution for its long-lasting effect over the whole experiment (60-day feeding trial, from larvae to adults). The present study provided important results about the possible use of attractive synthetic flavors for aquafeed production, opening new sustainable and more economically valuable opportunities for the aquaculture sector.
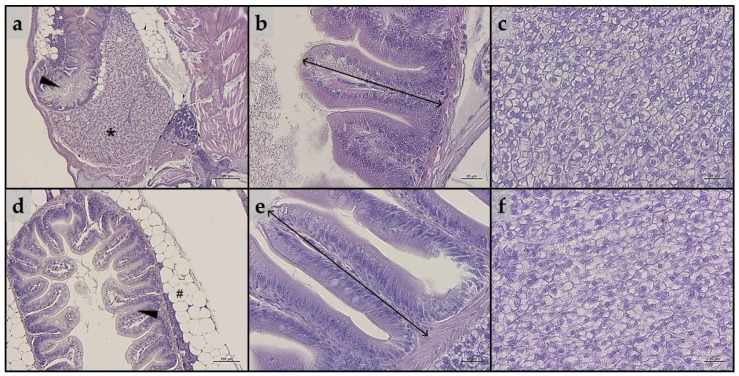
Keywords: feed attractant; feed intake; growth factors; histology; zebrafish development.
Conflict of interest statement
The authors declare no conflict of interest. The funders had no role in the design of the study; in the collection, analyses, or interpretation of data; in the writing of the manuscript; or in the decision to publish the results.
Figures
References
-
- FAO In Brief to the State of World Fisheries and Aquaculture 2022. Towards Blue Transformation. 2022. [(accessed on 27 July 2023)]. Available online: https://www.fao.org/documents/card/en/c/cc0463en.
-
- Edwards P. Aquaculture Environment Interactions: Past, Present and Likely Future Trends. Aquaculture. 2015;447:2–14. doi: 10.1016/j.aquaculture.2015.02.001. - DOI
-
- Kokou F., Fountoulaki E. Aquaculture Waste Production Associated with Antinutrient Presence in Common Fish Feed Plant Ingredients. Aquaculture. 2018;495:295–310. doi: 10.1016/j.aquaculture.2018.06.003. - DOI
-
- Tacon A.G.J., Metian M. Feed Matters: Satisfying the Feed Demand of Aquaculture. Rev. Fish. Sci. Aquac. 2015;23:1–10. doi: 10.1080/23308249.2014.987209. - DOI
-
- Estruch G., Collado M.C., Monge-Ortiz R., Tomás-Vidal A., Jover-Cerdá M., Peñaranda D.S., Pérez Martínez G., Martínez-Llorens S. Long-Term Feeding with High Plant Protein Based Diets in Gilthead Seabream (Sparus aurata, L.) Leads to Changes in the Inflammatory and Immune Related Gene Expression at Intestinal Level. BMC Vet. Res. 2018;14:1–15. doi: 10.1186/s12917-018-1626-6. - DOI - PMC - PubMed
Grants and funding
LinkOut - more resources
Full Text Sources
