. 2023 Nov 3;13(21):3376.
doi: 10.3390/diagnostics13213376.

Structural and Functional Changes in Non-Paraneoplastic Autoimmune Retinopathy

Affiliations

Structural and Functional Changes in Non-Paraneoplastic Autoimmune Retinopathy

Amir Akhavanrezayat et al. Diagnostics (Basel). .

Abstract

Background: To describe longitudinal changes in patients with non-paraneoplastic autoimmune retinopathy (npAIR) by utilizing different diagnostic modalities/tests.

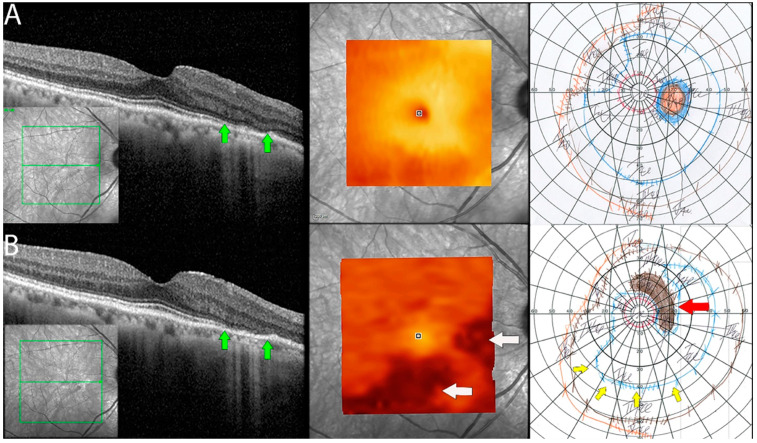
Methods: The index study is a retrospective longitudinal review of sixteen eyes of eight patients from a tertiary care eye hospital diagnosed with npAIR. Multiple diagnostic modalities such as wide-angle fundus photography (WAFP), WA fundus autofluorescence (WAFAF), spectral-domain optical coherence tomography (SD-OCT), Goldmann visual field (GVF) perimetry, microperimetry (MP), electrophysiologic testing, and adaptive optics scanning laser ophthalmoscopy (AOSLO) were reviewed and analyzed.

Results: At the baseline visits, anomalies were detected by multimodal diagnostic tests on all patients. Subjects were followed up for a median duration of 11.5 [3.0-18.7] months. Structural changes at the baseline were detected in 14 of 16 (87.5%) eyes on WAFP and WAFAF and 13 of 16 (81.2%) eyes on SD-OCT. Eight of the ten (80%) eyes that underwent AOSLO imaging depicted structural changes. Functional changes were detected in 14 of 16 (87.5%) eyes on GVF, 15 of 16 (93.7%) eyes on MP, and 11 of 16 (68.7%) eyes on full-field electroretinogram (ff-ERG). Multifocal electroretinogram (mf-ERG) and visual evoked potential (VEP) tests were performed in 14 eyes, of which 12 (85.7%) and 14 (100%) of the eyes demonstrated functional abnormalities, respectively, at baseline. Compared to all the other structural diagnostic tools, AOSLO had a better ability to demonstrate deterioration in retinal microstructures occurring at follow-ups. Functional deterioration at follow-up was detected on GVF in 8 of 10 (80%) eyes, mf-ERG in 4 of 8 (50%) eyes, and MP in 7 of 16 (43.7%) eyes. The ff-ERG and VEP were stable in the majority of cases at follow-up.

Conclusions: The utilization of multimodal imaging/tests in the diagnosing and monitoring of npAIR patients can aid in identifying anomalous changes over time. Analysis of both the anatomical and functional aspects by these devices can be supportive of detecting the changes early in such patients. AOSLO shows promise as it enables the capture of high-resolution images demonstrating quantifiable changes to retinal microstructure.

Keywords: AIR; AOSLO; GVF; Goldmann visual field; adaptive optics; functional changes; microperimetry; non-paraneoplastic autoimmune retinopathy; retina imaging; structural changes.


Conflict of interest statement

The authors declare no conflict of interest.

Figures

Figure 1
Figure 1
(A) Stoplight chart of results from initial imaging. This table illustrates findings seen on baseline imaging in patients whose charts were reviewed. Cells colored in green represent normal results. Cells colored in red represent the presence of abnormal findings. Cells were left blank in cases where the imaging modality was not available or performed. * Poor BCVA is secondary to sub foveal scarring. ** Poor BCVA is secondary to cystoid macular edema. *** As we retrospectively enrolled the patients, all recruited eyes had proof of ERG abnormality at a particular time point; however, those abnormalities were not observed on the initial visit for the selected three eyes. (B) Stoplight chart of changes seen on follow-up imaging assessments. This table illustrates changes seen on follow-up imaging in patients whose charts were reviewed. Cells colored in green represent a documented improvement over the follow-up period. Cells colored in yellow represent stable findings with no significant changes over the follow-up period. Cells colored in red represent documented worsening over the follow-up period. Cells were left blank in cases where follow-up imaging was not available. This figure reveals that few imaging modalities can reliably demonstrate changes seen even in extended follow-up periods, emphasizing the importance of utilizing multi-modal imaging in the follow-up of npAIR patients. * Improvement was secondary to cataract surgery. ** Improvement was secondary to the resolution of cystoid macular edema.
Figure 1
Figure 1
(A) Stoplight chart of results from initial imaging. This table illustrates findings seen on baseline imaging in patients whose charts were reviewed. Cells colored in green represent normal results. Cells colored in red represent the presence of abnormal findings. Cells were left blank in cases where the imaging modality was not available or performed. * Poor BCVA is secondary to sub foveal scarring. ** Poor BCVA is secondary to cystoid macular edema. *** As we retrospectively enrolled the patients, all recruited eyes had proof of ERG abnormality at a particular time point; however, those abnormalities were not observed on the initial visit for the selected three eyes. (B) Stoplight chart of changes seen on follow-up imaging assessments. This table illustrates changes seen on follow-up imaging in patients whose charts were reviewed. Cells colored in green represent a documented improvement over the follow-up period. Cells colored in yellow represent stable findings with no significant changes over the follow-up period. Cells colored in red represent documented worsening over the follow-up period. Cells were left blank in cases where follow-up imaging was not available. This figure reveals that few imaging modalities can reliably demonstrate changes seen even in extended follow-up periods, emphasizing the importance of utilizing multi-modal imaging in the follow-up of npAIR patients. * Improvement was secondary to cataract surgery. ** Improvement was secondary to the resolution of cystoid macular edema.
Figure 2
Figure 2
Fundus findings of patient 6 with non-paraneoplastic autoimmune retinopathy (npAIR) at baseline. Color fundus photography illustrates a fundus with a small number of hyperpigmented spicule-like lesions (arrows) scattered around the optic nerve (A). Fundus autofluorescence highlights the extent of RPE damage (B).
Figure 3
Figure 3
OCT demonstrating ELM and EZ loss in non-paraneoplastic autoimmune retinopathy (npAIR). OCT scans illustrate the right (A) and left (B) eyes of patient 4 who presented with 20/20 vision in both eyes. The right eye shows diffuse loss of external limiting membrane and ellipsoid zone with the sparing of a central foveal island (area between green arrows). Three months later, the patient’s visual acuity decreased to 20/50.
Figure 4
Figure 4
Retinal pigment epithelial changes in non-paraneoplastic autoimmune retinopathy (npAIR). Sequential optical coherence tomography (OCT) imaging in an npAIR patient 5. Column (A) shows imaging from the initial visit. Column (B) shows imaging on the last documented consult. RPE changes that can be seen include disorganization of normally uniform RPE layer with the layer appearing granulated, migration of RPE to inner retinal structures, areas of focal RPE loss, and increased visibility of Bruch’s membrane signal secondary to RPE losses. Changes can be observed longitudinally (green arrows).
Figure 5
Figure 5
Documented worsening in patient 1 with non-paraneoplastic autoimmune retinopathy (npAIR). Row (A) shows right eye results of OCT central B scan, OCT en face scan showing segmented outer retinal layers, and Goldmann perimetry (GP) performed on initial consultation with row (B) showing changes 15 months later. The patient had documented worsening. Central OCT scan shows thinning and focal loss of ELM/EZ complex (space between green arrows). This is supported by a segmented en face scan of the outer retina, which shows generalized thinning of the outer retina with the development of focal thinning nasally, with the inferior retina also displaying significant changes compared to the initial scan (white arrows). Follow-up GP shows changes that correlate to OCT findings with the development of blind spot enlargement (red arrow) and constriction of the visual field (yellow arrows).
Figure 6
Figure 6
The baseline OCT of patient 3 (A). He had a slow sub foveal development of new focal ELM and EZ losses as well as a slow extension of existing lesions over a 13-month period, despite receiving therapy (blue arrows) (D). These structural changes corresponded to physiological changes detected by microperimetry (B,E) and multifocal ERG (C,F), which depicted an overall decrease in the retinal sensitivity to visual stimulus.
Figure 7
Figure 7
Optics scanning laser ophthalmoscopy (AOSLO) and detectable OCT changes in non-paraneoplastic autoimmune retinopathy (npAIR); images are from patient 2. This figure illustrates follow-up changes in the left eye of an npAIR patient (patient 2). Row (A) shows imaging performed at baseline, and row (B) shows follow-up imaging conducted at month 15. En face OCT showed a segmented outer retina with sparing of the central island and generally reduced outer retina thickness indices in the follow-up visit. The use of AOSLO enables visualization of the cone-photoreceptor mosaic. Semi-automated cone quantification of the preselected area in this cone-photoreceptor mosaic showed a decrease in cone density, which corresponds with retinal OCT findings.

References

    1. Grange L., Dalal M., Nussenblatt R.B., Sen H.N. Autoimmune retinopathy. Am. J. Ophthalmol. 2014;157:266–272.e261. doi: 10.1016/j.ajo.2013.09.019. - DOI - PMC - PubMed
    1. Taylor A.W. Ocular immunosuppressive microenvironment. Chem. Immunol. 1999;73:72–89. - PubMed
    1. Forrester J.V., Xu H. Good news-bad news: The Yin and Yang of immune privilege in the eye. Front. Immunol. 2012;3:338. doi: 10.3389/fimmu.2012.00338. - DOI - PMC - PubMed
    1. Adamus G. Are Anti-Retinal Autoantibodies a Cause or a Consequence of Retinal Degeneration in Autoimmune Retinopathies? Front. Immunol. 2018;9:765. doi: 10.3389/fimmu.2018.00765. - DOI - PMC - PubMed
    1. Adamus G., Ren G., Weleber R.G. Autoantibodies against retinal proteins in paraneoplastic and autoimmune retinopathy. BMC Ophthalmol. 2004;4:5. doi: 10.1186/1471-2415-4-5. - DOI - PMC - PubMed

LinkOut - more resources