Identification of a Complex Karyotype Signature with Clinical Implications in AML and MDS-EB Using Gene Expression Profiling
- PMID: 37958462
- PMCID: PMC10648390
- DOI: 10.3390/cancers15215289
Identification of a Complex Karyotype Signature with Clinical Implications in AML and MDS-EB Using Gene Expression Profiling
Abstract
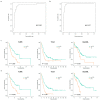
Complex karyotype (CK) is associated with a poor prognosis in both acute myeloid leukemia (AML) and myelodysplastic syndrome with excess blasts (MDS-EB). Transcriptomic analyses have improved our understanding of the disease and risk stratification of myeloid neoplasms; however, CK-specific gene expression signatures have been rarely investigated. In this study, we developed and validated a CK-specific gene expression signature. Differential gene expression analysis between the CK and non-CK groups using data from 348 patients with AML and MDS-EB from four cohorts revealed enrichment of the downregulated genes localized on chromosome 5q or 7q, suggesting that haploinsufficiency due to the deletion of these chromosomes possibly underlies CK pathogenesis. We built a robust transcriptional model for CK prediction using LASSO regression for gene subset selection and validated it using the leave-one-out cross-validation method for fitting the logistic regression model. We established a 10-gene CK signature (CKS) predictive of CK with high predictive accuracy (accuracy 94.22%; AUC 0.977). CKS was significantly associated with shorter overall survival in three independent cohorts, and was comparable to that of previously established risk stratification models for AML. Furthermore, we explored of therapeutic targets among the genes comprising CKS and identified the dysregulated expression of superoxide dismutase 1 (SOD1) gene, which is potentially amenable to SOD1 inhibitors.
Keywords: AML; MDS; SOD1; complex karyotype; gene expression.
Conflict of interest statement
The authors declare no conflict of interest. The funders had no role in the design of the study; in the collection, analyses, or interpretation of data; in the writing of the manuscript; or in the decision to publish the results.
Figures


Similar articles
-
Identification of distinctive long noncoding RNA competitive interactions and a six-methylated-gene prognostic signature in acute myeloid leukemia with -5/del(5q) or -7/del(7q).J Cell Biochem. 2020 Feb;121(2):1563-1574. doi: 10.1002/jcb.29391. Epub 2019 Sep 18. J Cell Biochem. 2020. PMID: 31535409
-
Double minute chromosomes in acute myeloid leukemia and myelodysplastic syndromes are associated with complex karyotype, monosomal karyotype, TP53 deletion, and TP53 mutations.Leuk Lymphoma. 2021 Oct;62(10):2466-2474. doi: 10.1080/10428194.2021.1919663. Epub 2021 Apr 27. Leuk Lymphoma. 2021. PMID: 33904352
-
Clinical features of complex karyotype in newly diagnosed acute myeloid leukemia.Int J Hematol. 2023 Apr;117(4):544-552. doi: 10.1007/s12185-022-03522-6. Epub 2022 Dec 26. Int J Hematol. 2023. PMID: 36572814
-
Cytogenetic and genetic pathways in therapy-related acute myeloid leukemia.Chem Biol Interact. 2010 Mar 19;184(1-2):50-7. doi: 10.1016/j.cbi.2009.11.025. Epub 2009 Dec 1. Chem Biol Interact. 2010. PMID: 19958752 Free PMC article. Review.
-
Loss of 5q in myeloid malignancies - A gain in understanding of biological and clinical consequences.Blood Rev. 2021 Mar;46:100735. doi: 10.1016/j.blre.2020.100735. Epub 2020 Jul 23. Blood Rev. 2021. PMID: 32736878 Review.
Cited by
-
Impact of TP53 mutation on genetic and cellular hierarchy profile in complex karyotype AML/MDS with increased blasts.Blood Cancer J. 2024 Nov 15;14(1):201. doi: 10.1038/s41408-024-01188-3. Blood Cancer J. 2024. PMID: 39548077 Free PMC article. No abstract available.
-
Recent Advances towards the Understanding of Secondary Acute Myeloid Leukemia Progression.Life (Basel). 2024 Feb 27;14(3):309. doi: 10.3390/life14030309. Life (Basel). 2024. PMID: 38541635 Free PMC article. Review.
References
-
- Papaemmanuil E., Gerstung M., Malcovati L., Tauro S., Gundem G., Van Loo P., Yoon C.J., Ellis P., Wedge D.C., Pellagatti A., et al. Clinical and biological implications of driver mutations in myelodysplastic syndromes. Blood. 2013;122:3616–3627. doi: 10.1182/blood-2013-08-518886. - DOI - PMC - PubMed
Grants and funding
LinkOut - more resources
Full Text Sources
Research Materials
Miscellaneous

