. 2023 Oct 24;24(21):15513.
doi: 10.3390/ijms242115513.

Targeted Mass Spectrometry Reveals Interferon-Dependent Eicosanoid and Fatty Acid Alterations in Chronic Myeloid Leukaemia

Affiliations

Targeted Mass Spectrometry Reveals Interferon-Dependent Eicosanoid and Fatty Acid Alterations in Chronic Myeloid Leukaemia

Hannah C Scott et al. Int J Mol Sci. .

Abstract

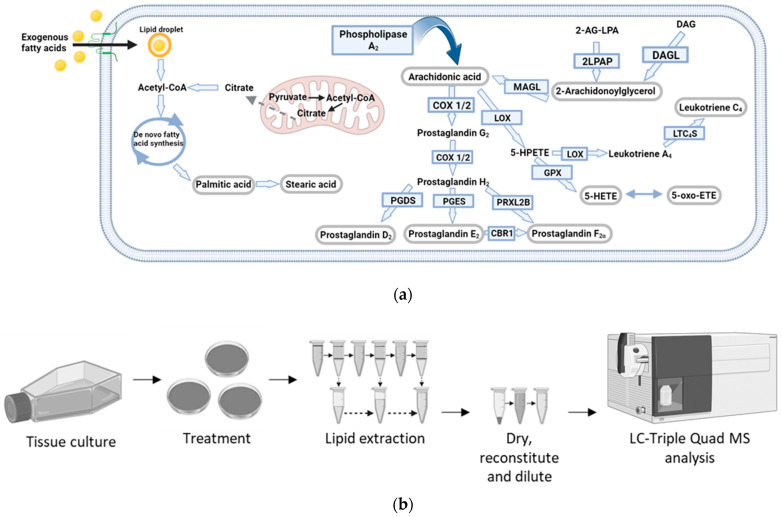
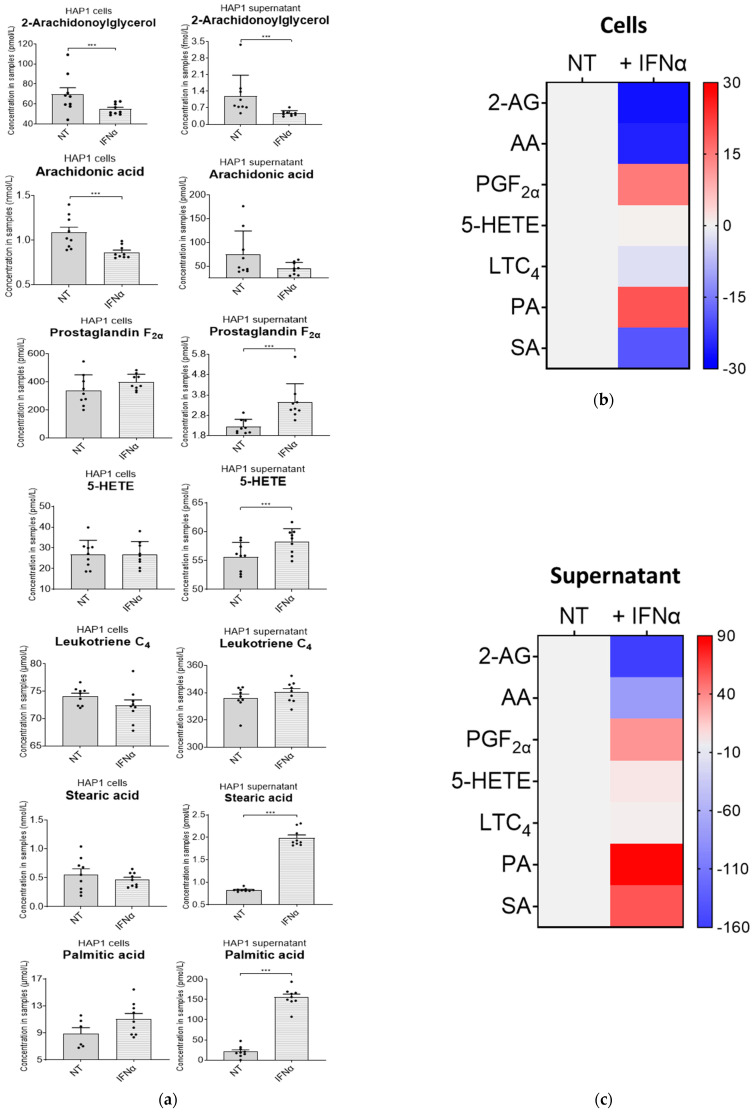
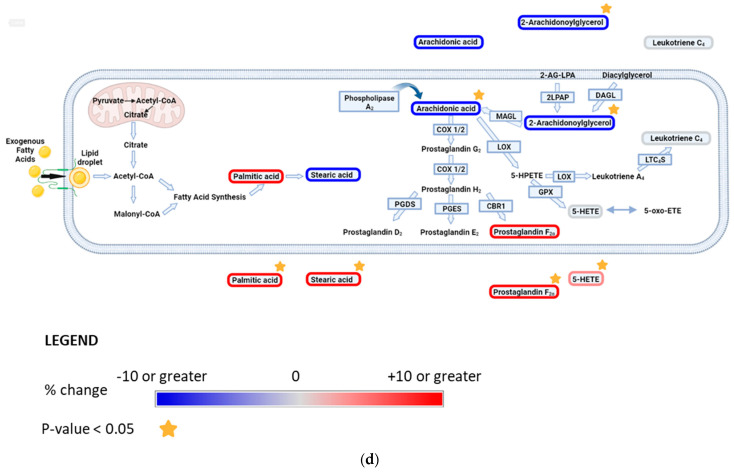
Bioactive lipids are involved in cellular signalling events with links to human disease. Many of these are involved in inflammation under normal and pathological conditions. Despite being attractive molecules from a pharmacological point of view, the detection and quantification of lipids has been a major challenge. Here, we have optimised a liquid chromatography-dynamic multiple reaction monitoring-targeted mass spectrometry (LC-dMRM-MS) approach to profile eicosanoids and fatty acids in biological samples. In particular, by applying this analytic workflow to study a cellular model of chronic myeloid leukaemia (CML), we found that the levels of intra- and extracellular 2-Arachidonoylglycerol (2-AG), intracellular Arachidonic Acid (AA), extracellular Prostaglandin F (PGF), extracellular 5-Hydroxyeicosatetraenoic acid (5-HETE), extracellular Palmitic acid (PA, C16:0) and extracellular Stearic acid (SA, C18:0), were altered in response to immunomodulation by type I interferon (IFN-I), a currently approved treatment for CML. Our observations indicate changes in eicosanoid and fatty acid metabolism, with potential relevance in the context of cancer inflammation and CML.

Keywords: bioactive lipids; cancer inflammation; cancer metabolism; chronic myeloid leukaemia; eicosanoids; fatty acids; innate immunity; lipidomics; mass spectrometry; type I interferon response.


Conflict of interest statement

The authors declare no conflict of interest.

Figures

Figure 1
Figure 1
Eicosanoid pathway and methodology workflow. (a) Metabolic pathways of selected bioactive lipids. Converting enzymes are in boxes and the lipids in this study are circled in grey. De novo lipogenesis leading to fatty acid synthesis, which results in the elongation of fatty acids, produces Palmitic acid and Stearic acid. Exogenous fatty acid uptake is carried out via transmembrane transporters. (b) Optimised experimental workflow for the analysis of eicosanoids and fatty acids was conducted using ultra-high-performance liquid chromatography-dMRM-MS (UPLC-dMRM-MS). Cells were cultured in IMDM media containing 10% foetal bovine serum (FBS) and grown until 60–70% confluent. Cells were then treated with 1000 U/mL of IFNα-2b for 36 h, reaching ~80% confluence. The surrounding media (the cell supernatant) was collected from the plates and cells were lysed. Lipid extraction from cells and cell supernatants was performed with Methanol/Methyl tert-butyl ether/chloroform (MeOH/MTBE/CHCl3) and acetonitrile (ACN), respectively. Lipid extracts were subsequently dried and reconstituted in 50% (v/v) MeOH (in H2O) prior to LC-MS analysis.
Figure 2
Figure 2
Method reproducibility (intraday analysis). Lipid standards were combined and analysed in technical triplicate at two concentrations, 0.3 pmol (grey dots) and 3 pmol (black dots) on-column, respectively. The CV between technical triplicates was calculated (as %) for each standard, as a mean of the two concentrations (dashed line) or individually (dots).
Figure 3
Figure 3
Interferon alpha modulates eicosanoid and fatty acid pathways. (a) Analysis of bioactive lipids in HAP1 cells and cell supernatants after 36 h treatment with IFN-I. (a) Graphs represent the mean with the standard error of the mean (SEM). Cell results are the graphs on the left; the corresponding cell supernatant is on the right. Grey bars are for the not-treated sample (NT) and grey bars with a white stripe pattern are the results for the IFN-I-treated samples. The statistical analysis is the two sample (or unpaired) t-test. A p-value less than 0.05 (***) suggests that the results have highly significant differences. If there is no significance difference, it is not labelled. (b) Mean percentage change of bioactive lipids in HAP1 cells, not-treated (NT) and treated with IFNα for 36 h (+IFNα). (c) Cell supernatant from HAP1 cells, not-treated (NT) and treated with IFNα for 36 h (+IFNα). Heat maps display normalised lipid abundances relative to the mean concentration of the non-treated samples (NT), which is represented by the grey bars. For IFN treatment, blue results are for a decrease in concentration, in percentage, grey is for no change and red is for an increase in concentration in percentage. (d) Bioactive lipid profile after 36 h treatment with IFN-I. Converting enzymes are in boxes and the lipids in this study are circled. Lipids circled in grey have no change compared to non-treated cells; lipids circled in blue have a decreased concentration compared to non-treated cells; and lipids circled in red have an increased concentration compared to non-treated cells. Lipids discovered in the cell supernatant are outside of the cell lipid membrane. Lipids with a significant difference between non-treated and treated (a p-value of less than 0.05) are indicated by a yellow star.
Figure 3
Figure 3
Interferon alpha modulates eicosanoid and fatty acid pathways. (a) Analysis of bioactive lipids in HAP1 cells and cell supernatants after 36 h treatment with IFN-I. (a) Graphs represent the mean with the standard error of the mean (SEM). Cell results are the graphs on the left; the corresponding cell supernatant is on the right. Grey bars are for the not-treated sample (NT) and grey bars with a white stripe pattern are the results for the IFN-I-treated samples. The statistical analysis is the two sample (or unpaired) t-test. A p-value less than 0.05 (***) suggests that the results have highly significant differences. If there is no significance difference, it is not labelled. (b) Mean percentage change of bioactive lipids in HAP1 cells, not-treated (NT) and treated with IFNα for 36 h (+IFNα). (c) Cell supernatant from HAP1 cells, not-treated (NT) and treated with IFNα for 36 h (+IFNα). Heat maps display normalised lipid abundances relative to the mean concentration of the non-treated samples (NT), which is represented by the grey bars. For IFN treatment, blue results are for a decrease in concentration, in percentage, grey is for no change and red is for an increase in concentration in percentage. (d) Bioactive lipid profile after 36 h treatment with IFN-I. Converting enzymes are in boxes and the lipids in this study are circled. Lipids circled in grey have no change compared to non-treated cells; lipids circled in blue have a decreased concentration compared to non-treated cells; and lipids circled in red have an increased concentration compared to non-treated cells. Lipids discovered in the cell supernatant are outside of the cell lipid membrane. Lipids with a significant difference between non-treated and treated (a p-value of less than 0.05) are indicated by a yellow star.

Similar articles

References

    1. Wang C., Yang J., Zhang X. Editorial: The Role of Bioactive Lipids in Homeostasis and Pathology. Front. Physiol. 2021;12:773632. doi: 10.3389/fphys.2021.773632. - DOI - PMC - PubMed
    1. Minhas P.S., Latif-Hernandez A., McReynolds M.R., Durairaj A.S., Wang Q., Rubin A., Joshi A.U., He J.Q., Gauba E., Liu L., et al. Restoring metabolism of myeloid cells reverses cognitive decline in ageing. Nature. 2021;590:122–128. doi: 10.1038/s41586-020-03160-0. - DOI - PMC - PubMed
    1. Lindqvist H.M., Winkvist A., Gjertsson I., Calder P.C., Armando A.M., Quehenberger O., Coras R., Guma M. Influence of Dietary n-3 Long Chain Polyunsaturated Fatty Acid Intake on Oxylipins in Erythrocytes of Women with Rheumatoid Arthri-tis. Molecules. 2023;28:717. doi: 10.3390/molecules28020717. - DOI - PMC - PubMed
    1. Zhou Y.J., Wang J.H., Li L., Yang H.W., Wen D.L., He Q.C. Expanding expression of the 5-lipoxygenase/leukotriene B4 pathway in atherosclerotic lesions of diabetic patients promotes plaque instability. Biochem. Biophys. Res. Commun. 2007;363:30–36. doi: 10.1016/j.bbrc.2007.08.134. - DOI - PubMed
    1. Cipollone F., Mezzetti A., Fazia M.L., Cuccurullo C., Iezzi A., Ucchino S., Spigonardo F., Bucci M., Cuccurullo F., Prescott S.M., et al. Association between 5-lipoxygenase expression and plaque instability in humans. Arter. Thromb. Vasc. Biol. 2005;25:1665–1670. doi: 10.1161/01.ATV.0000172632.96987.2d. - DOI - PubMed